Community Well-being
Homelessness
What is the measure?
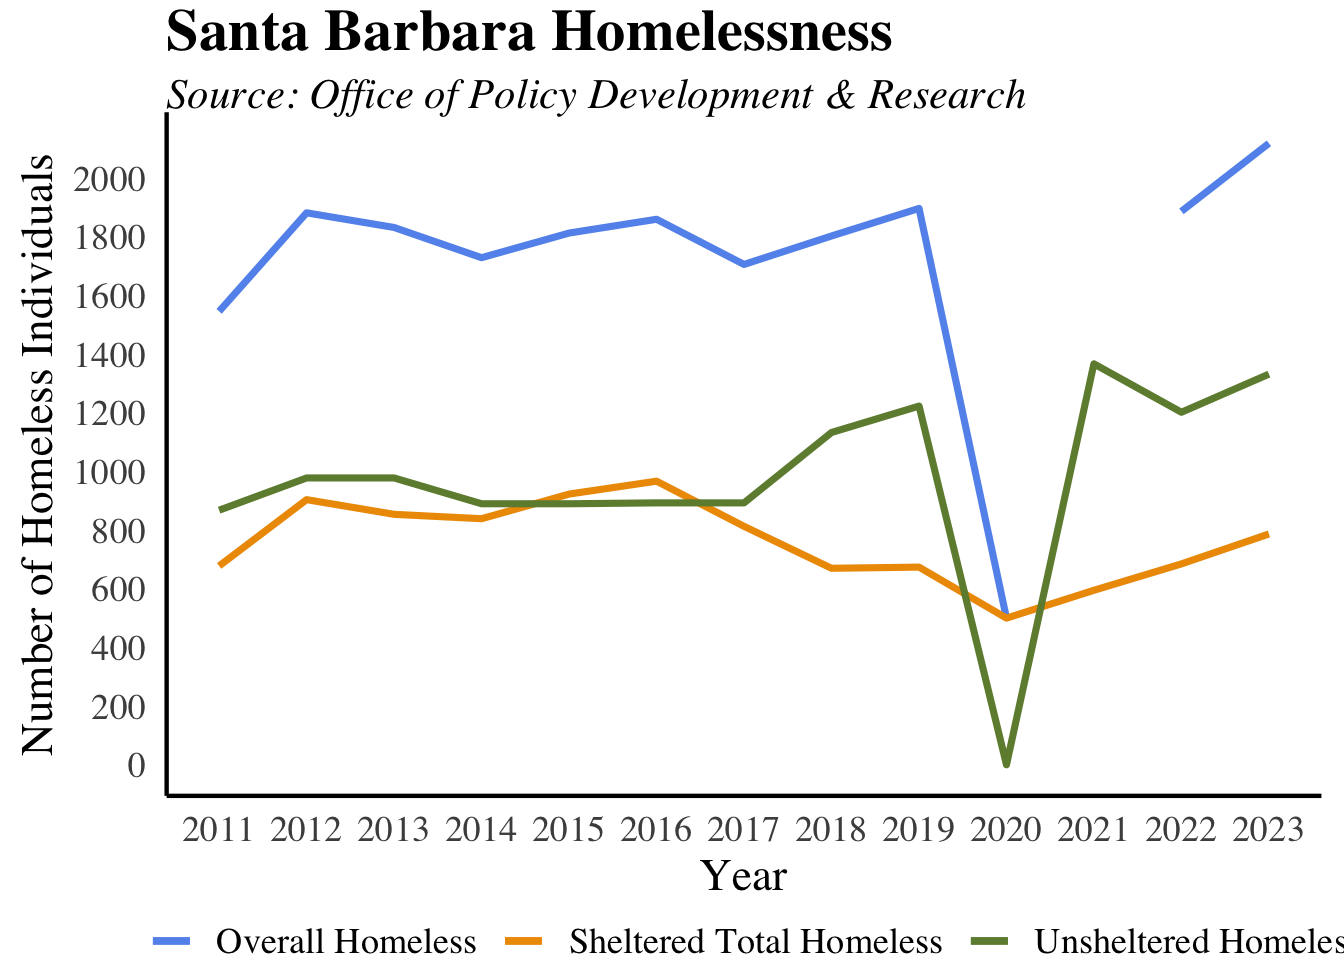
The data is sourced from the U.S. Department of Housing and Urban Development (HUD). The measure is an estimate of the number of homeless individuals in Santa Barbara County annually. The measure includes sheltered and unsheltered individuals.
HUD defines sheltered individuals as people who are in emergency shelters, transitional housing programs, or safe havens. Unsheltered individuals refer to those whose nighttime location is in a public or private area that is not intended for regular sleeping accommodation. This can include streets, vehicles, and parks.
Why is it important?
Homelessness is a humanitarian concern and can have implications on public health and safety. Homeless individuals face heightened risks of poor health, limited access to basic services, and increased vulnerability to crime and substance abuse. Measuring homeless populations can help allocate adequate funding to resources including affordable housing, healthcare services, and mental health resources which can mitigate the public health risks and social challenges associated with homelessness.
How are we doing?
In the last decade, overall homelessness in the county reached its peak in 2023, with approximately 0.48% of the total population being homeless, with 787 sheltered and 1332 unsheltered. This is over double the national average (0.19%) but aligns with California’s average. The number of homeless youth was declining between 2017 to 2022 (247 to 185) but has recently spiked to 220 in 2023. There is a gap in the data from 2020-2022 in sheltered homeless cases, likely due to the pandemic.
Poverty Rates UPDATE (graphs & analysis)
What is the measure?
Poverty data for Santa Barbara County comes from the Census Bureau’s American Community Survey (ACS). The ACS is an annual survey providing communities with estimates on various social, economic, and demographic characteristics. Poverty is measured using money income before taxes and does not include capital gains or non-cash benefits; however, unemployment, social security, and other public assistance income are included. Official poverty thresholds are nationwide and are updated for inflation annually. The threshold for individuals under 65 in 2023 was $15,225, while for a family of two adults and two children, it was $29,678. “All families” includes any size family considered below the poverty threshold and is included in the count of “All people” in poverty.
Why is it important?
Historic poverty data can assess the effectiveness of poverty reduction strategies and inform the county on where to target resources within the community. Detailed data on poverty can identify vulnerable groups while promoting greater overall well-being. Comparing poverty rates to state or national averages can help keep the county accountable and highlight progress made.
How are we doing?
In 2022, Santa Barbara County had a poverty rate of 13.5%, which is higher than that of San Francisco County, the state of California, and the overall U.S. average. Over time, the county’s poverty rate has been slightly declining from 14.8% in 2018, but it has remained above the California average for all five years displayed. In 2022, 7.3% of families in the county lived below the poverty line, of which less than a quarter received cash public assistance income in the past 12 months.
Crime in Santa Barbara
What is the measure?
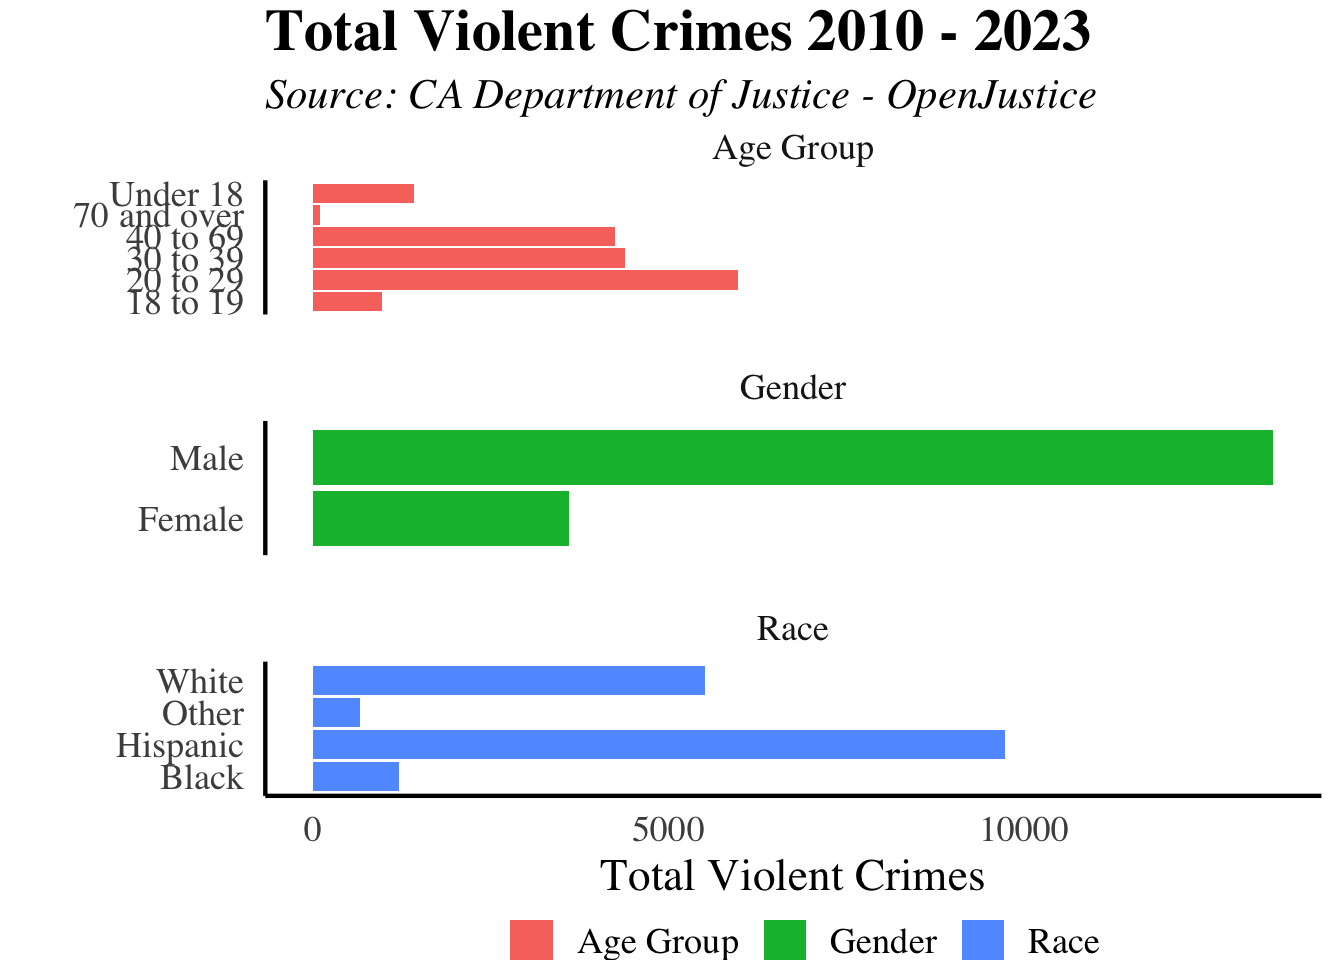
This dataset including Santa Barbara crime data is pulled from the California Department of Justice - OpenJustice data portal detailing aggregated counts of arrests by county. Each arrest is categorized by gender, race or ethnic group, age group and offense level.
Why is it important?
Understanding patterns in violent crime arrests provides valuable insights into various demographic trends in criminal behaviour within Santa Barbara county. By identifying arrest trends, policymakers, law enforcement, and community organizations can implement targeted preventative education, promote equitable justice practices, and foster greater trust in public safety.
How are we doing?
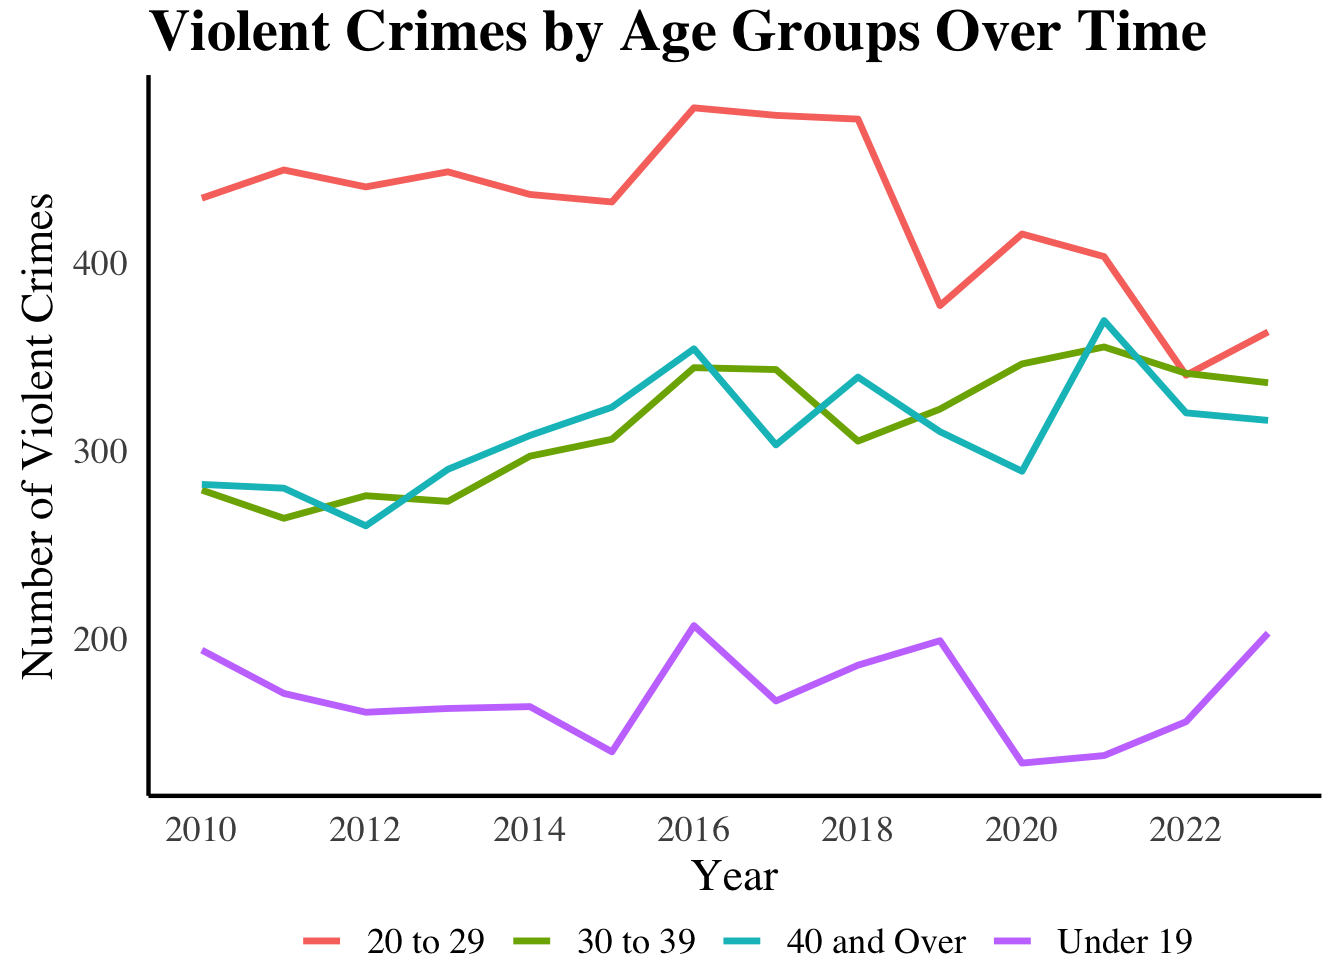
From 2010 to 2023, males accounted for the majority of arrests for violent crimes in Santa Barbara County, with male arrests totaling at 13,497, while female arrests were only 3,589 for violent crimes. For age group, the majority of arrests were made for individuals between the ages of 20 to 29, the number of arrests reaching its peak in 2016, and inconsistently declining since then. Meanwhile Santa Barbara county is experiencing an exponential increase of arrests for individuals under 19 years old since 2020, with a 23.5% increase in arrests for individuals under 19 between 2022 and 2023. Additionally, there are sharp disparities in number of arrests between different racial groups, specifically Whites and Hispanics comprising the large majority of individuals who were arrested for violent crimes in Santa Barbara.
Health
Heart Diseases Remain the Leading Cause of Death in Santa Barbara County
What is the measure?
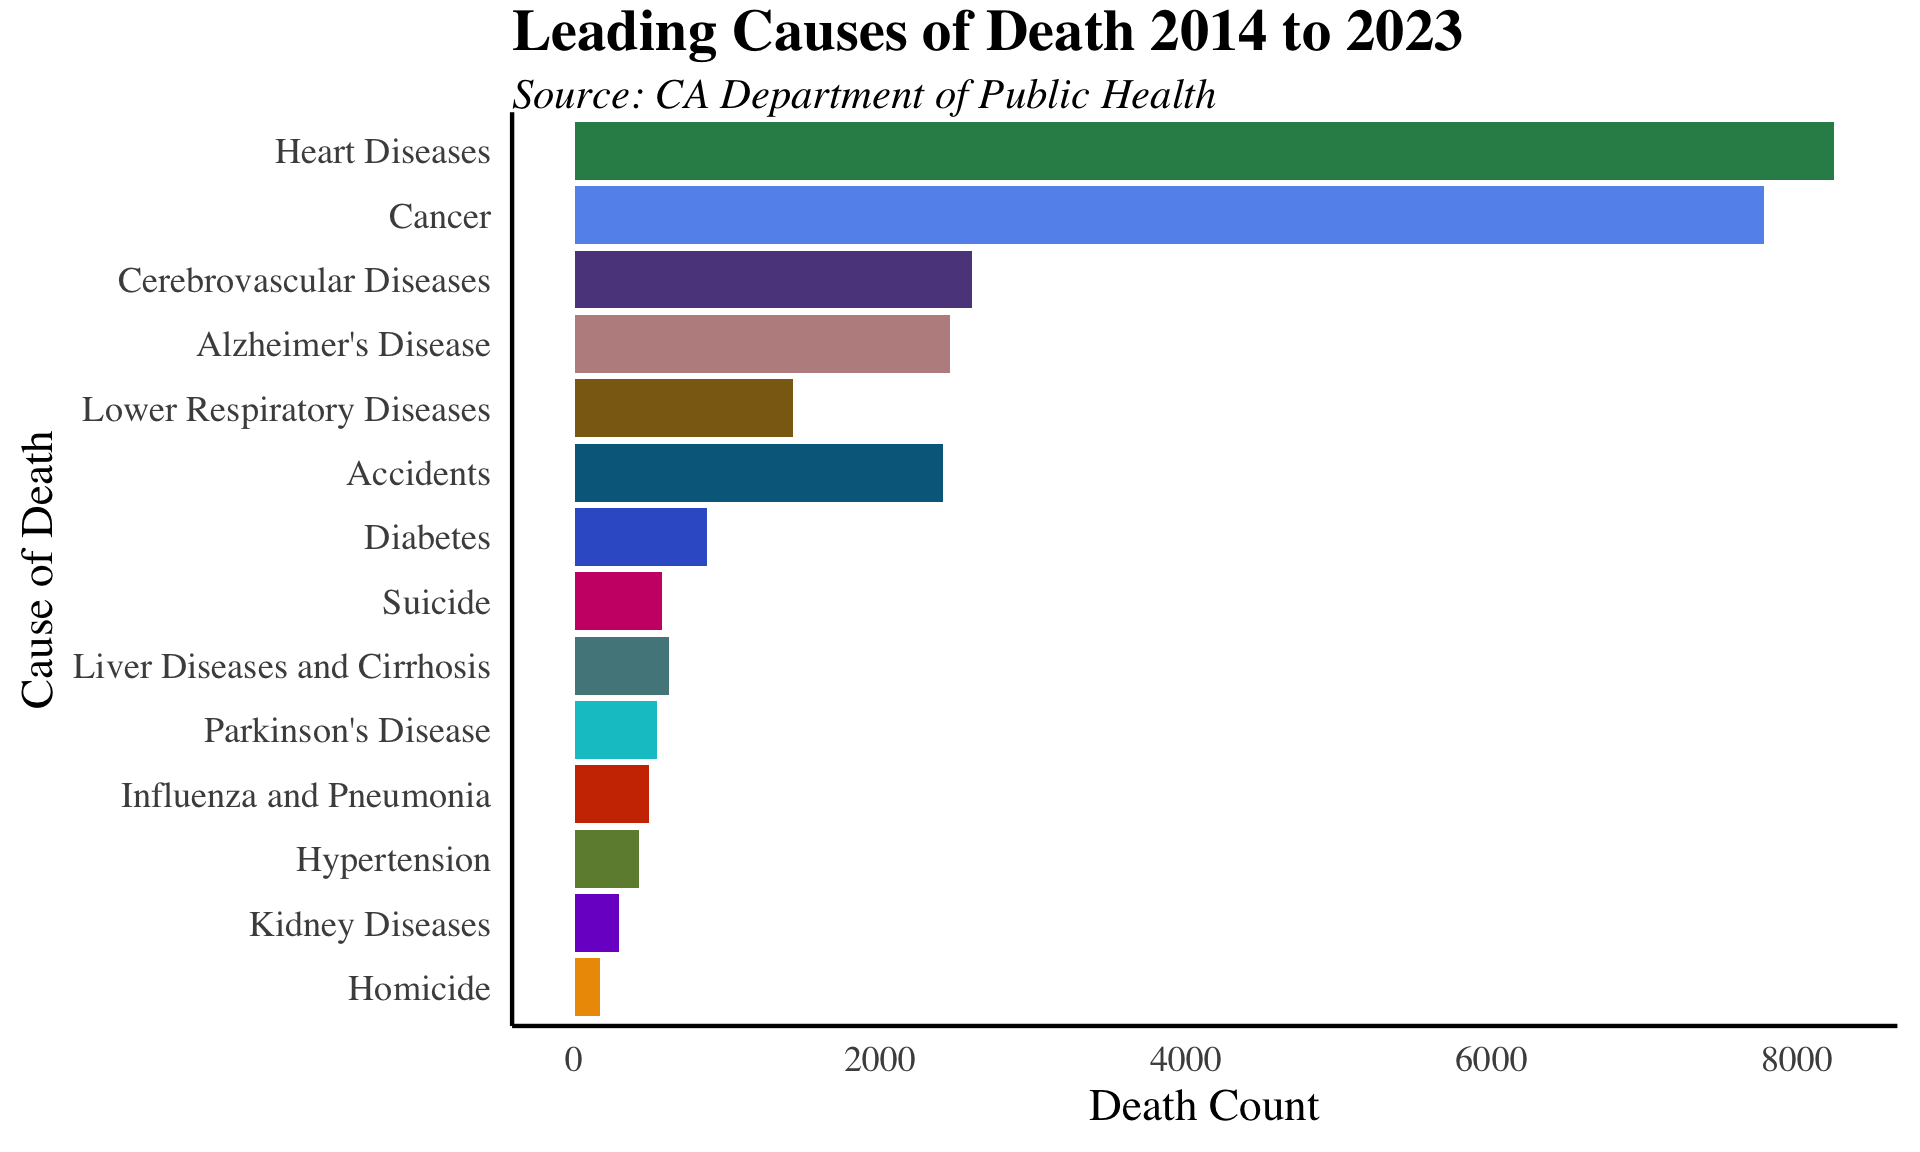
The number of deaths in the last decade in Santa Barbara county are recorded by the California Department of Public Health and generalized by county, cause of death, age group, race, gender, and place of death. The data encompasses deaths of Santa Barbara County residents from 2014-2023. It is important to note that the underlying cause of death may not capture the full impact of each cause of death as it does not always take into account all conditions contributing to the death.
Why is it important?
The data provides insight into the health status of a population and the most significant health challenges that the community faces. Public health officials and policymakers can identify areas where improvements in healthcare, public health interventions, or social determinants of health are needed.
How are we doing?
The leading cause of death for the last decade for Santa Barbara County was heart disease, referring to conditions including coronary heart disease, heart failure, and atrial fibrillation (AFib). This trend has persisted globally since 1950, with cancer ranking as the second leading cause of death.
Social Indicators
Demographics
Population Growth
What is the measure?
The data comes from the California Department of Finance and is an estimate of the number of people residing in Santa Barbara County from 2010 to 2024. The estimate is produced summing the population base, births, and net migration, and then subtracting the number of deaths.
Why is it important?
Population growth rates provide insight into the pace of population change in a given region over time. These rates can have significant implications for various areas, including public policy, economic growth, environmental sustainability, and social well-being. For instance, a high population growth rate may require a corresponding increase in infrastructure, such as housing, transportation, and healthcare, to accommodate the growing population. Alternatively, a declining population growth rate may indicate a shrinking workforce or an aging population, which can have significant economic and social consequences.
How are we doing?
Santa Barbara County has experienced modest yet sustained population growth until a significant drop in 2020 that lasted until 2021 resulting in a loss of 8,999 residents (from 450,551 to 441,552). In 2021, Santa Barbara experiences the lowest population level for the county since 2014 at 441,552. The population has yet to return to its previous level, however the population growth since its drop in 2020 appears to be, for the most part, consistently positive. This is consistent with other counties depicted in the other figure, each showing a significant decrease in population growth rate from 2020 to 2021, but on an upward trend since.