Economic Forecast Project Monthly Update
2024-10-30
1 Employment Update
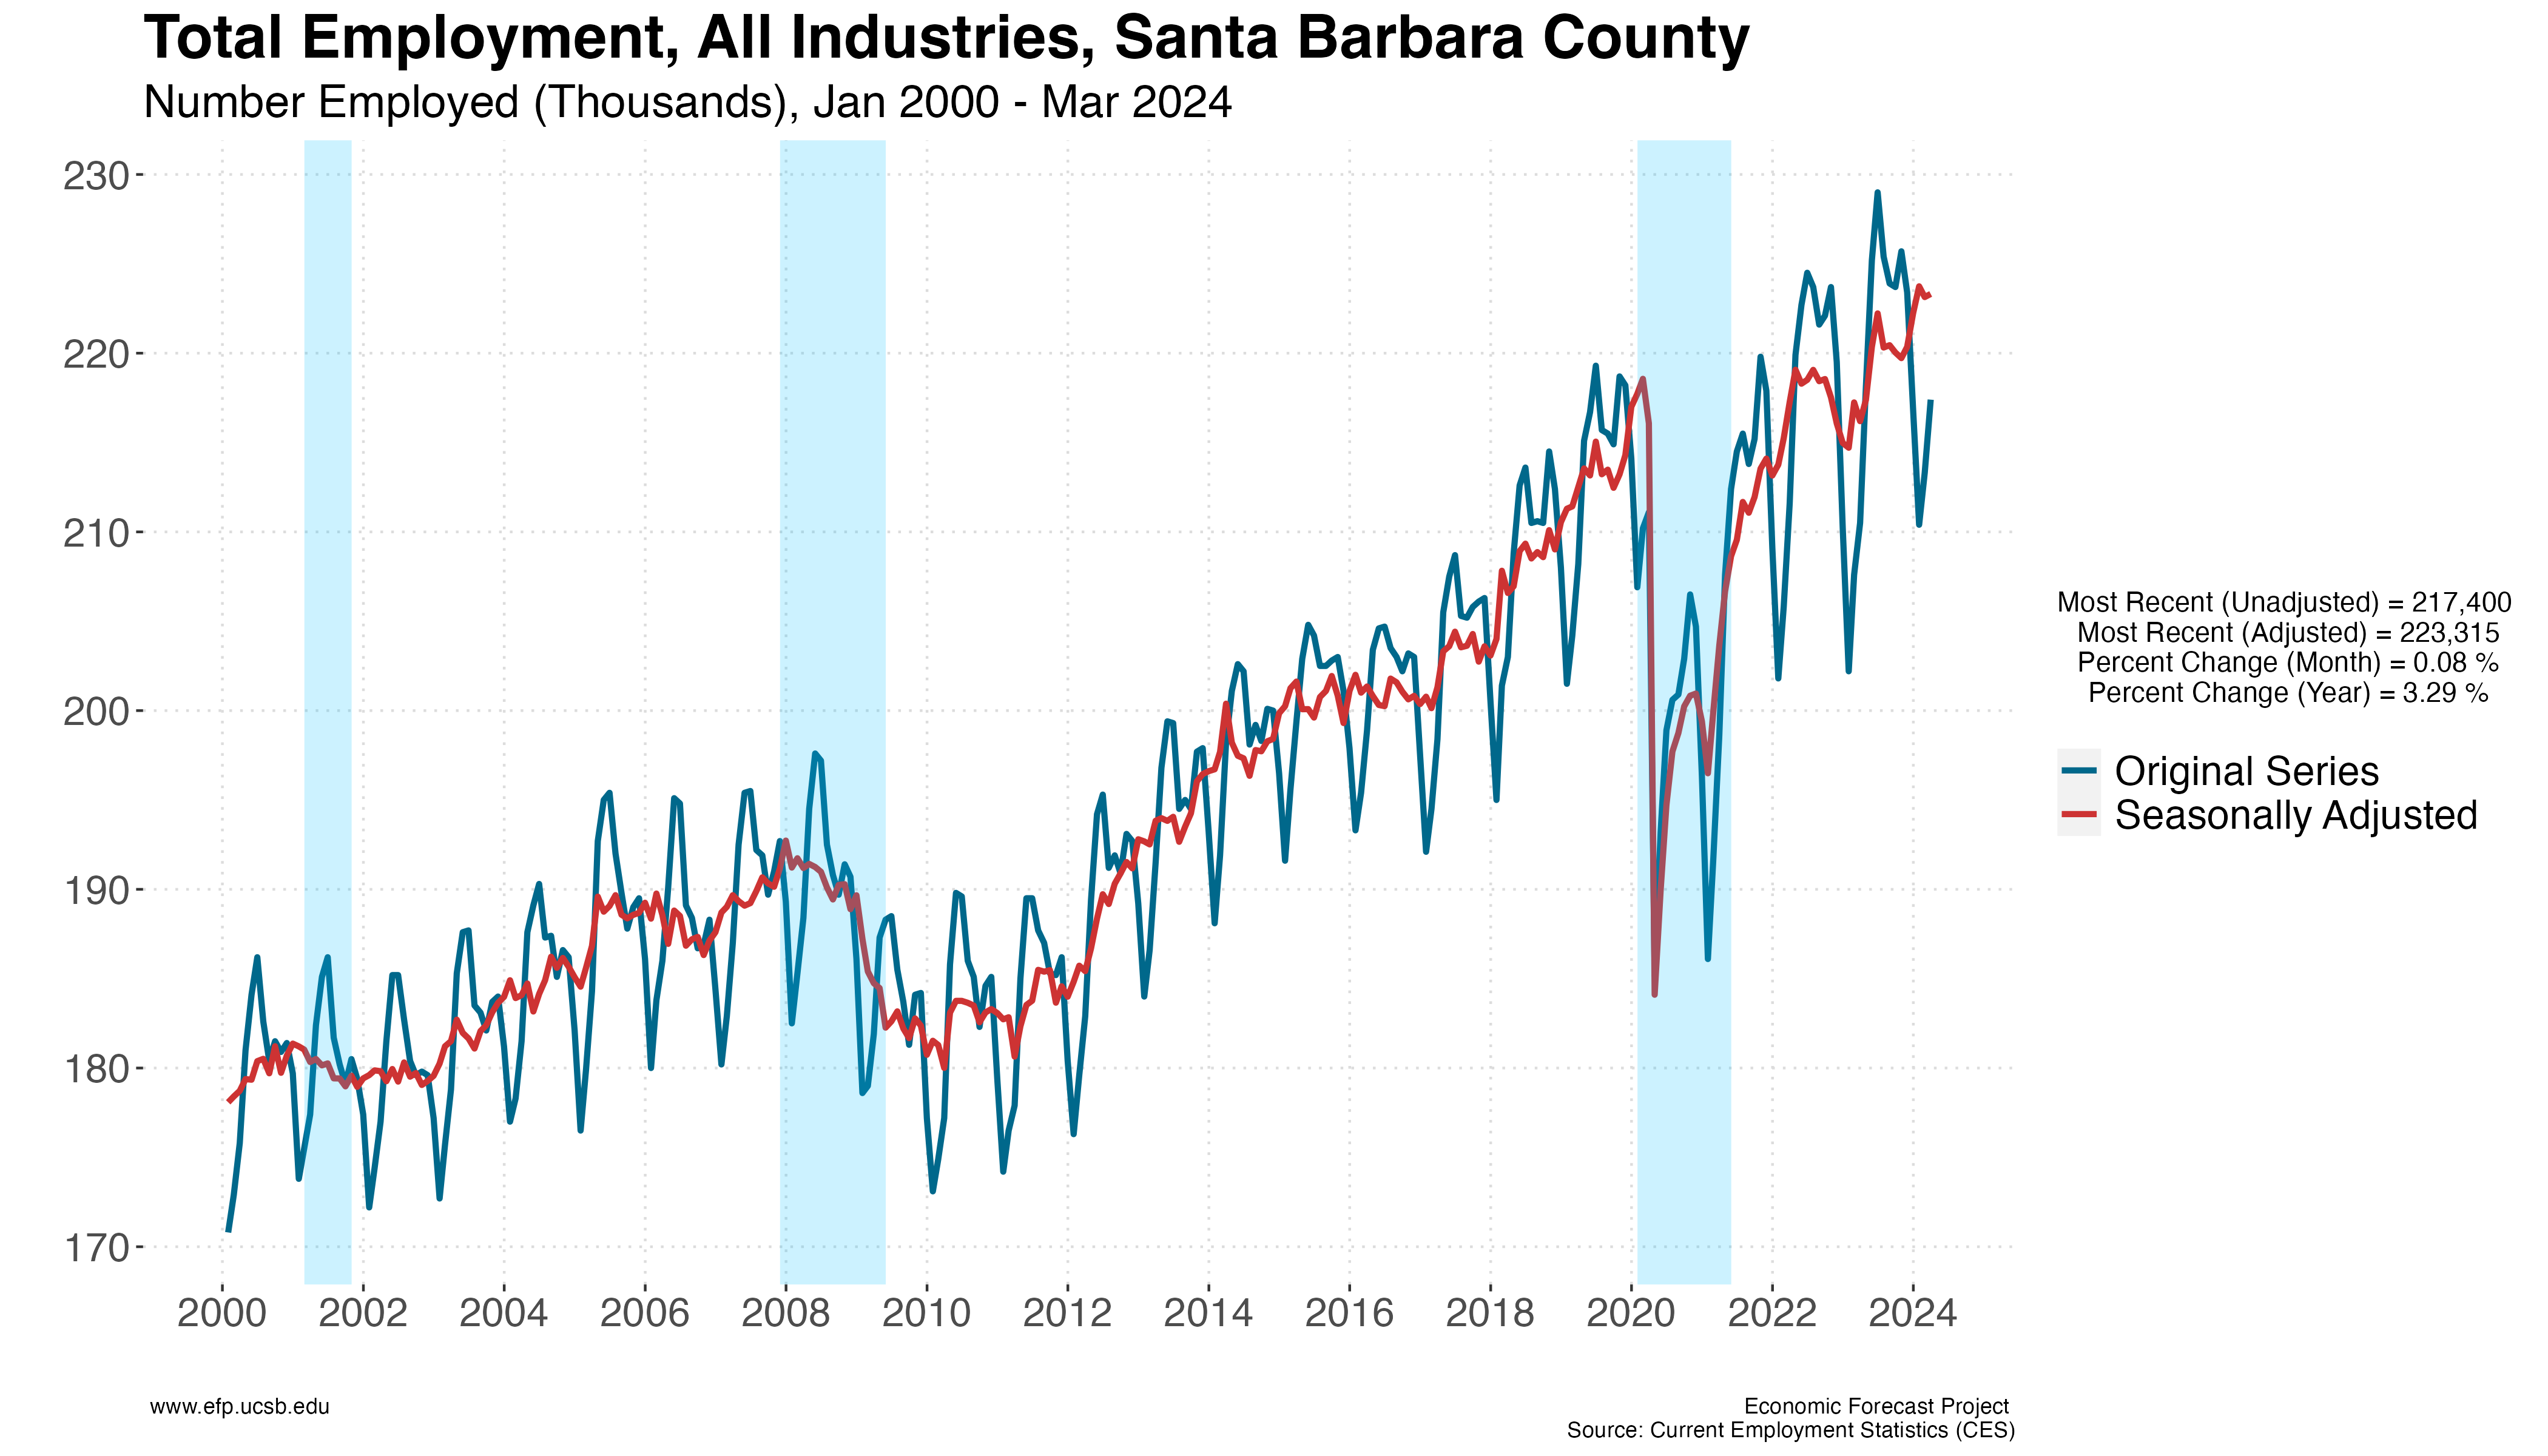
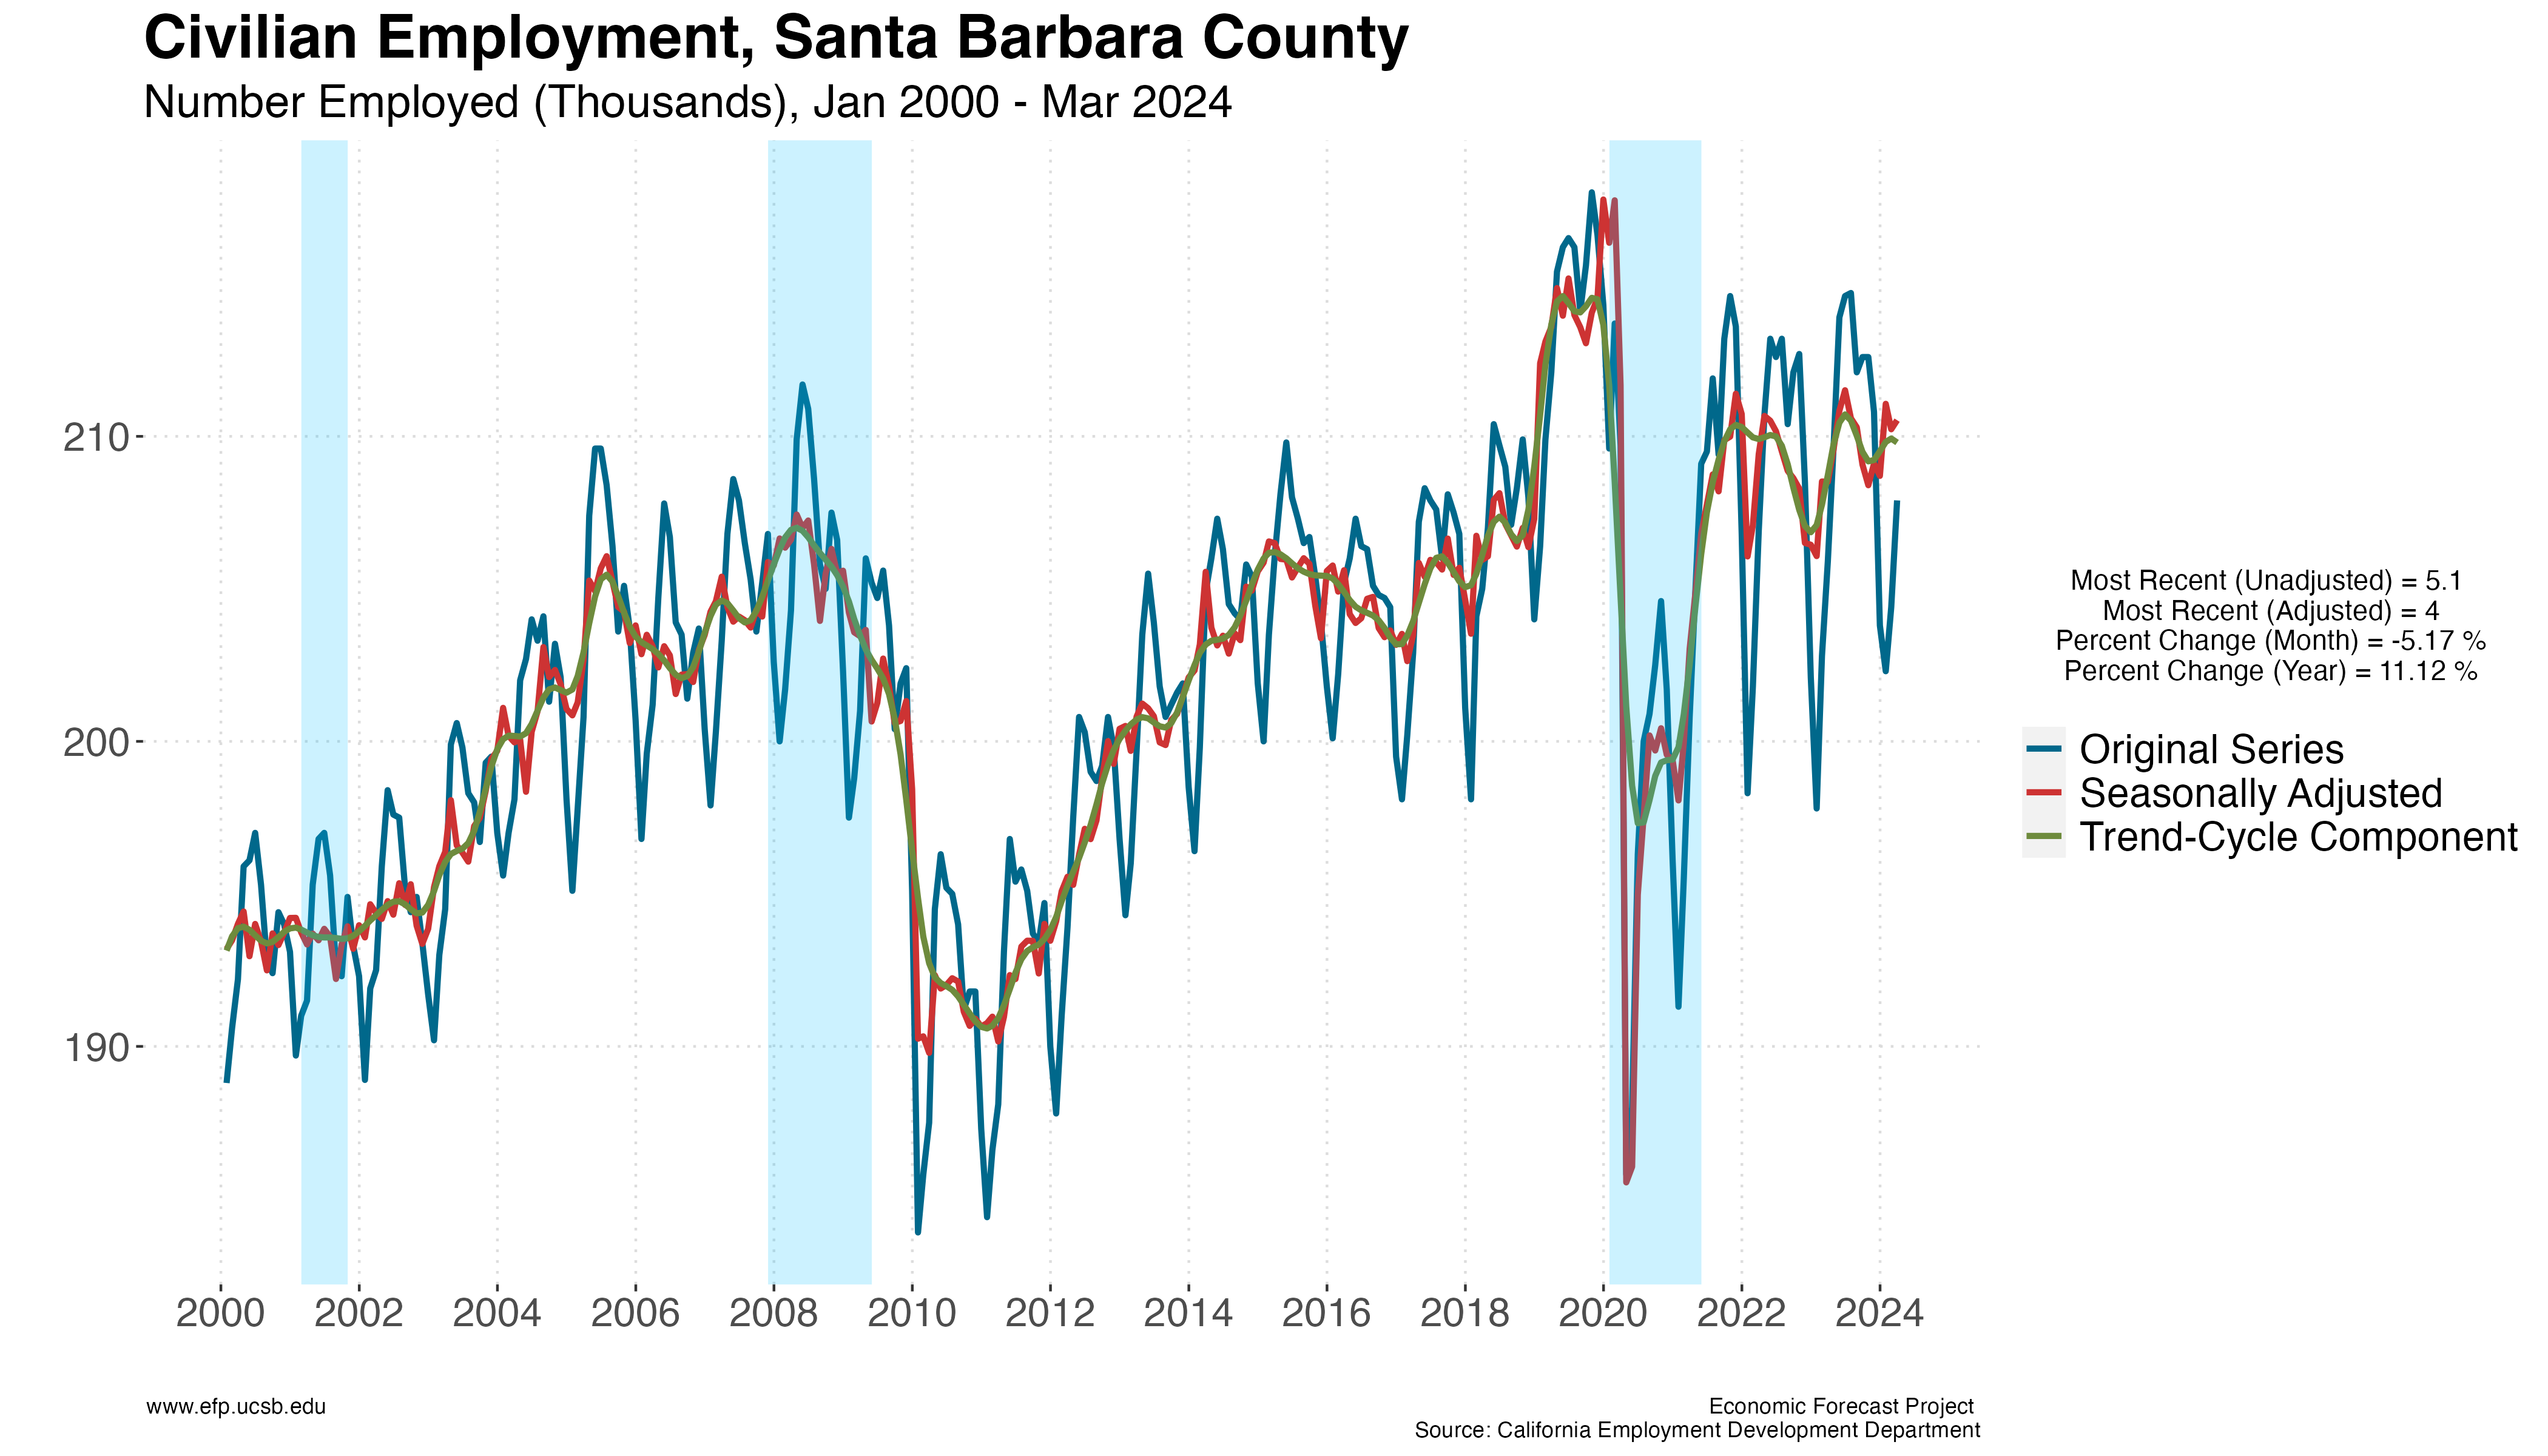
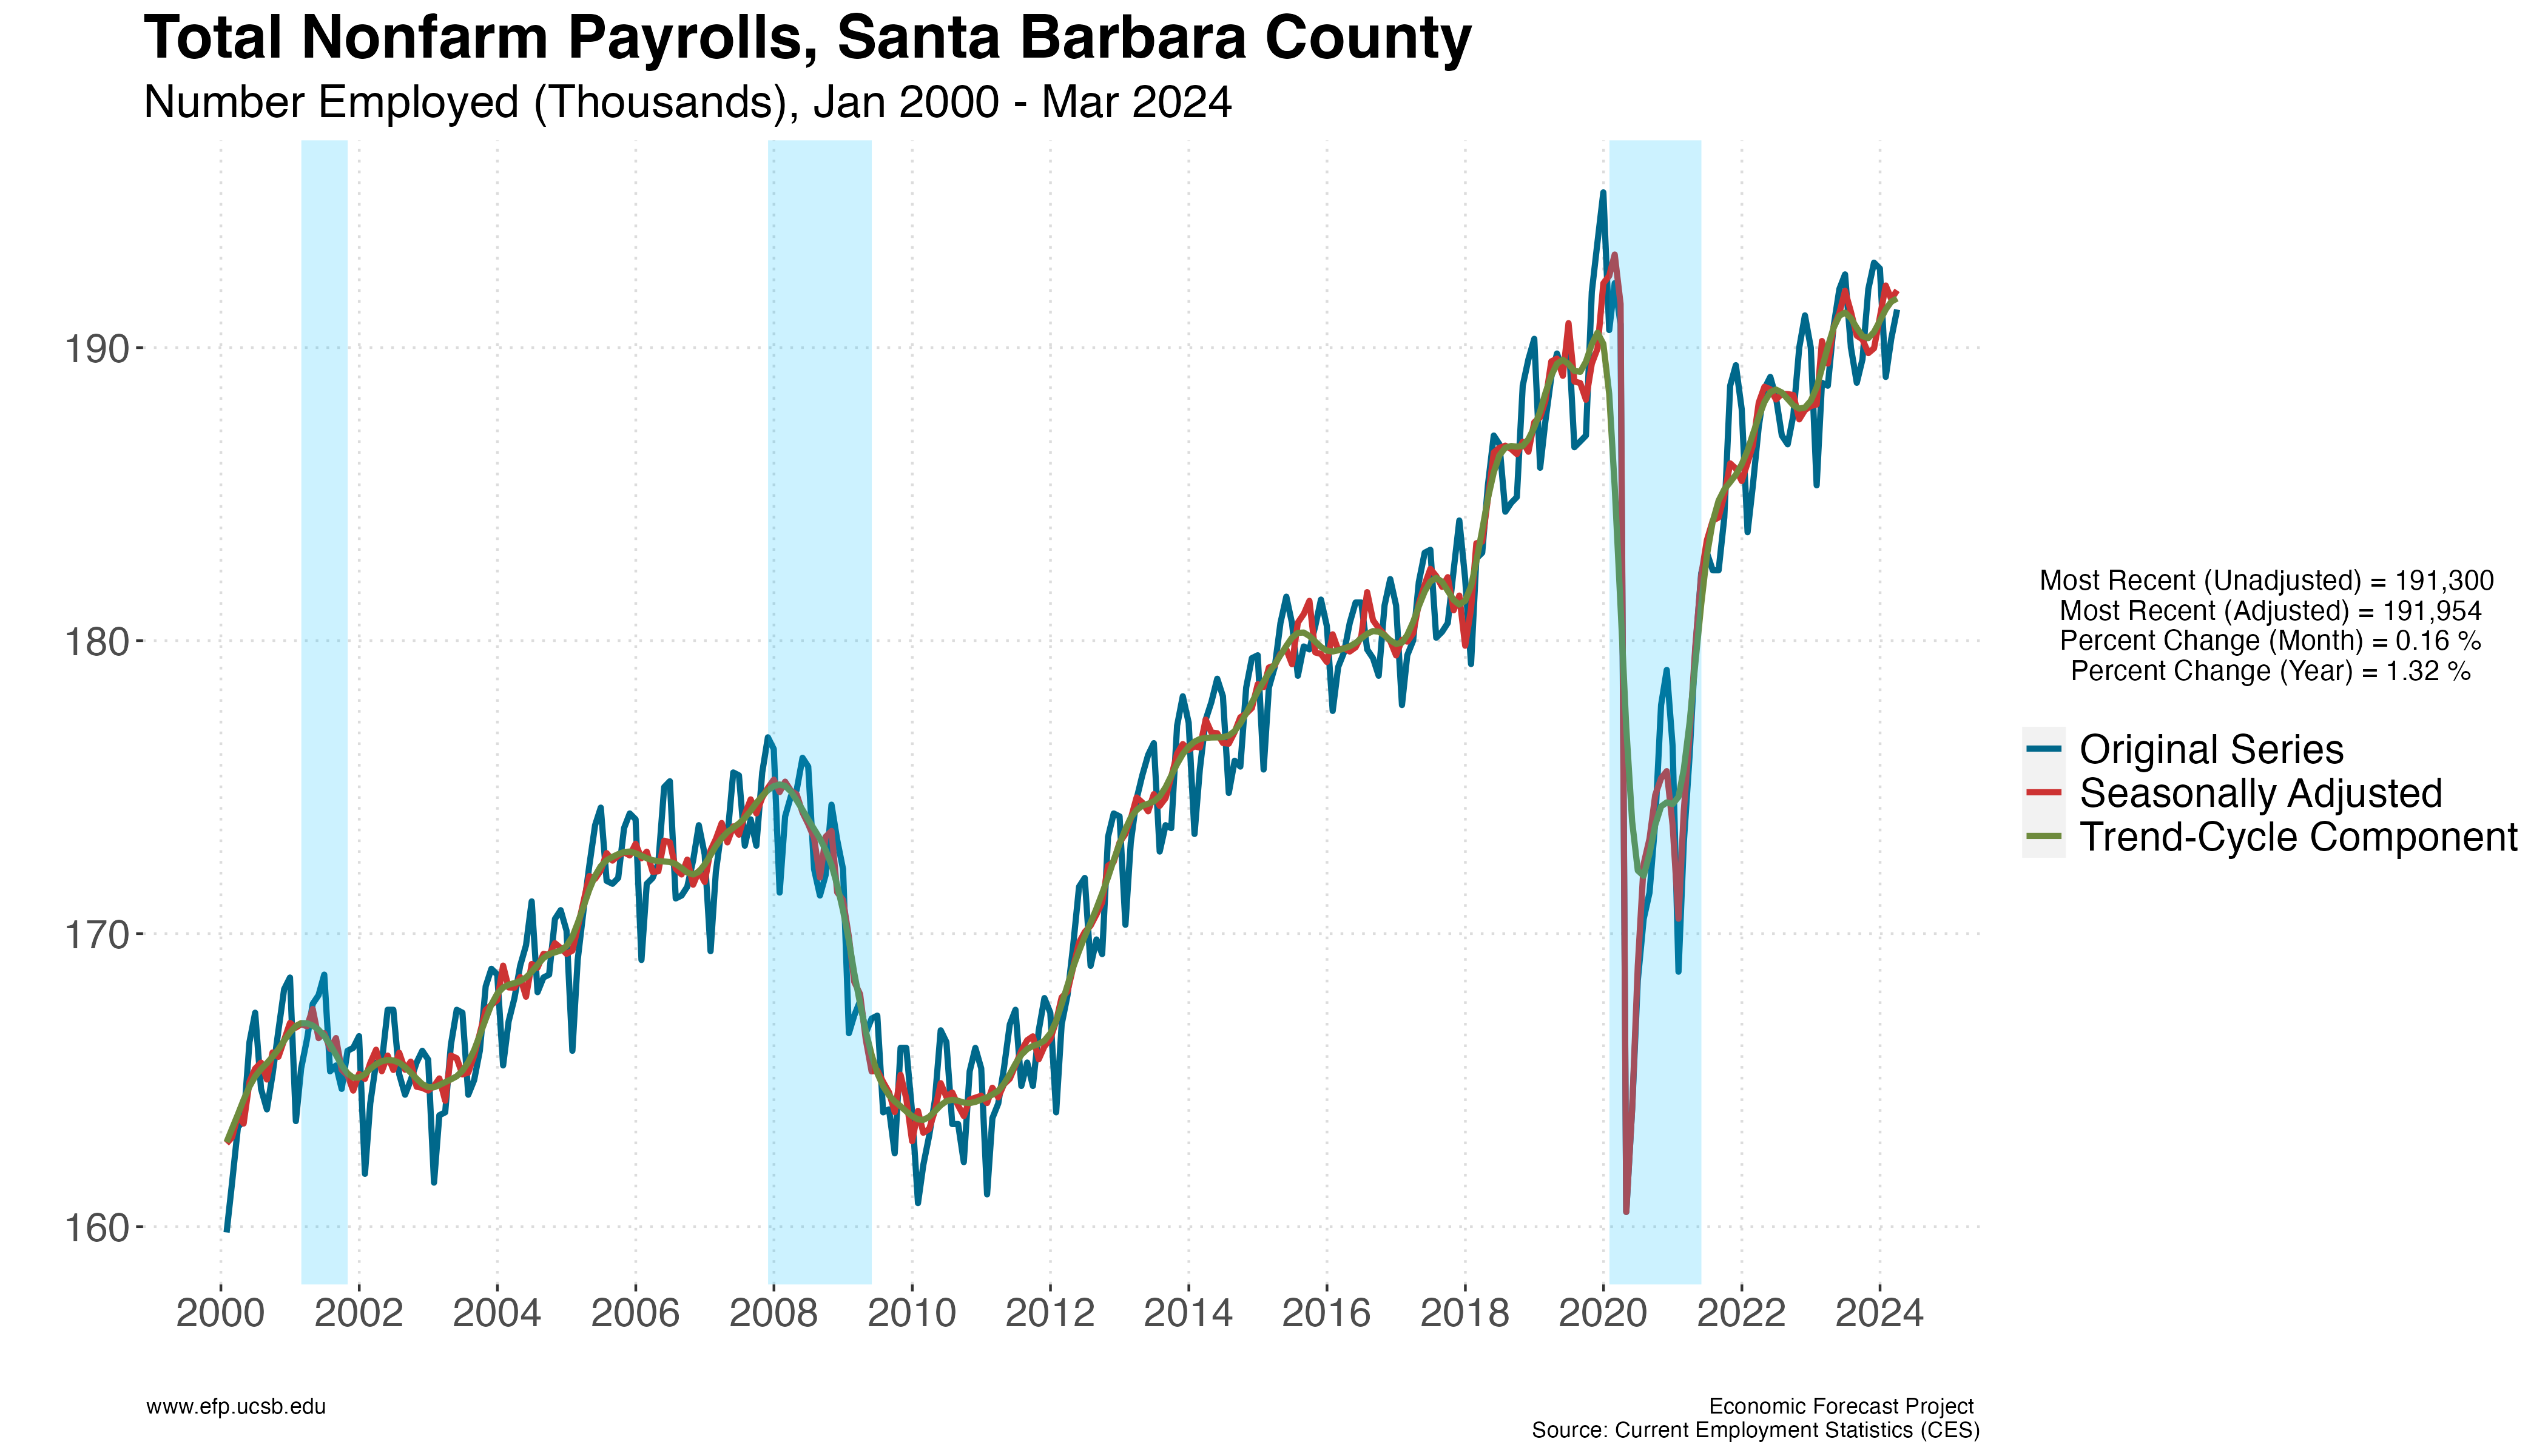
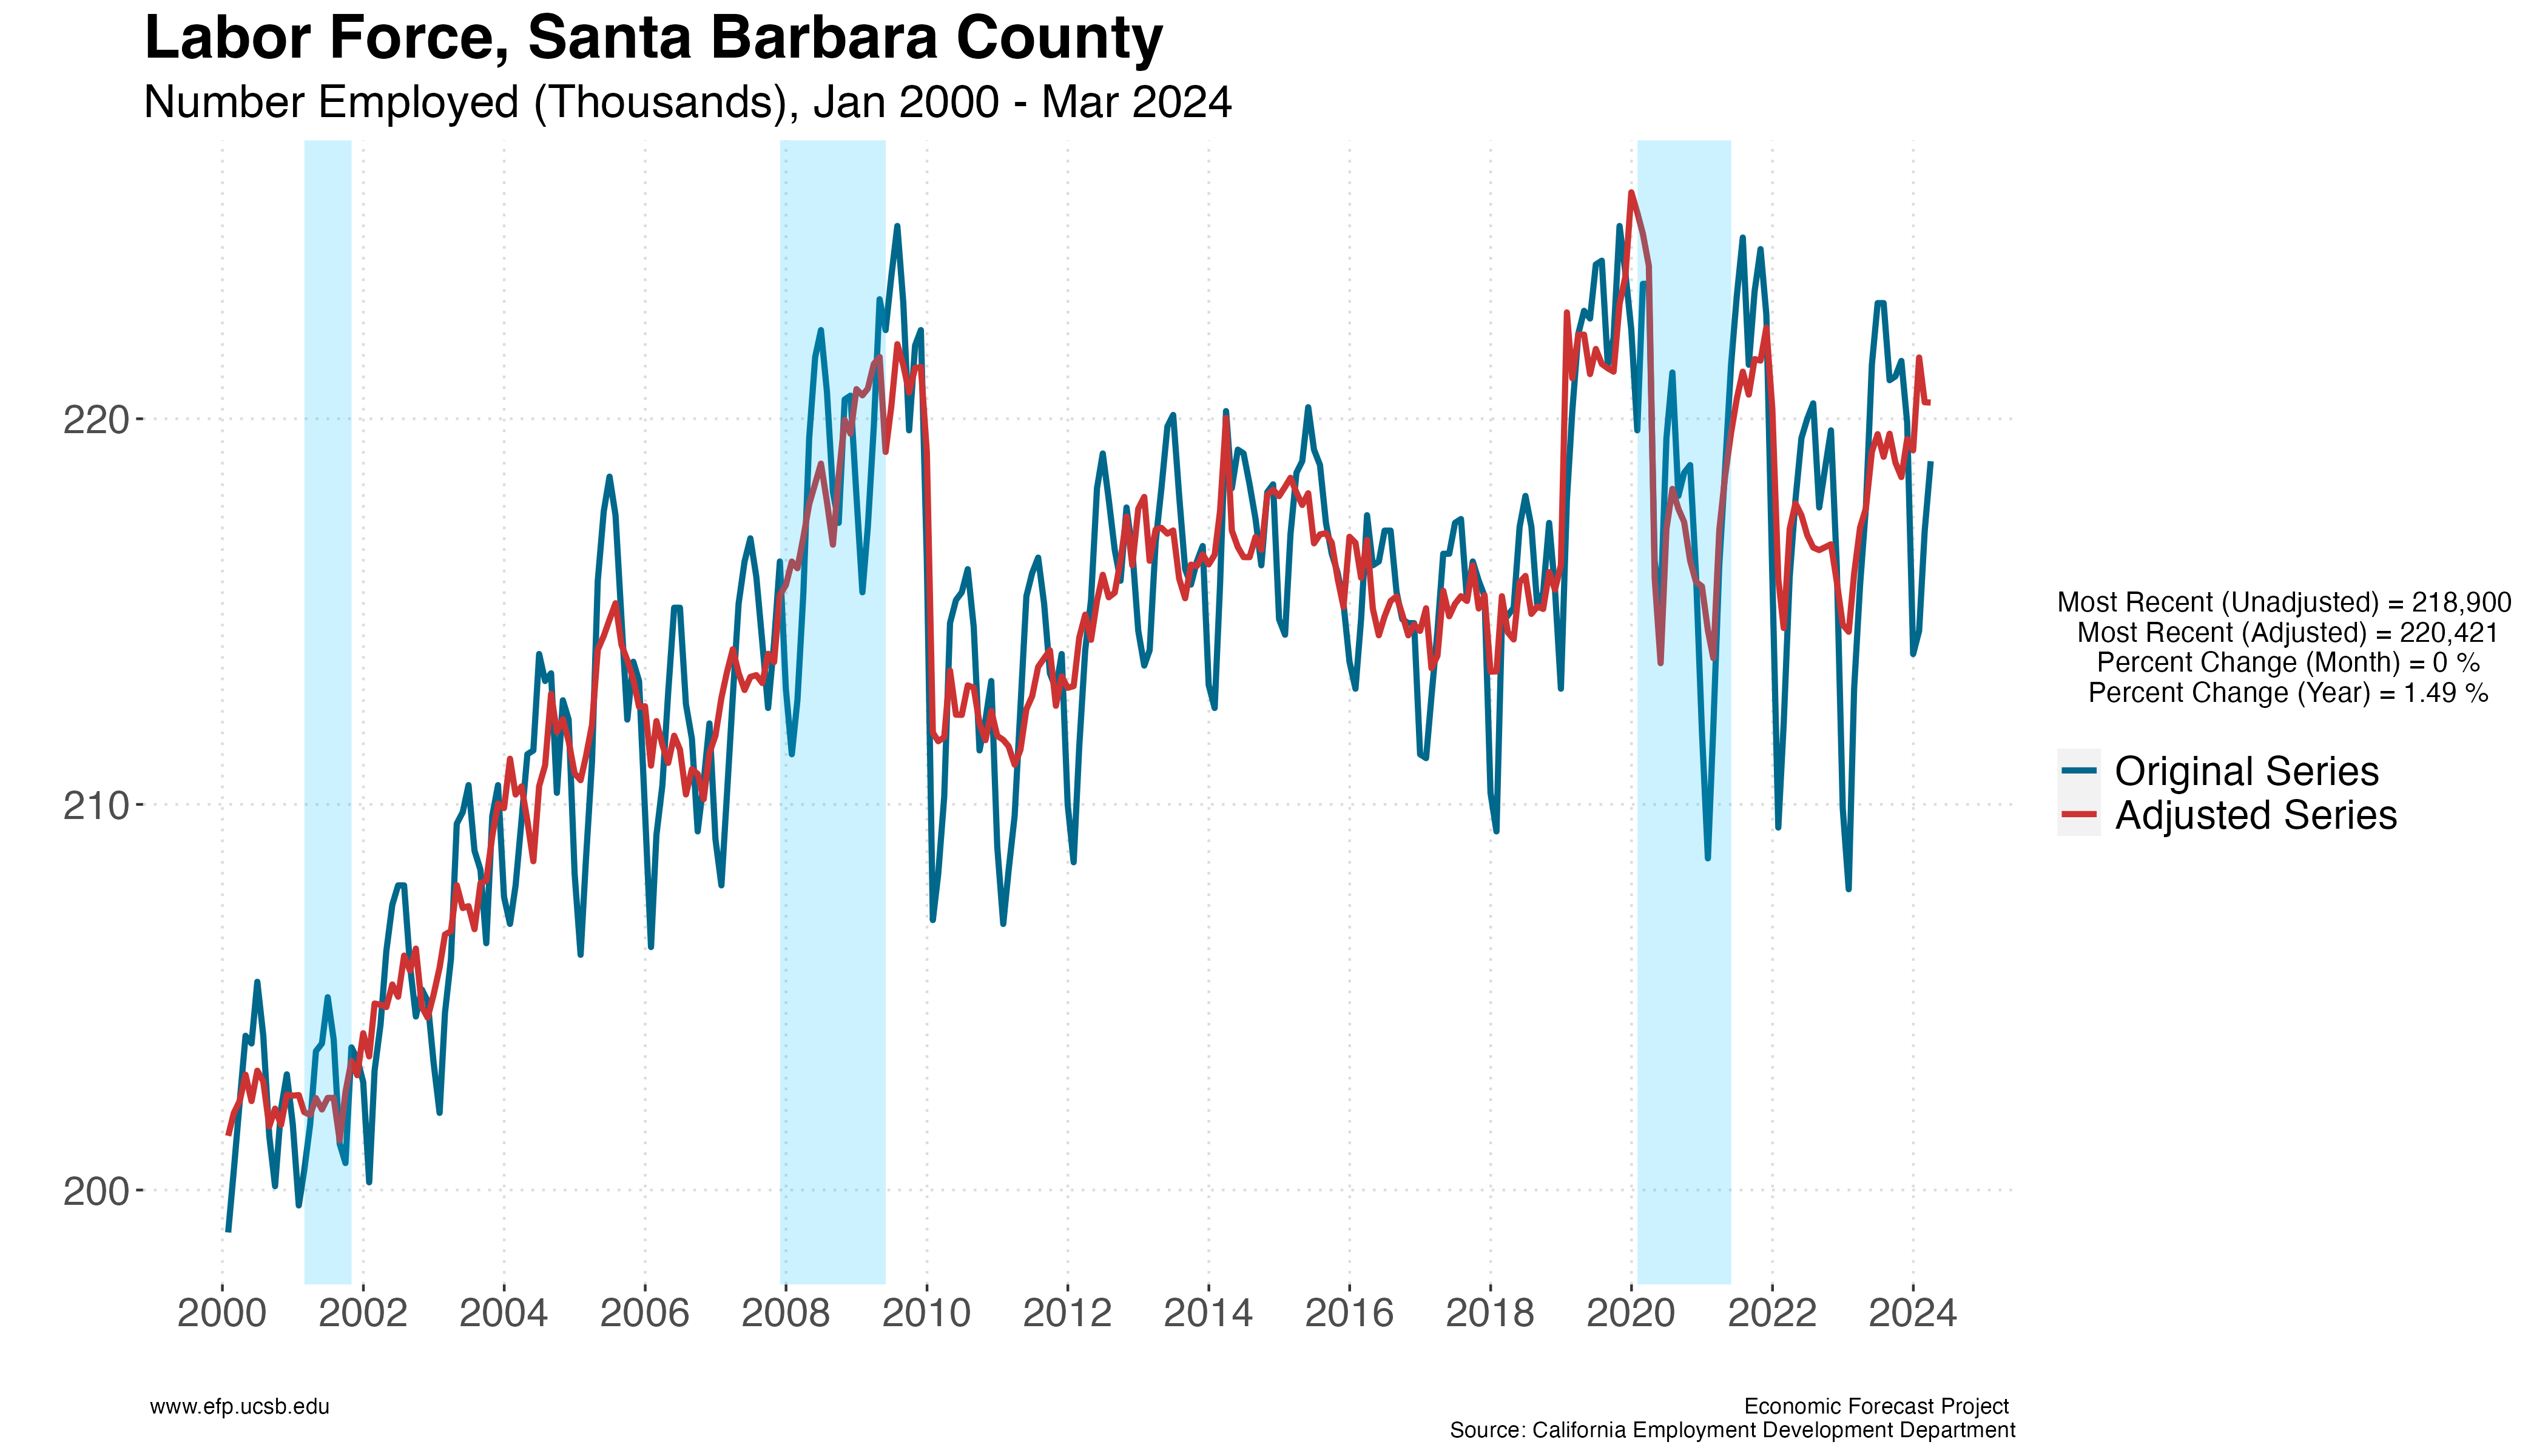
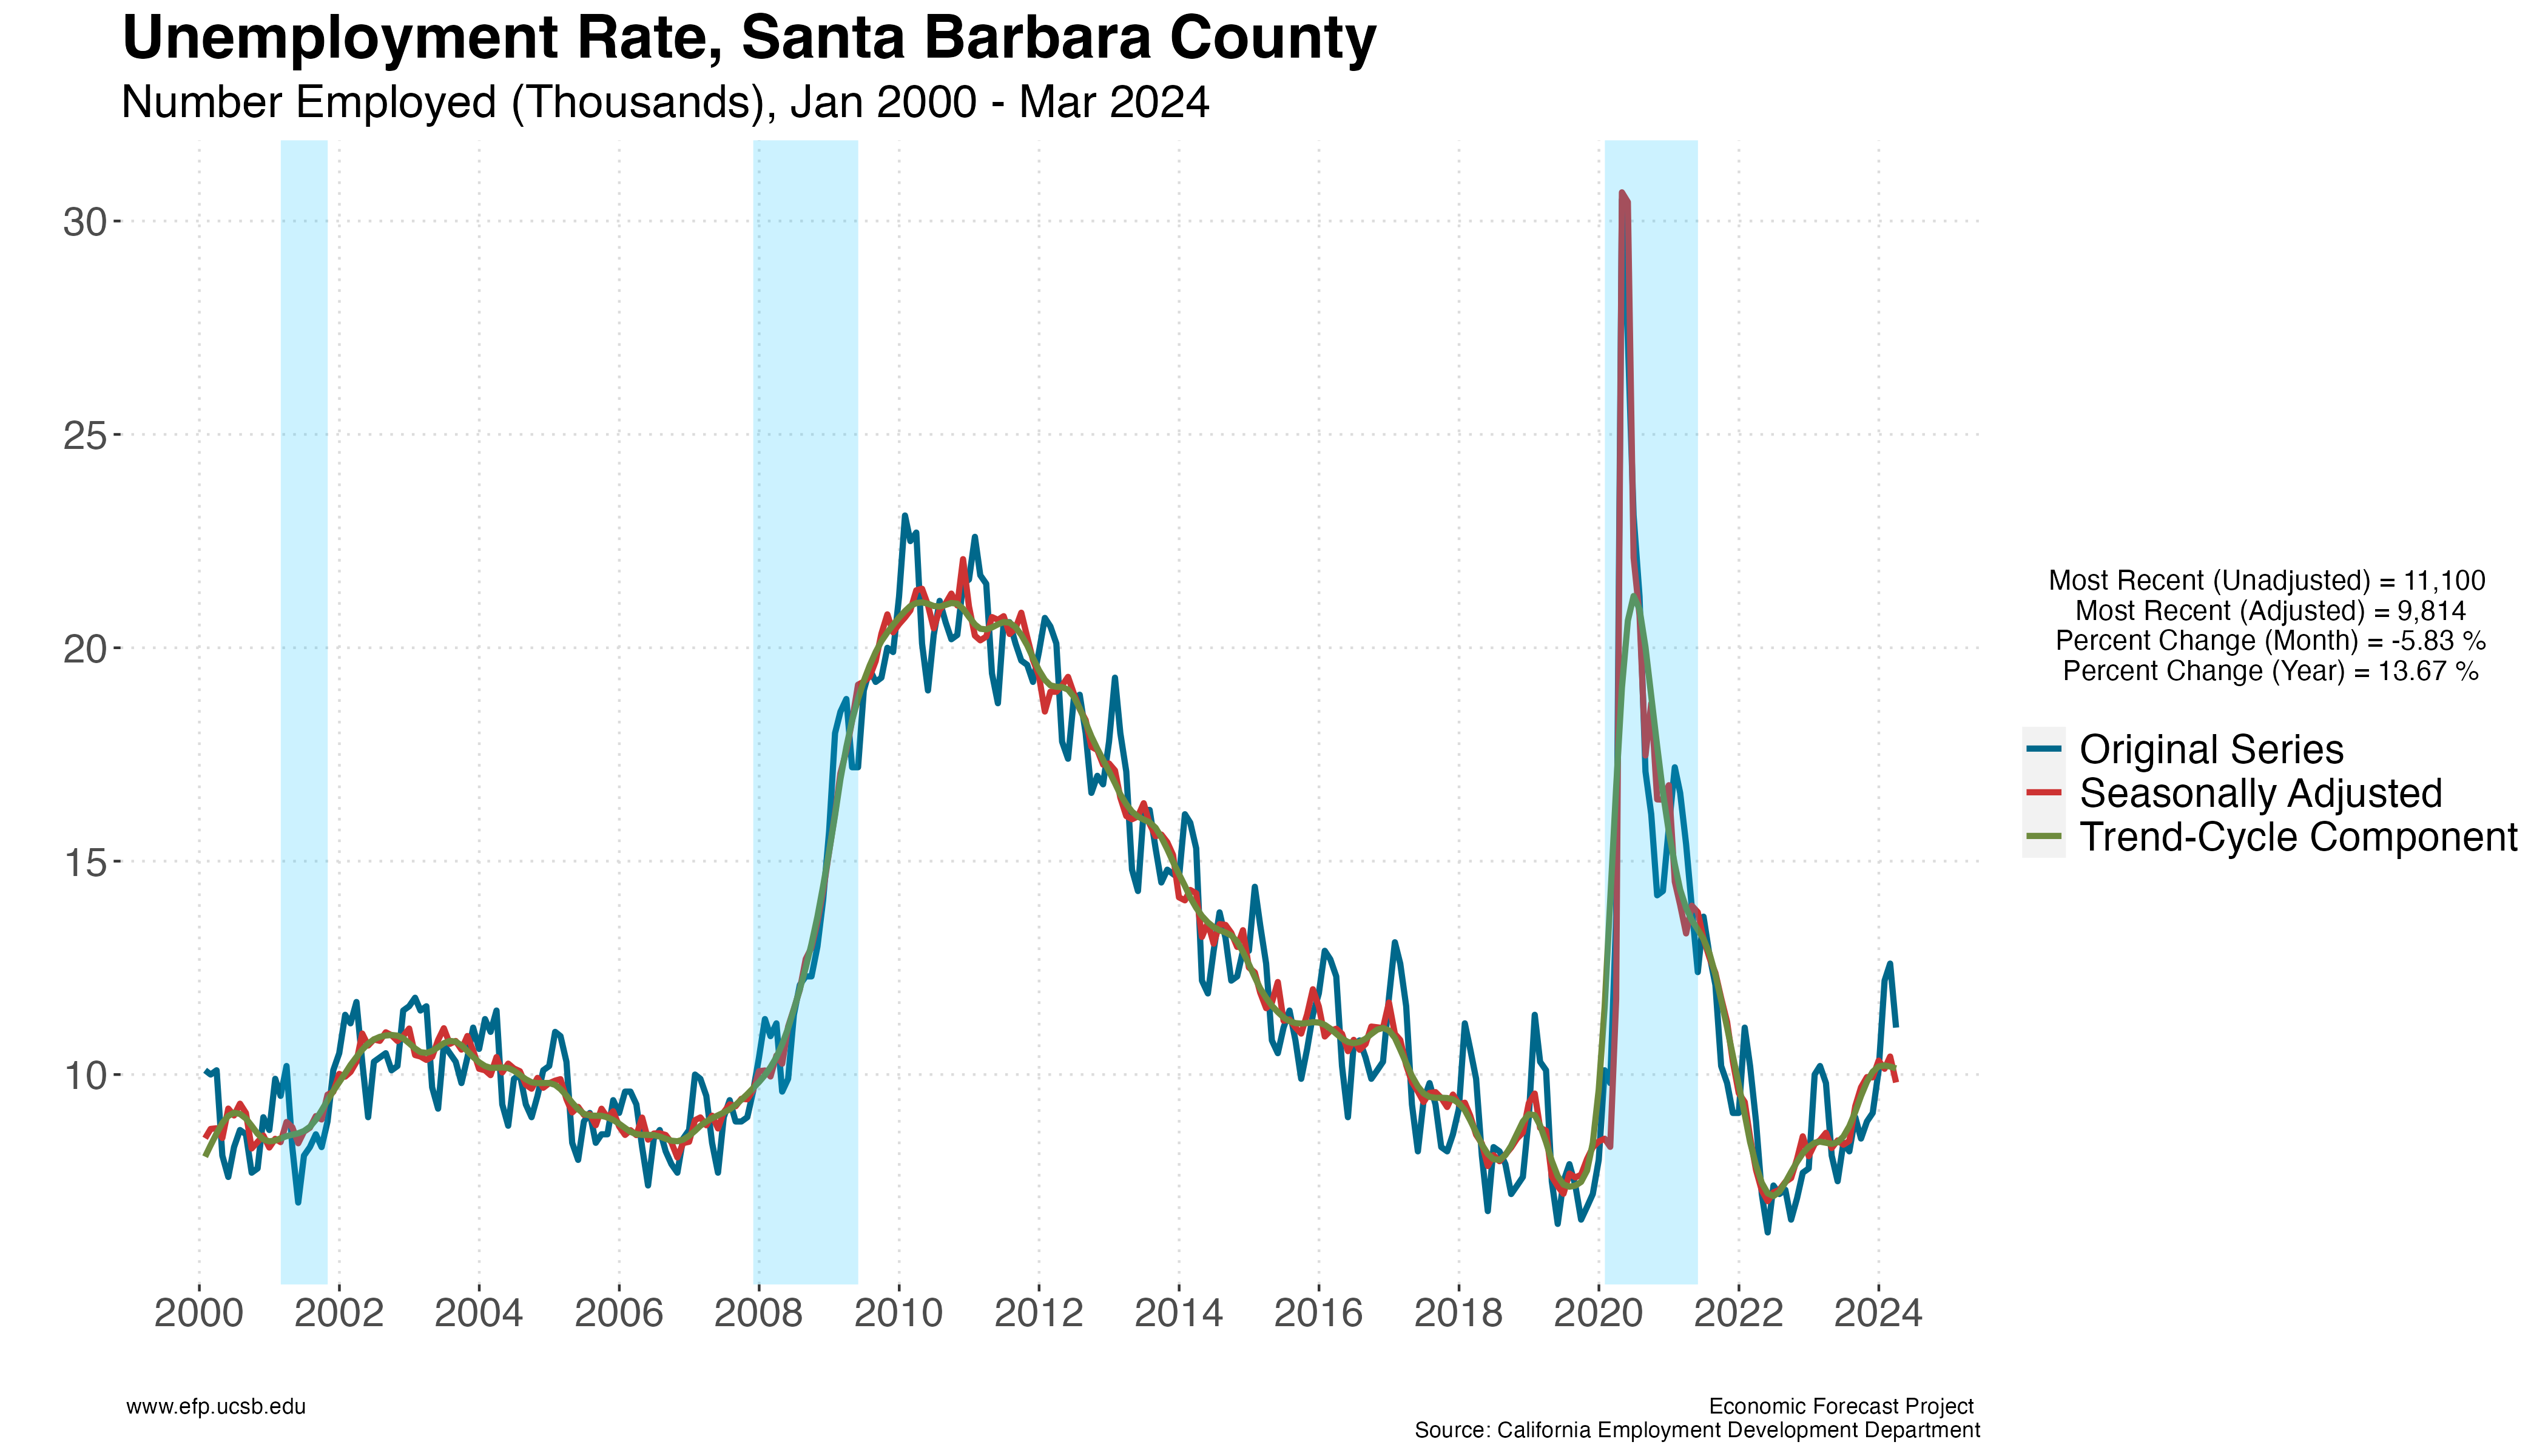
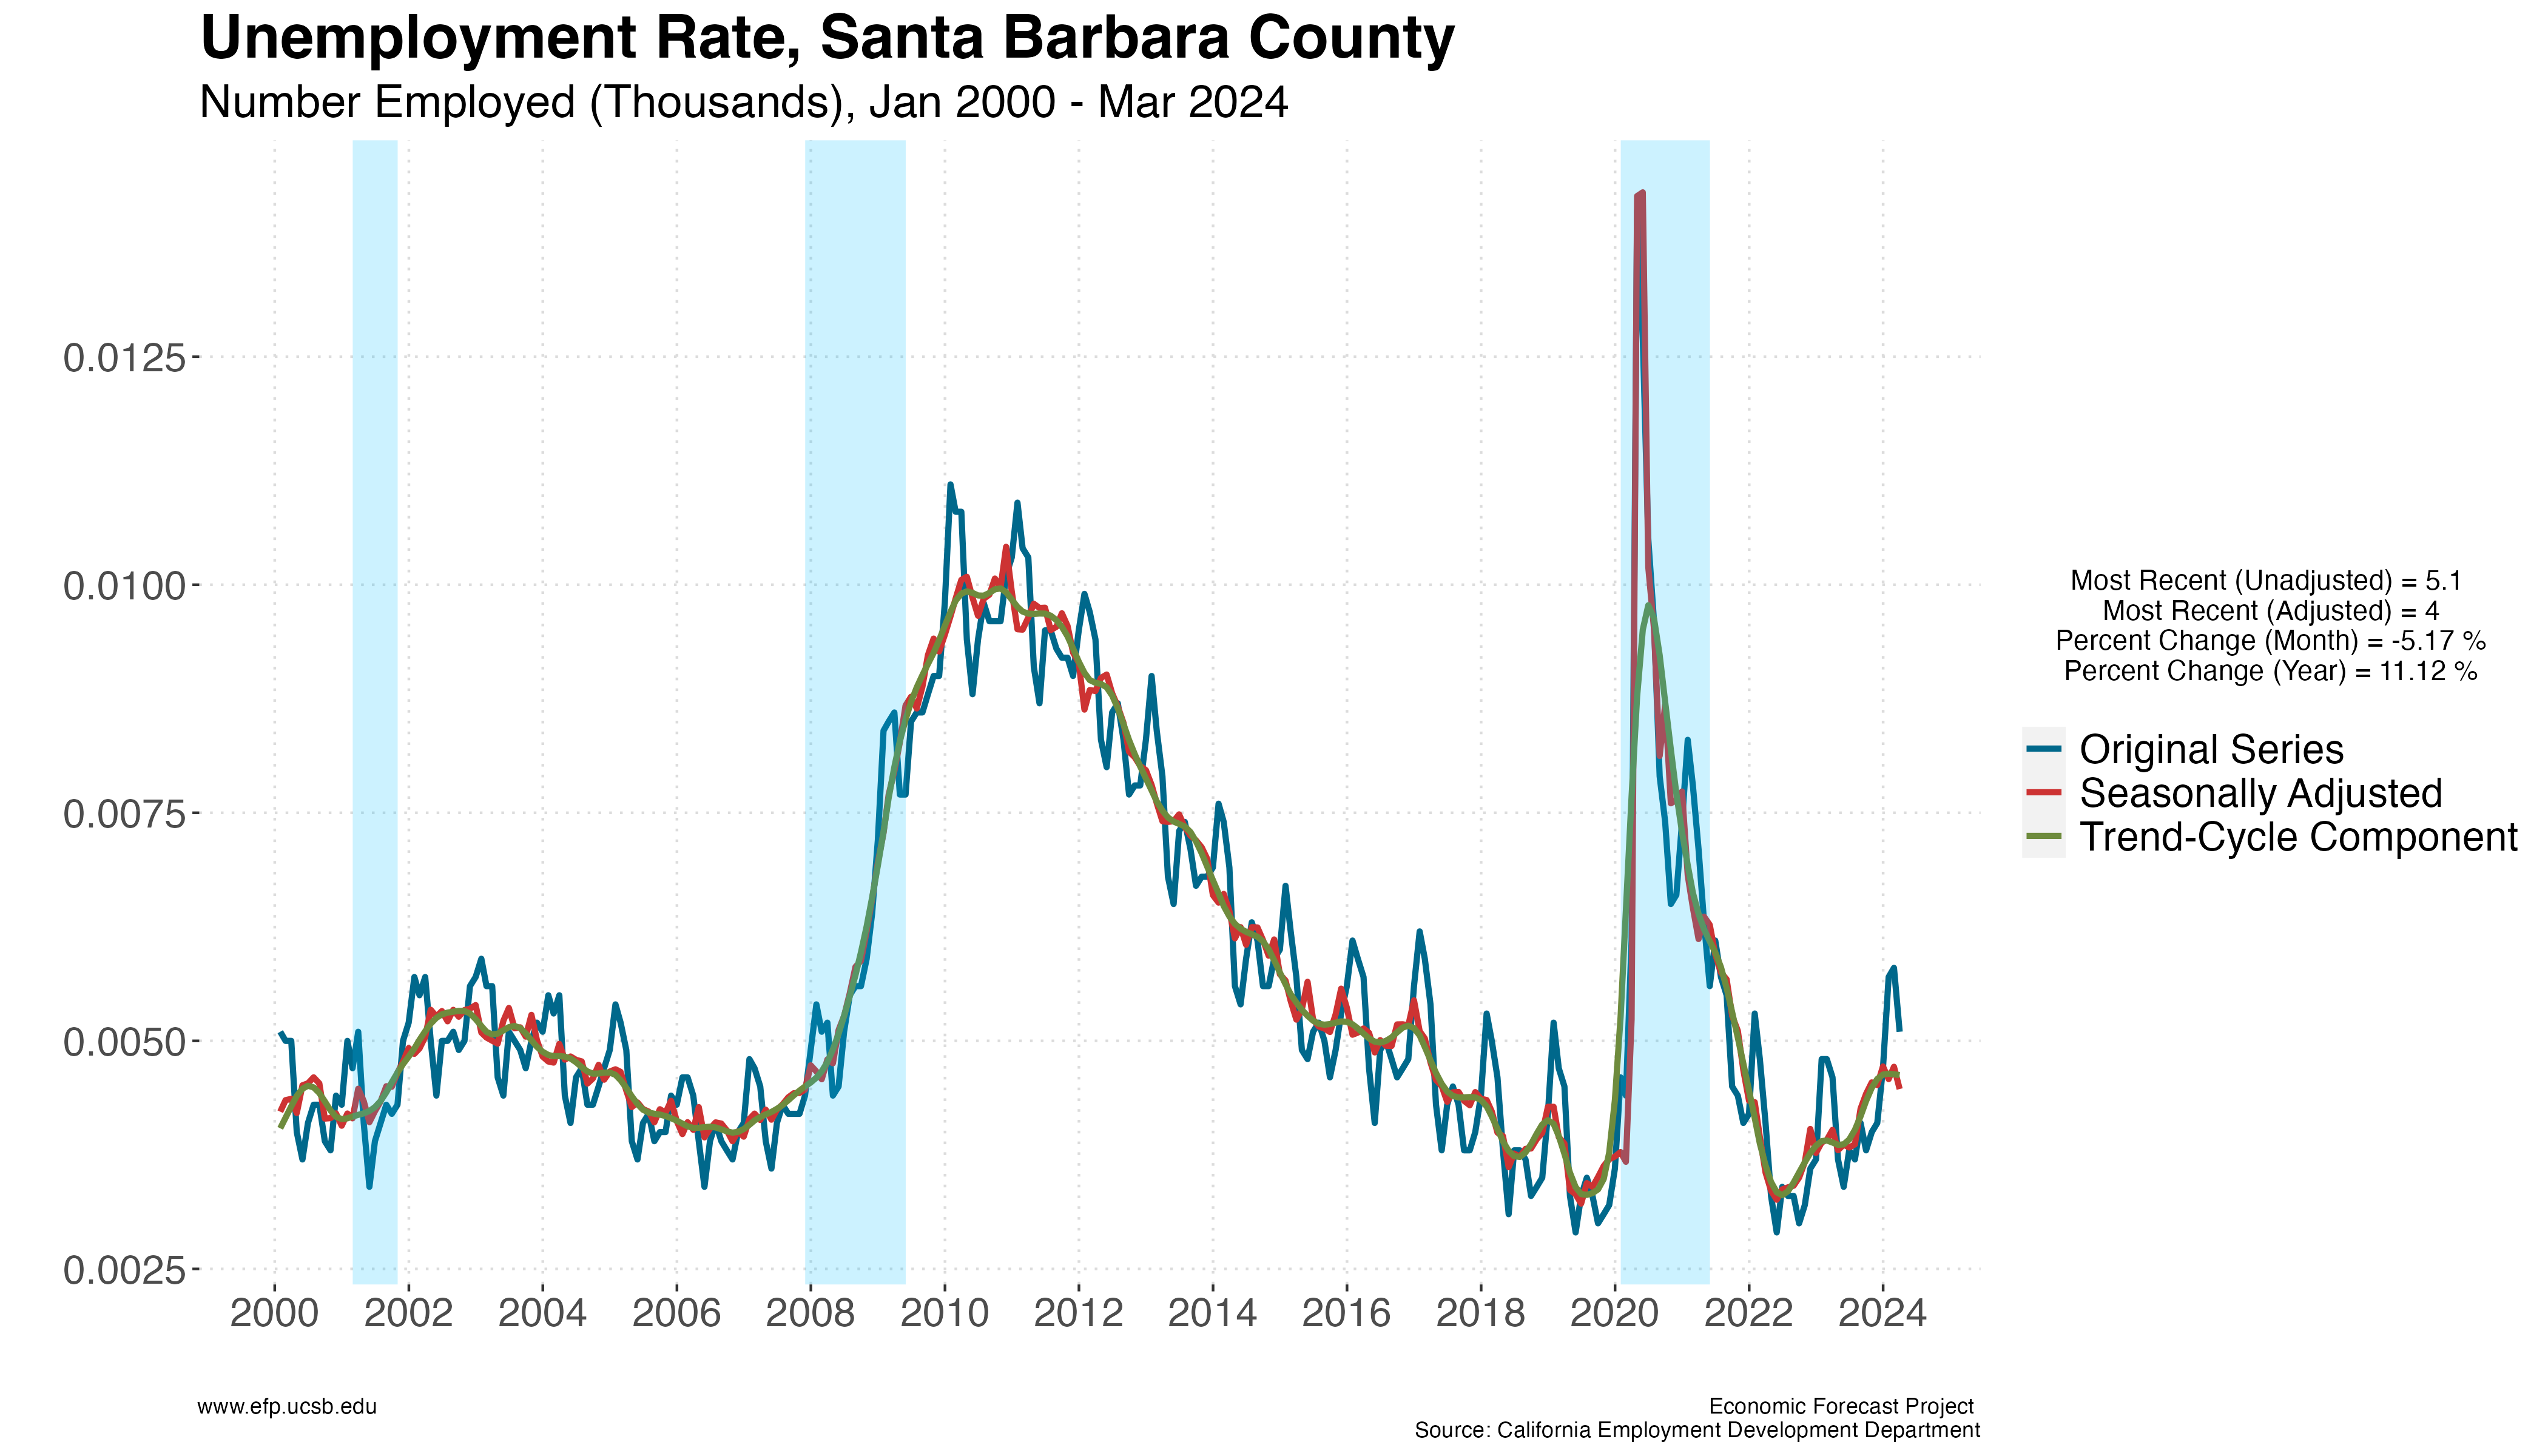
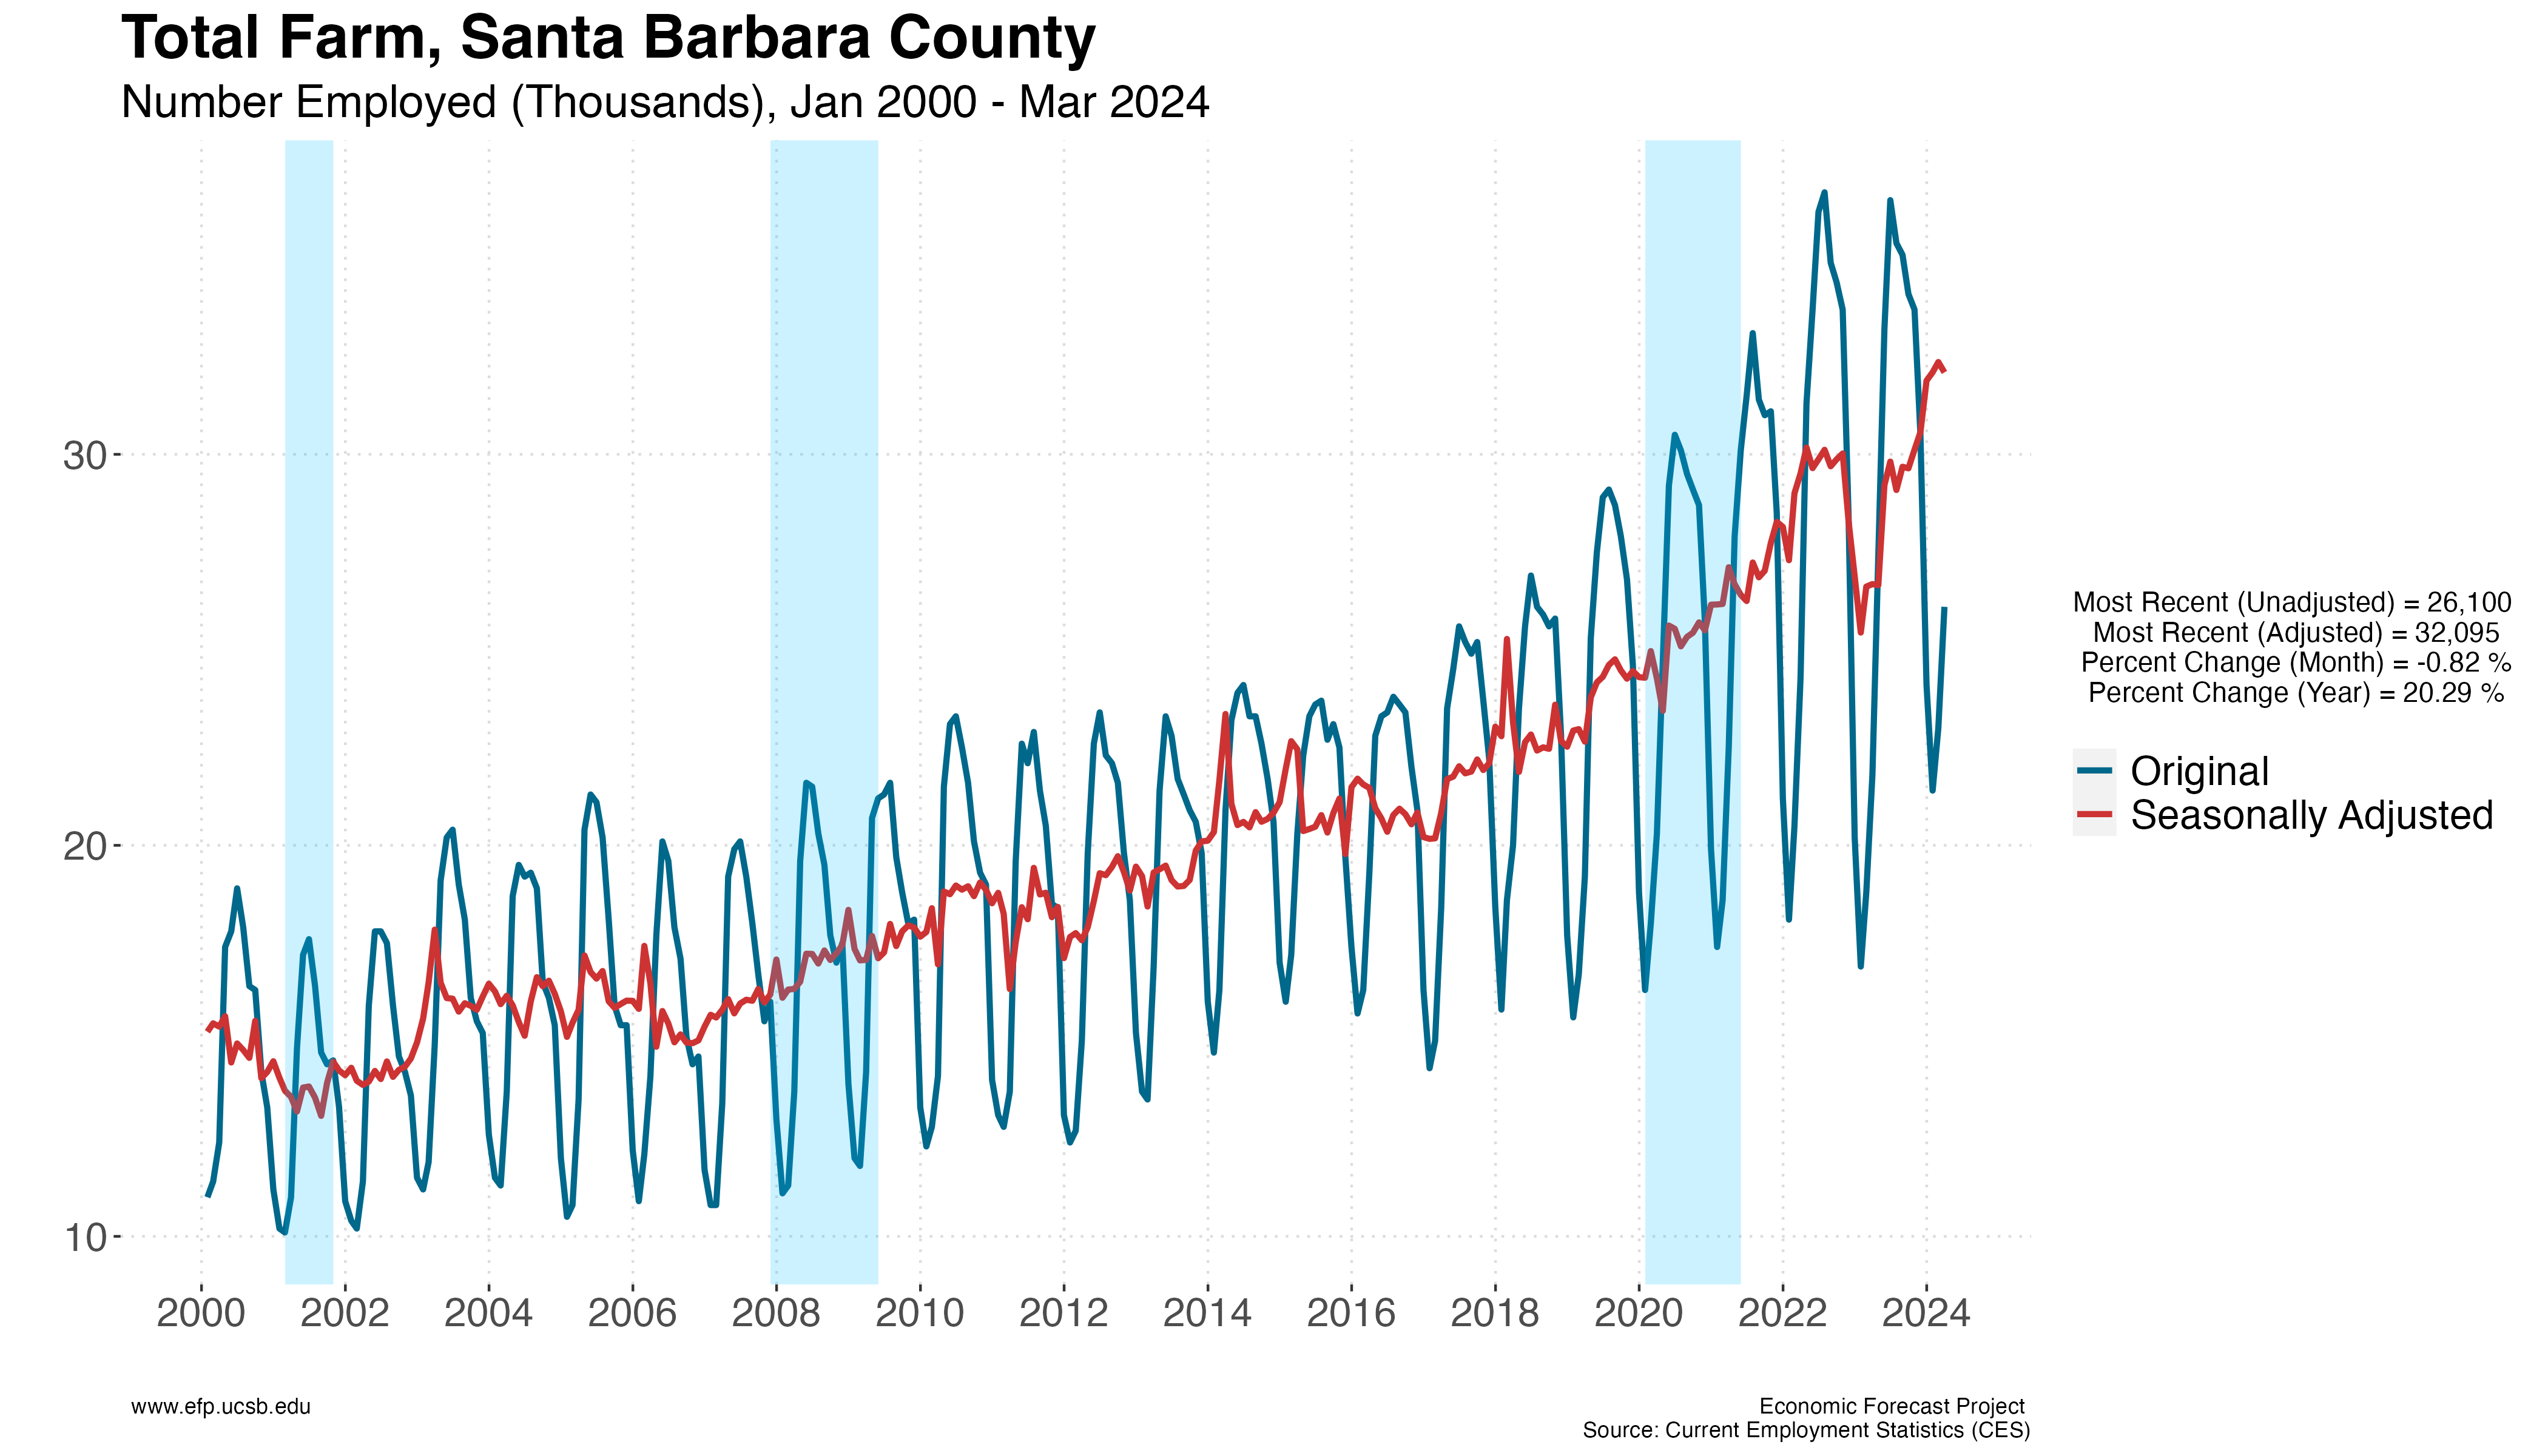
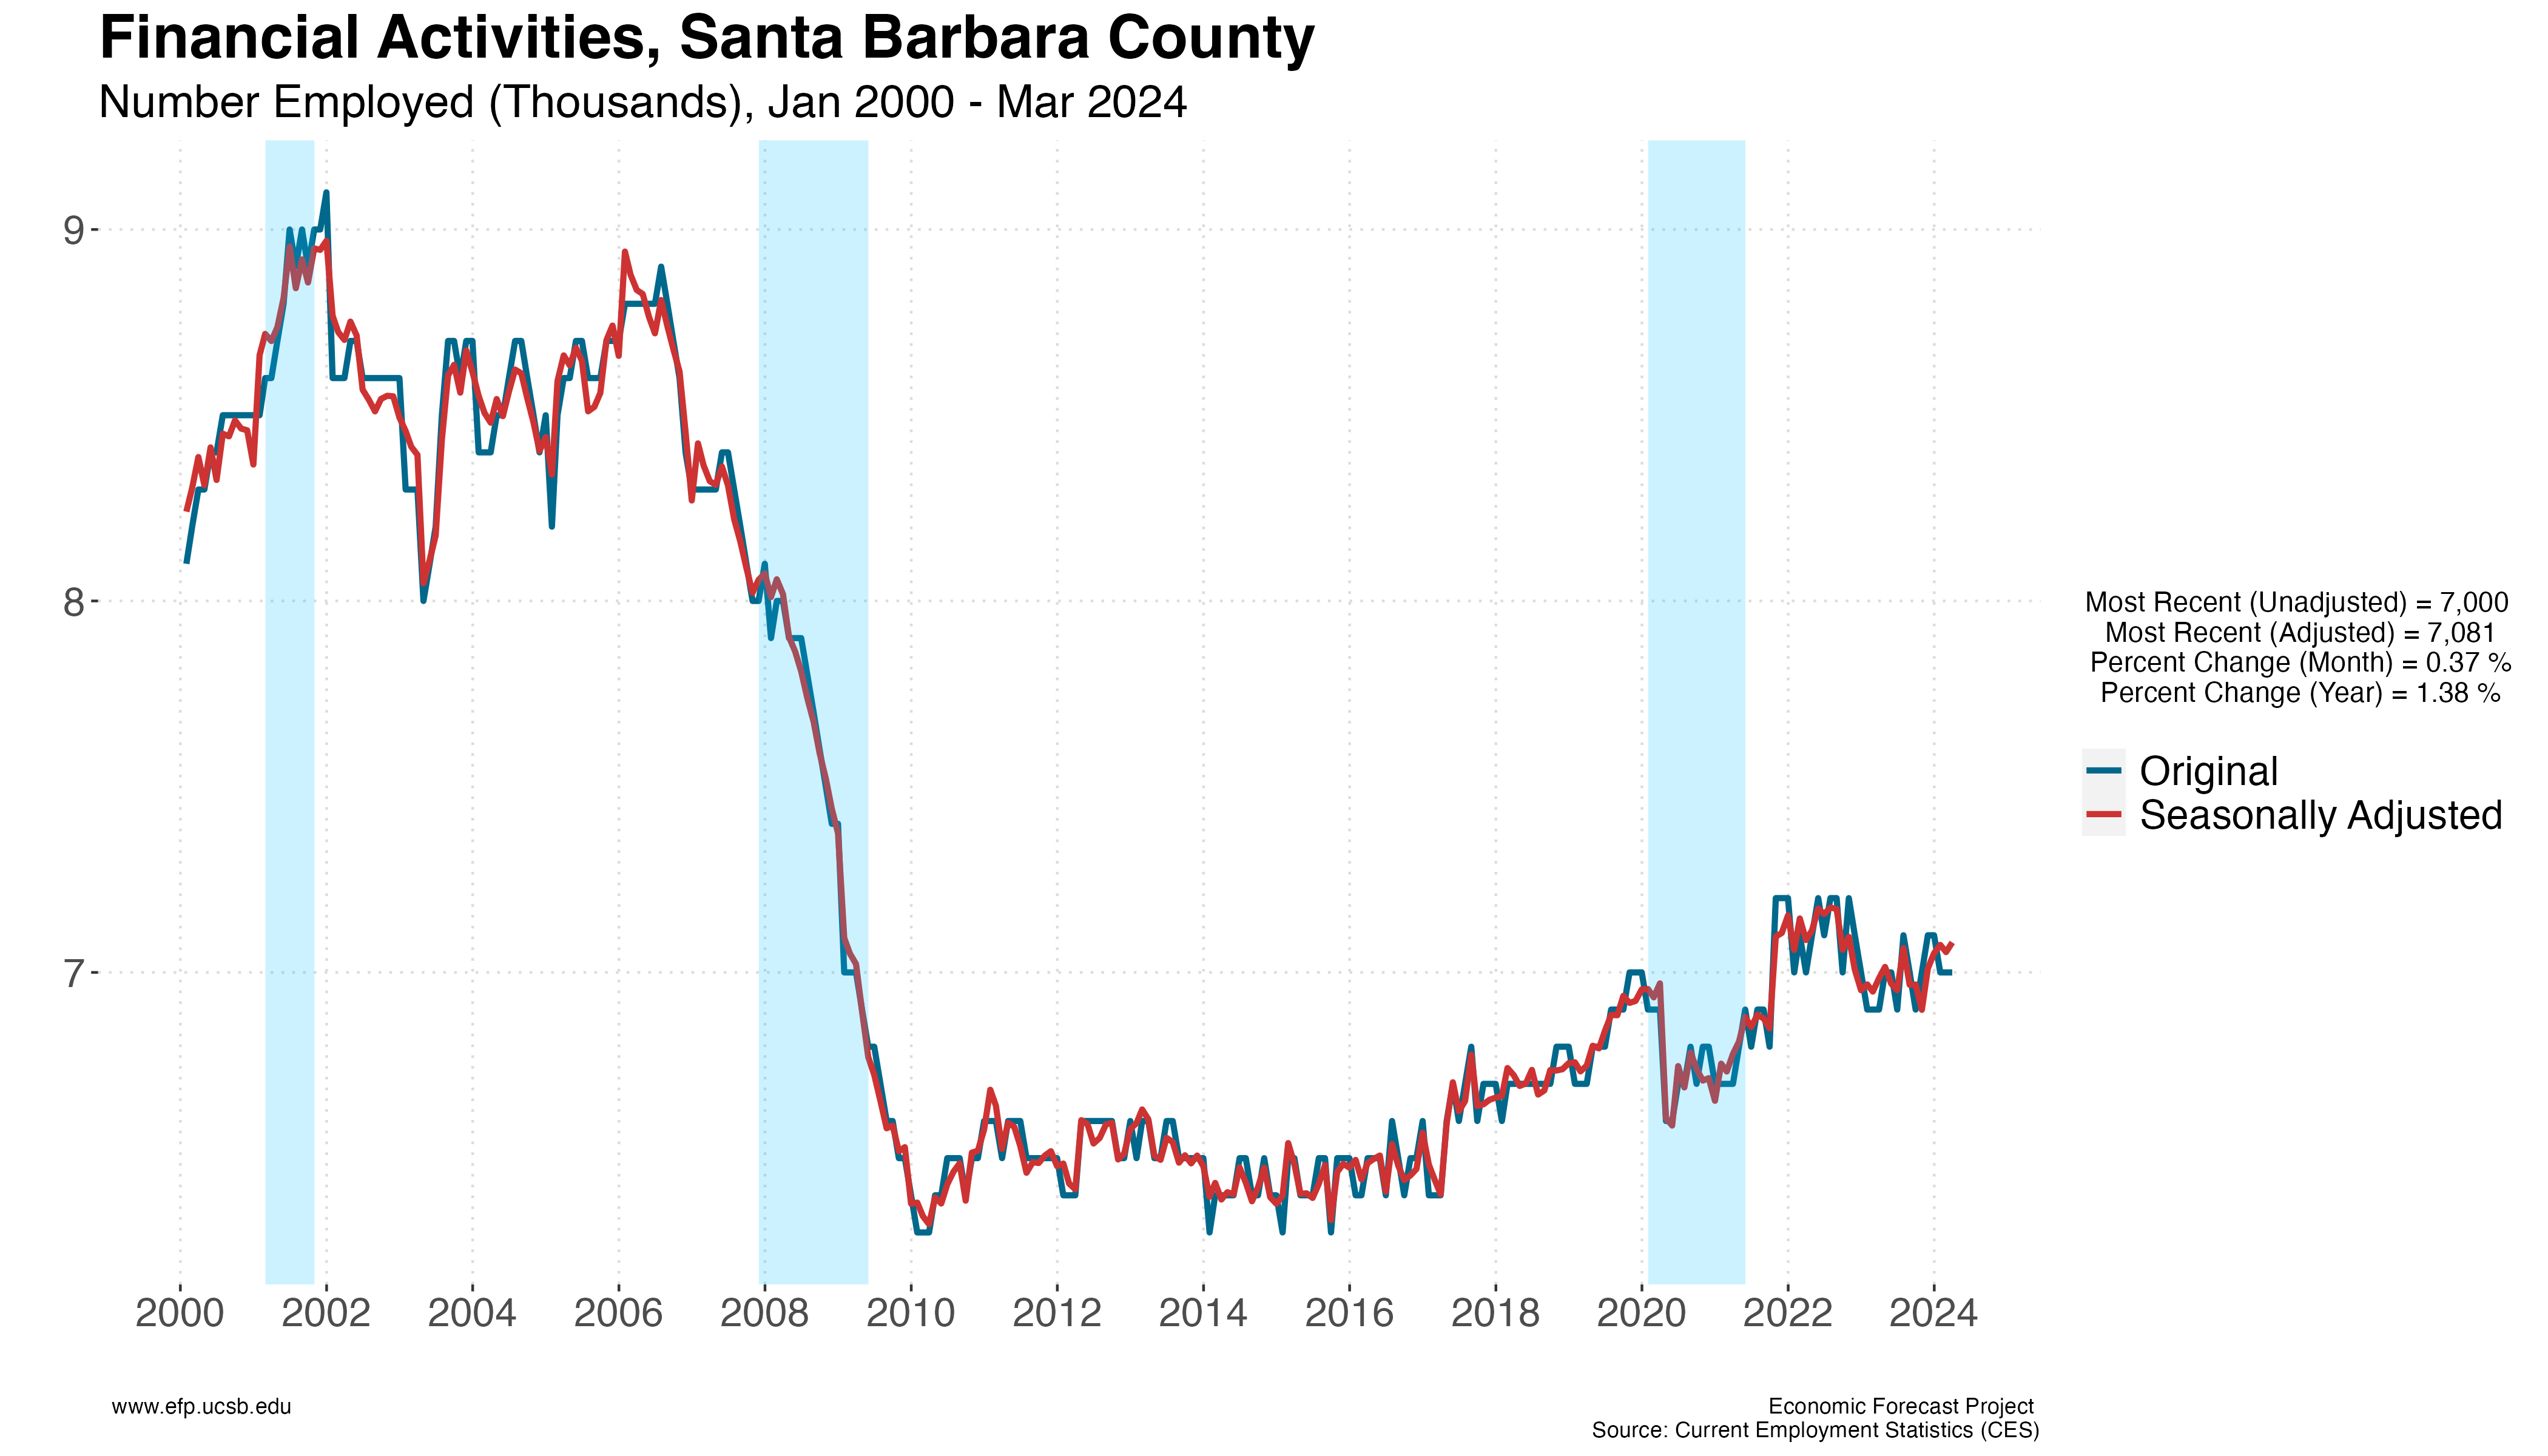
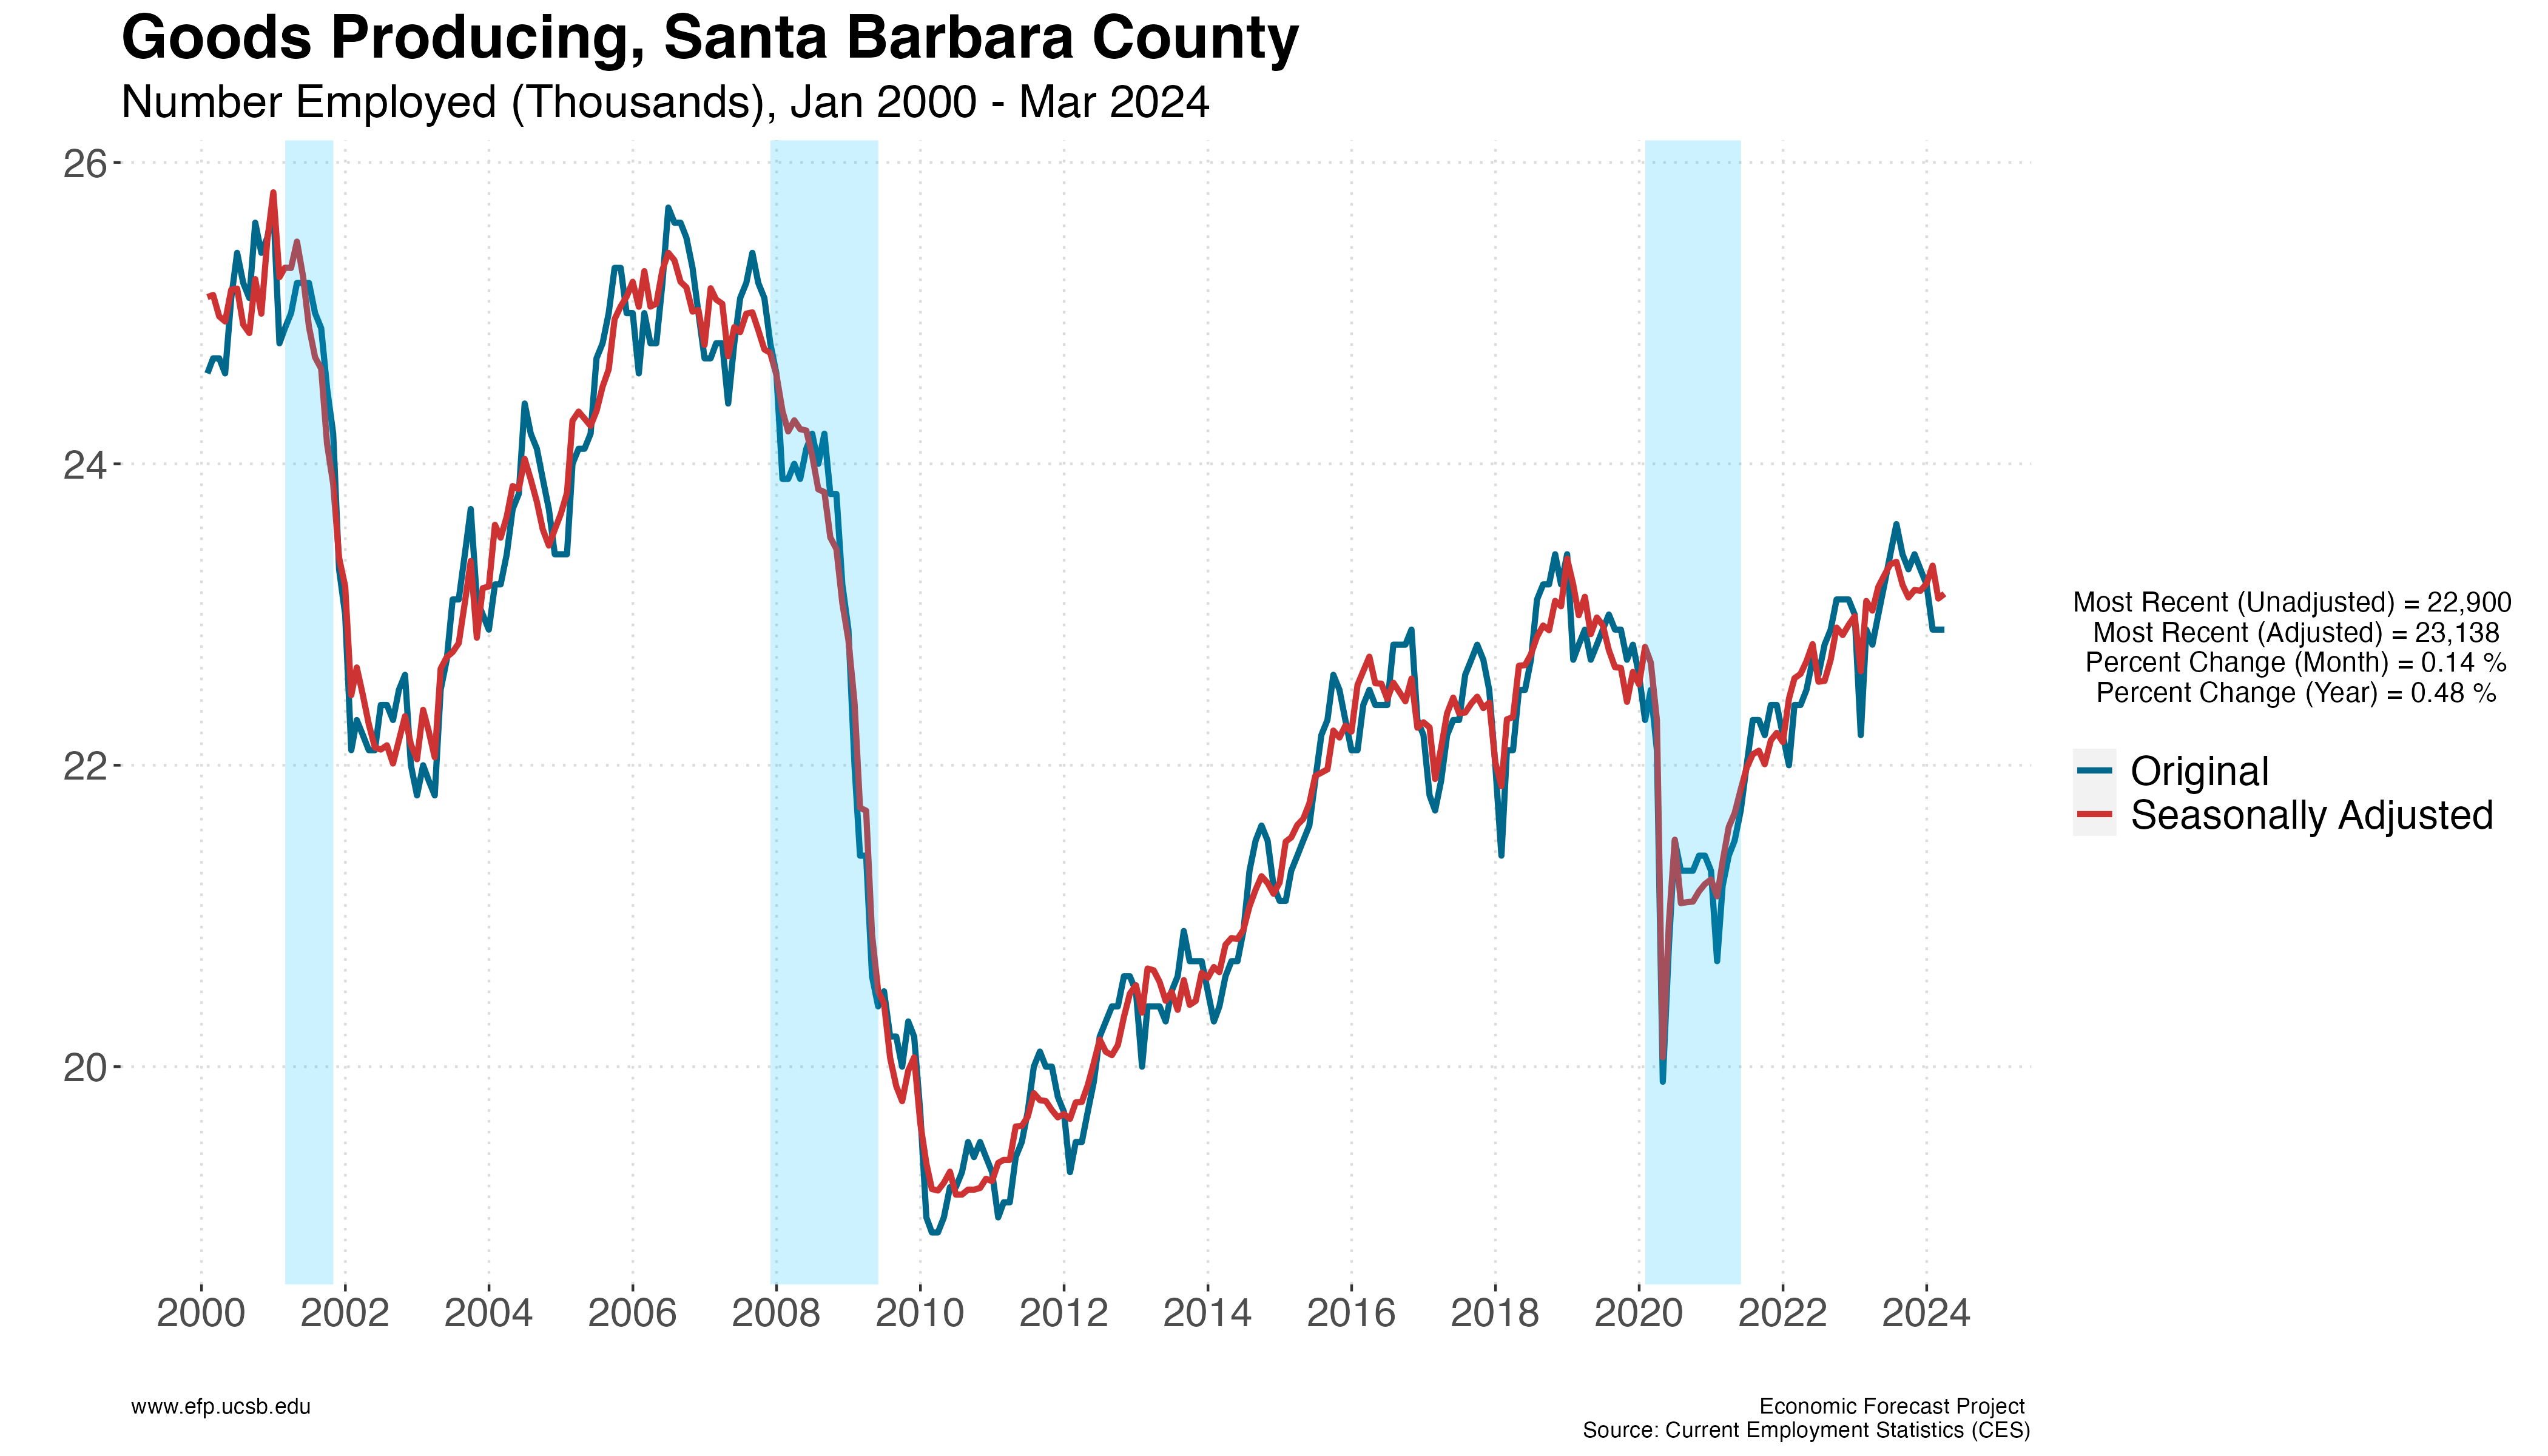
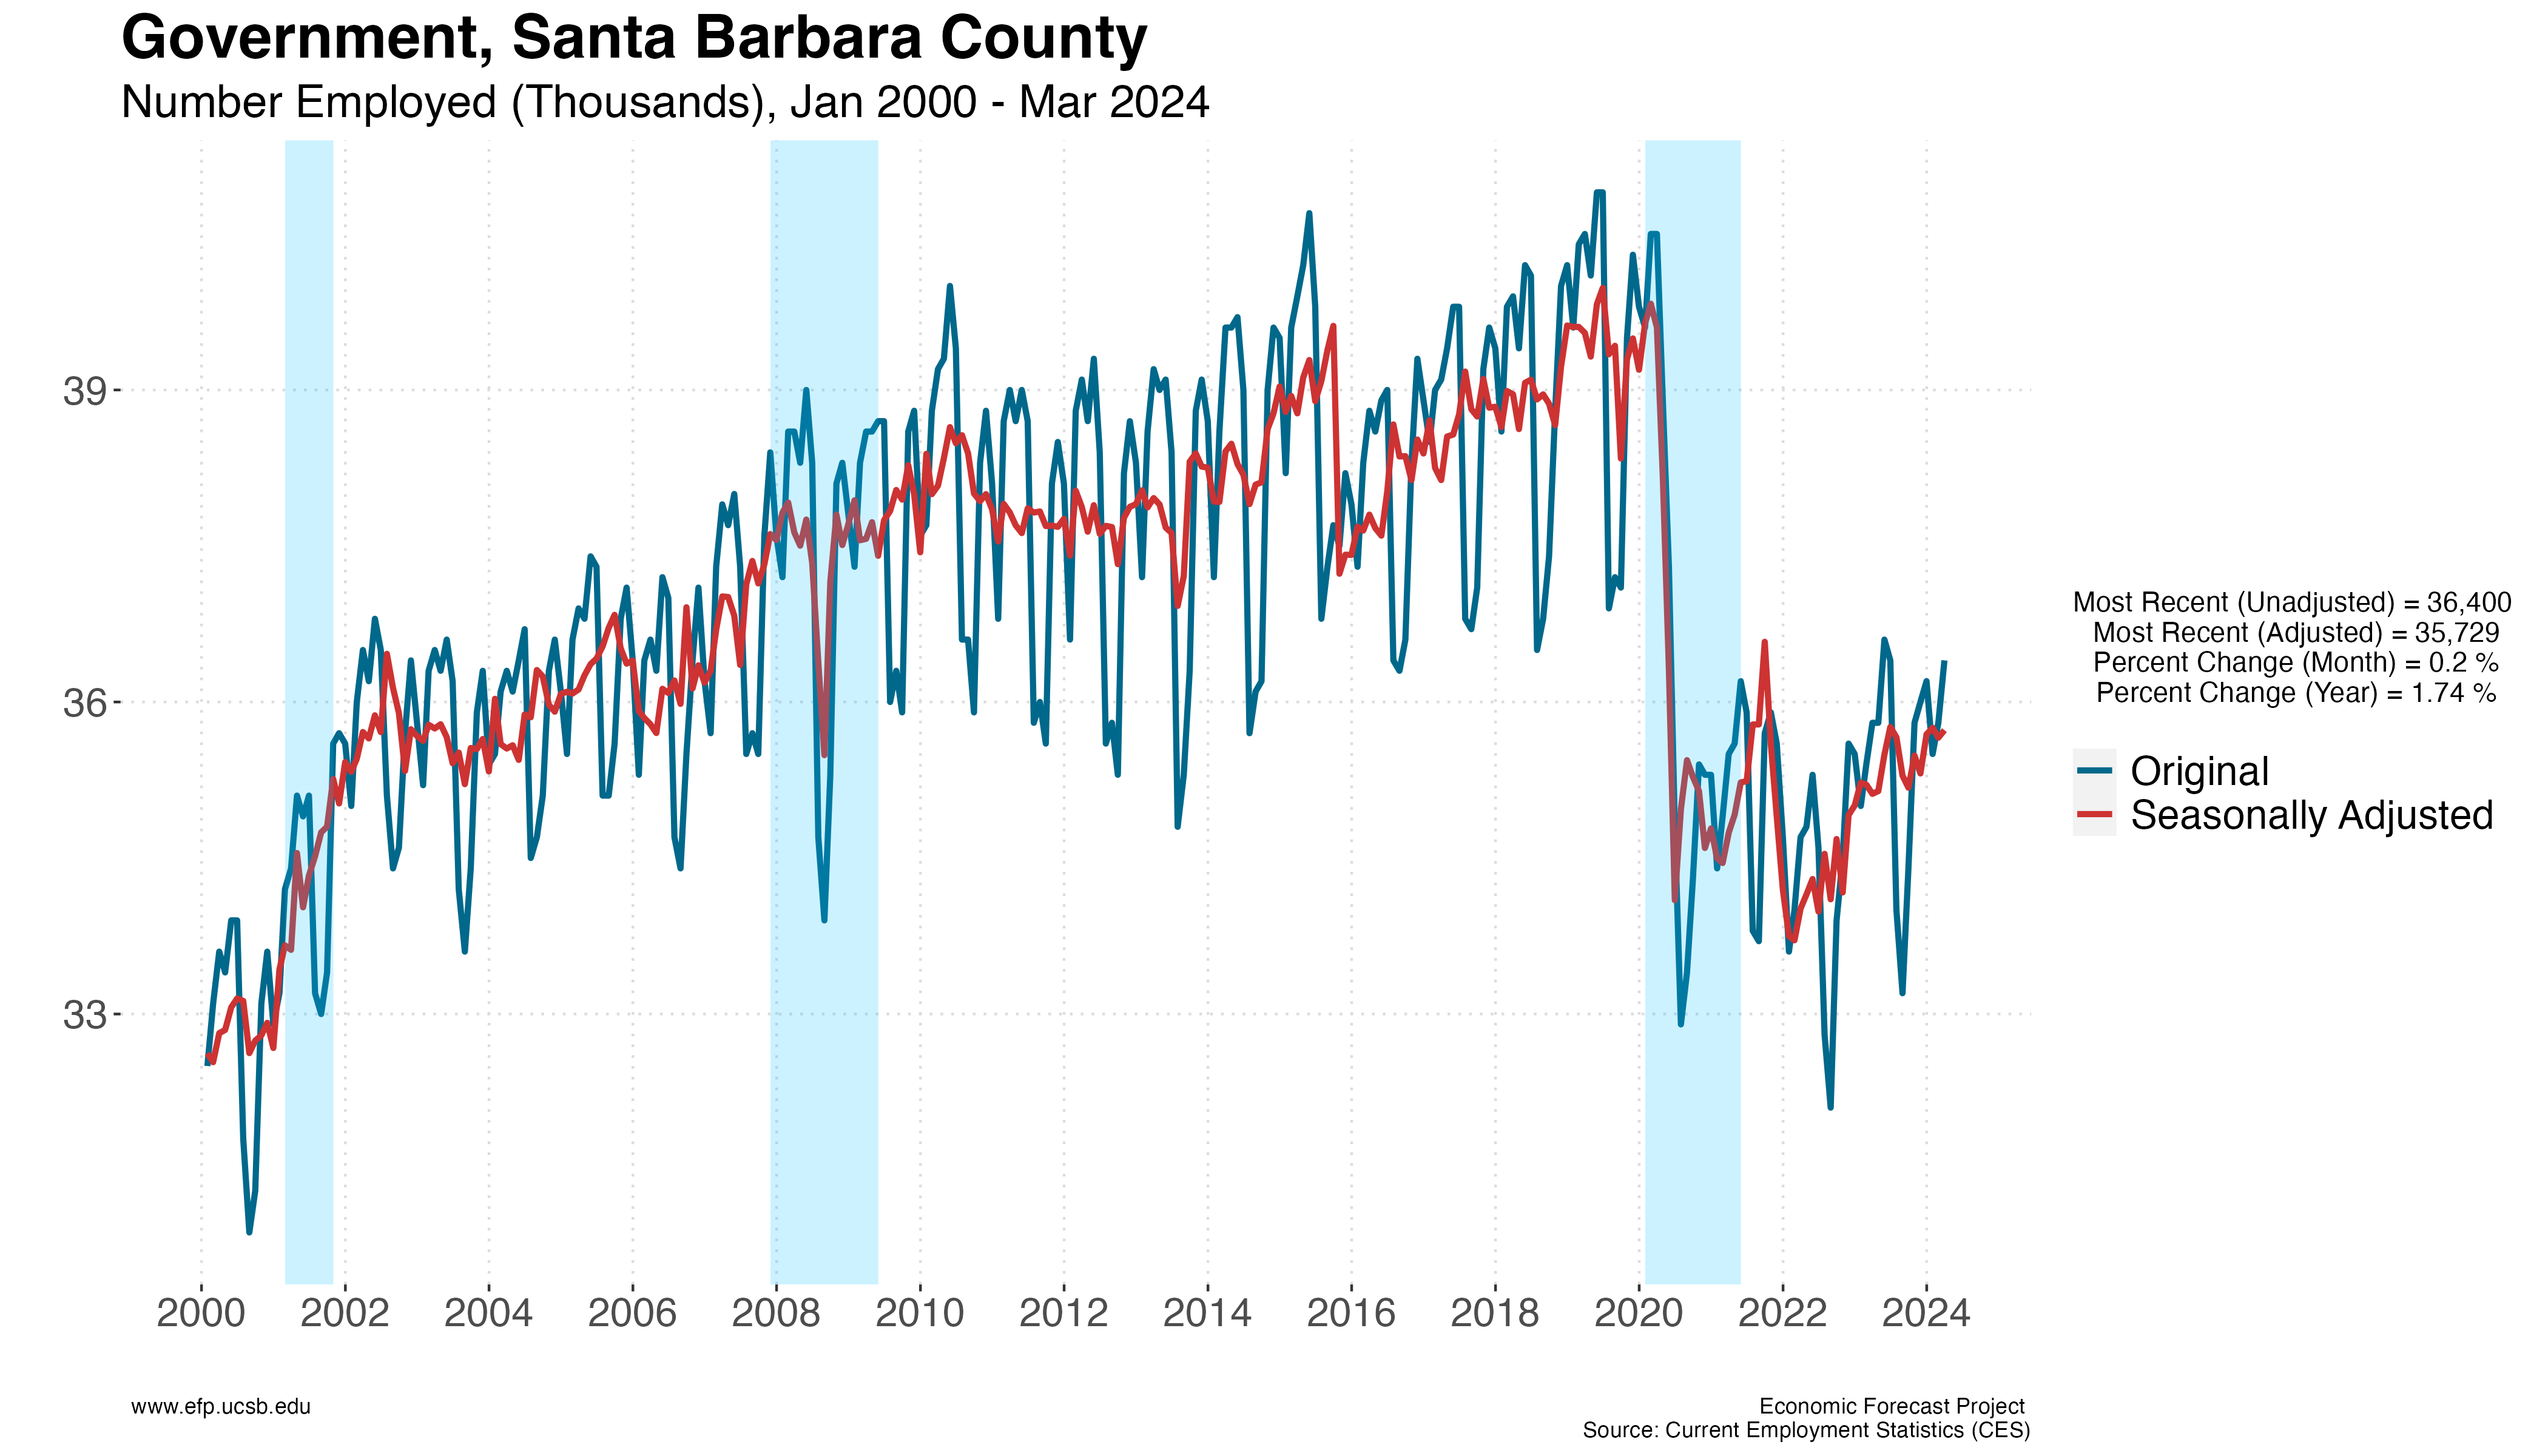
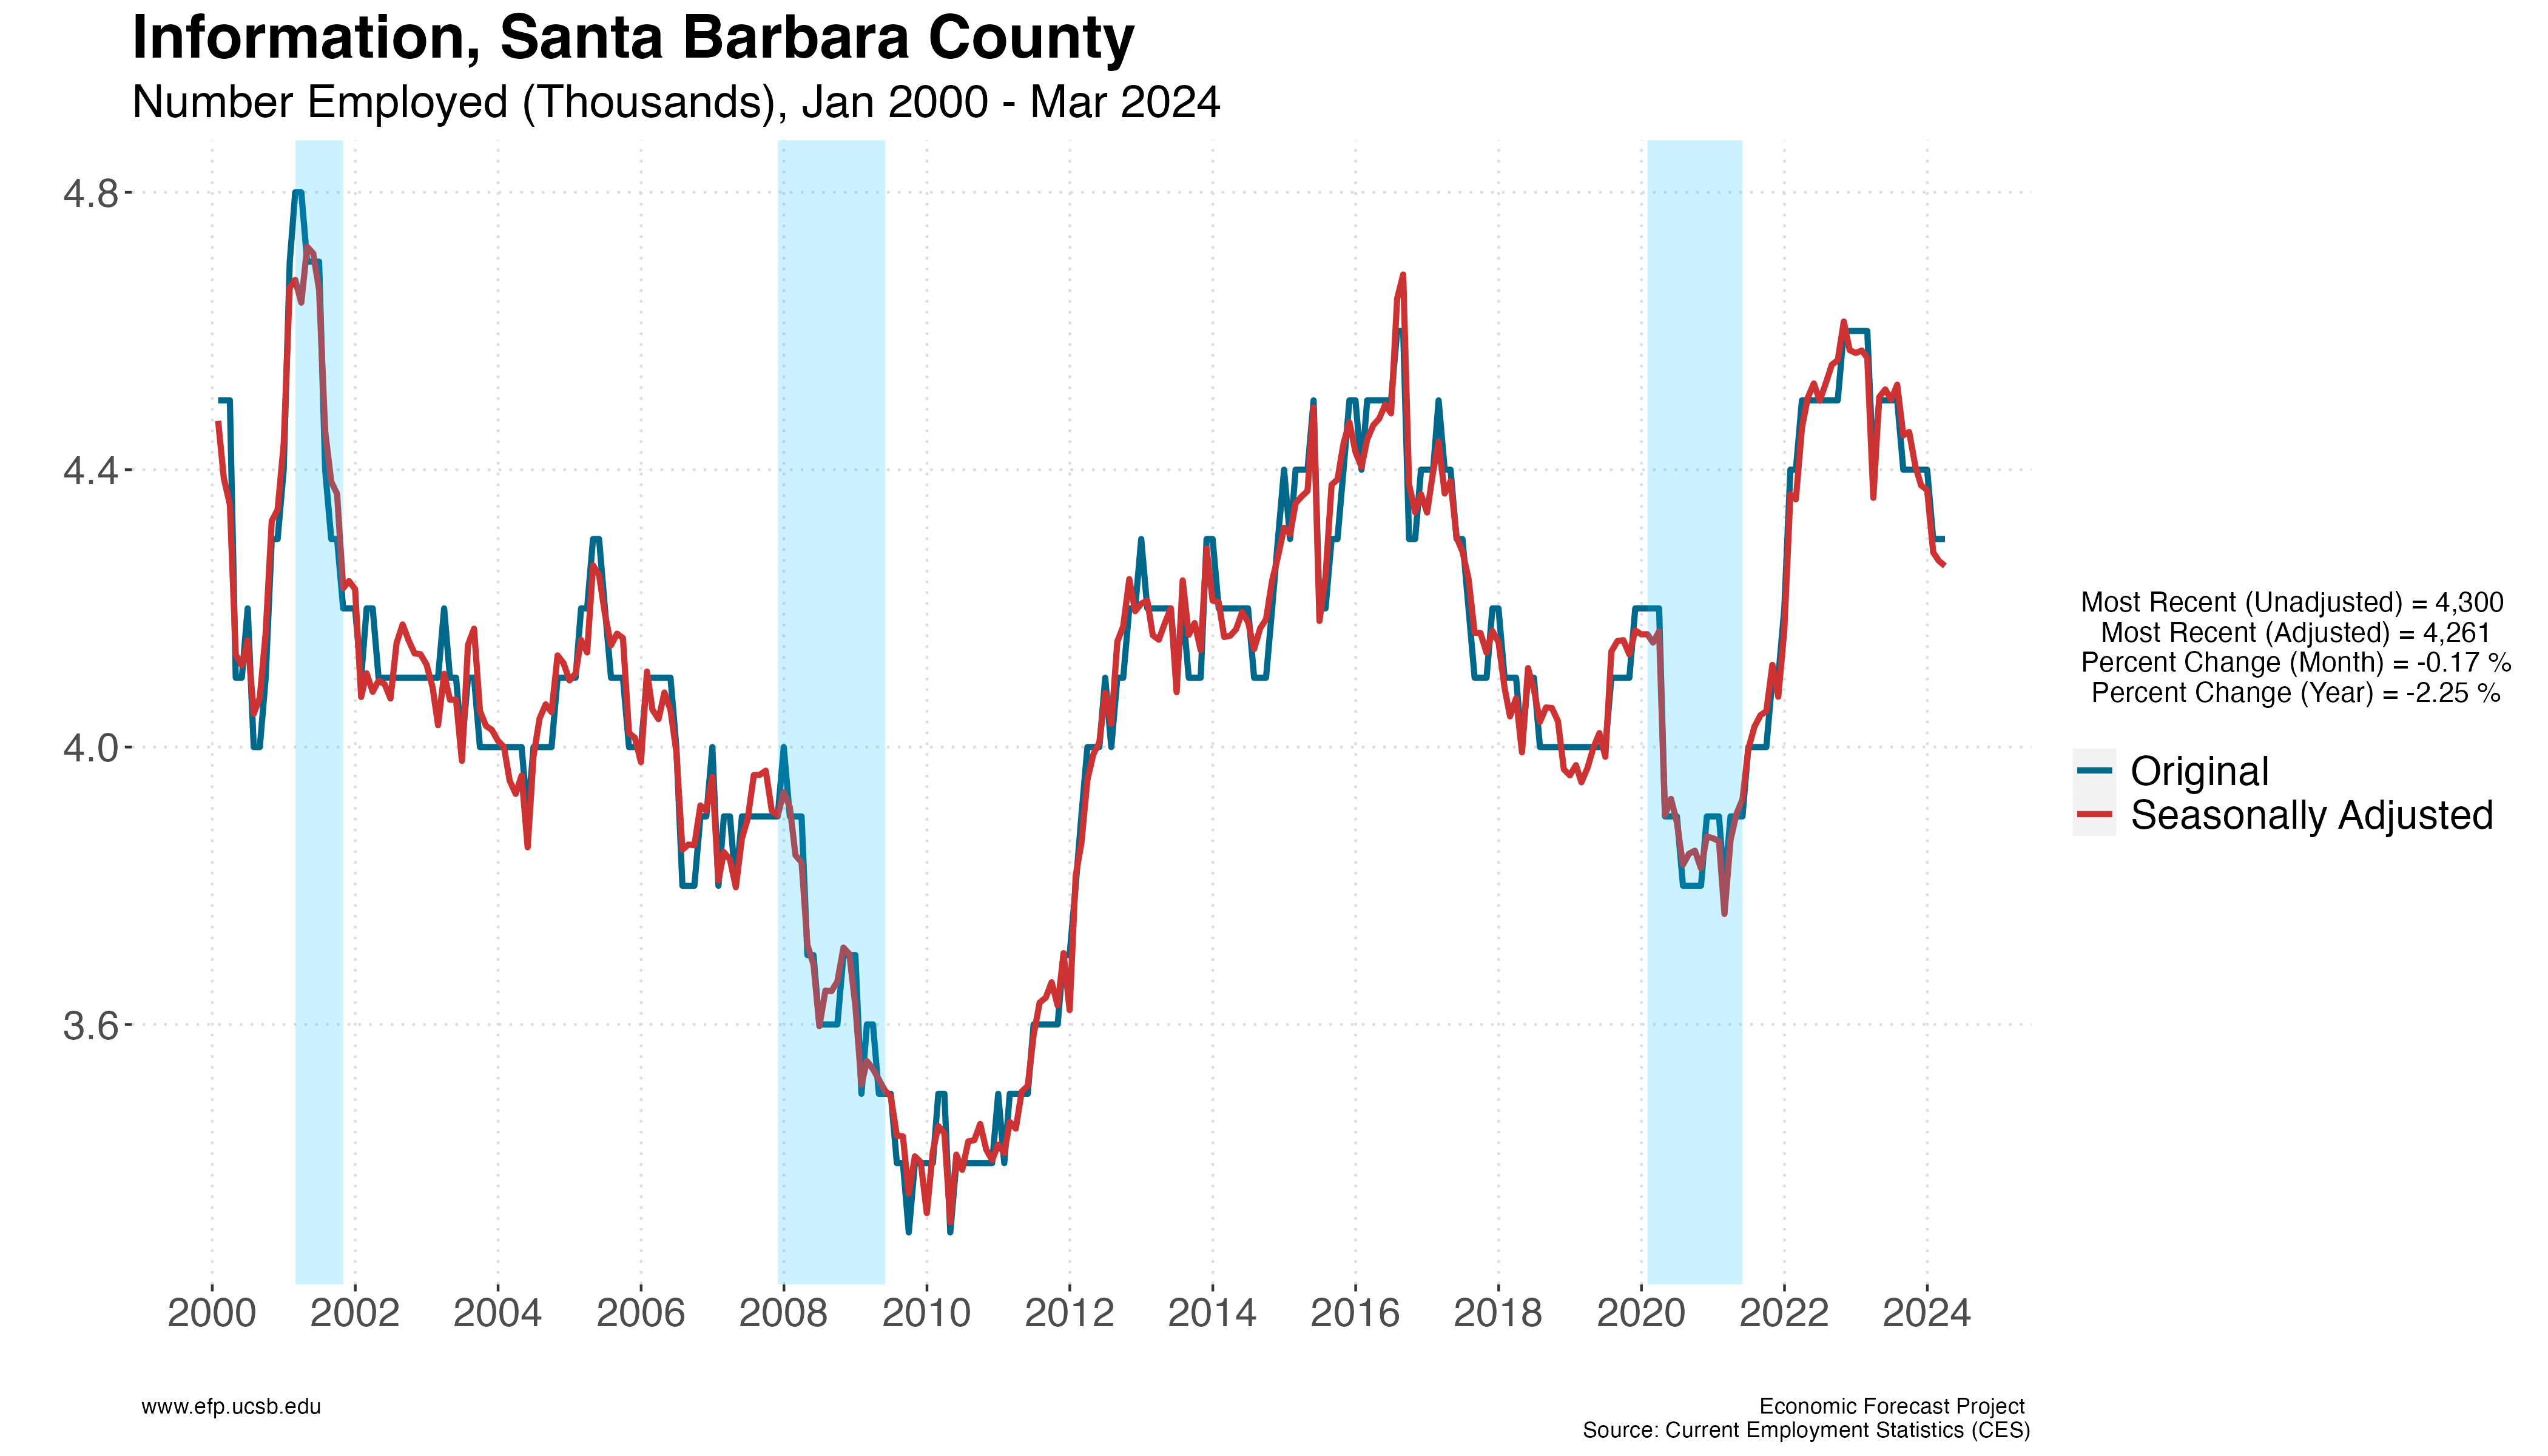
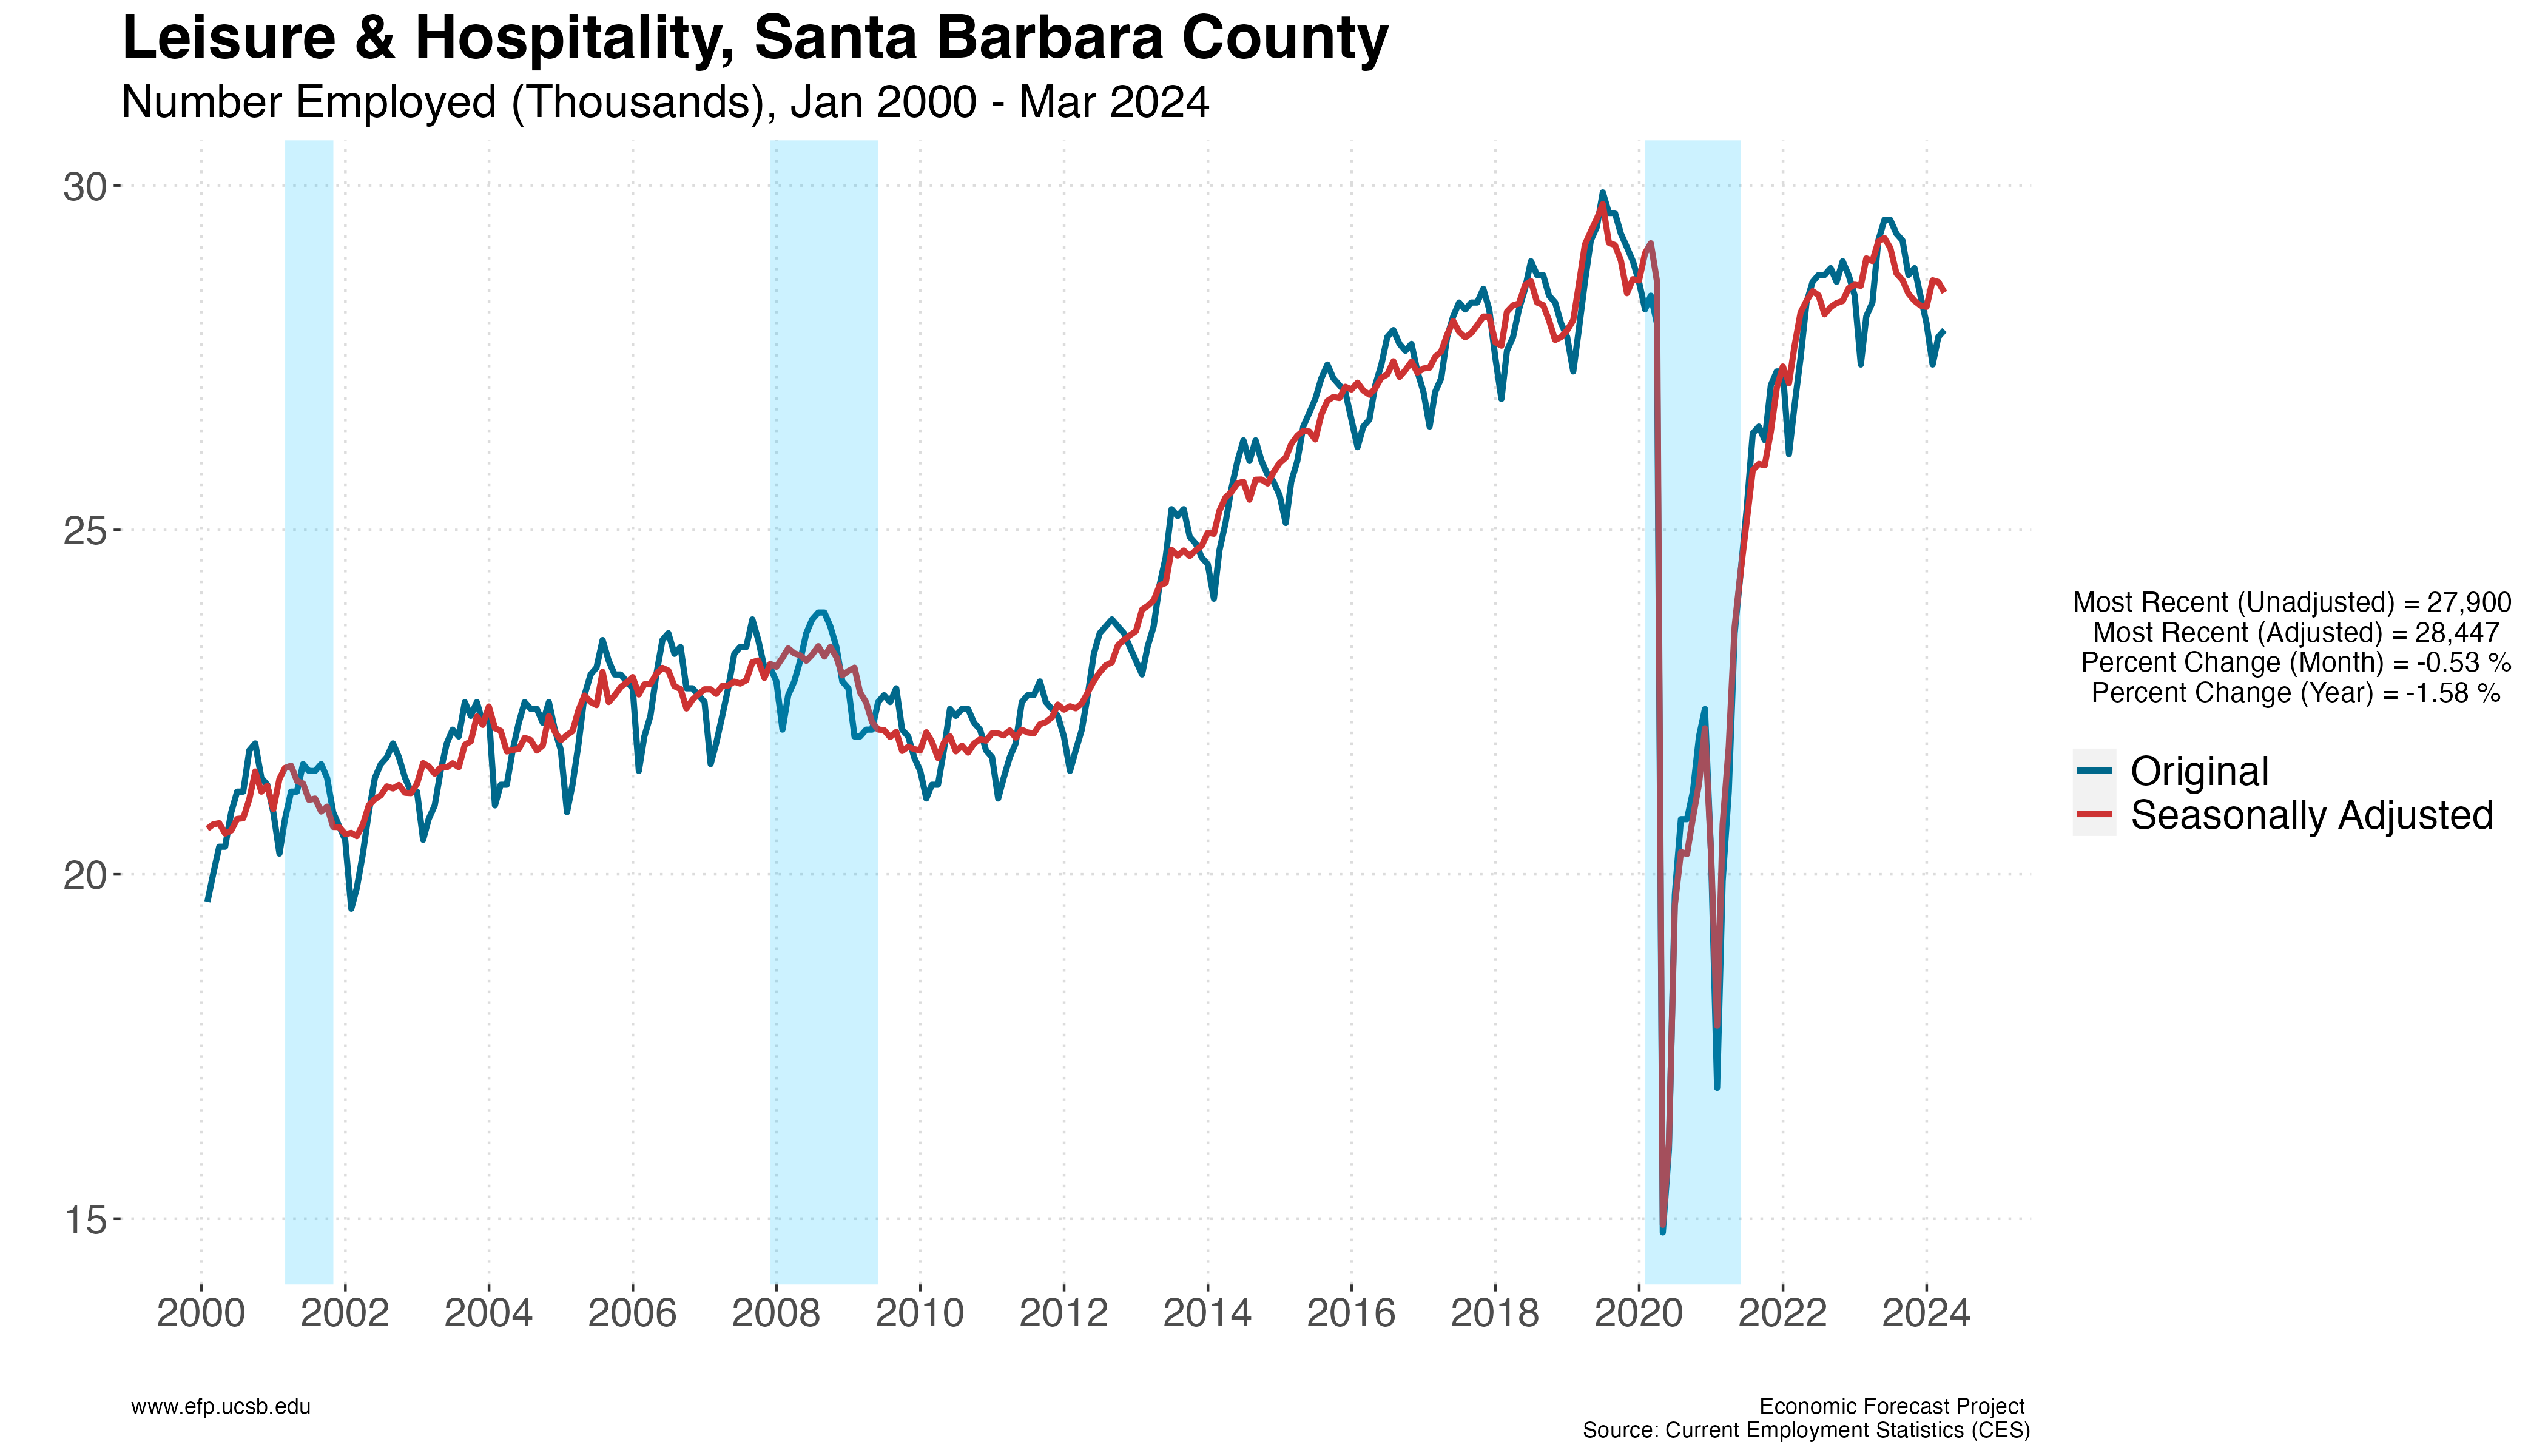
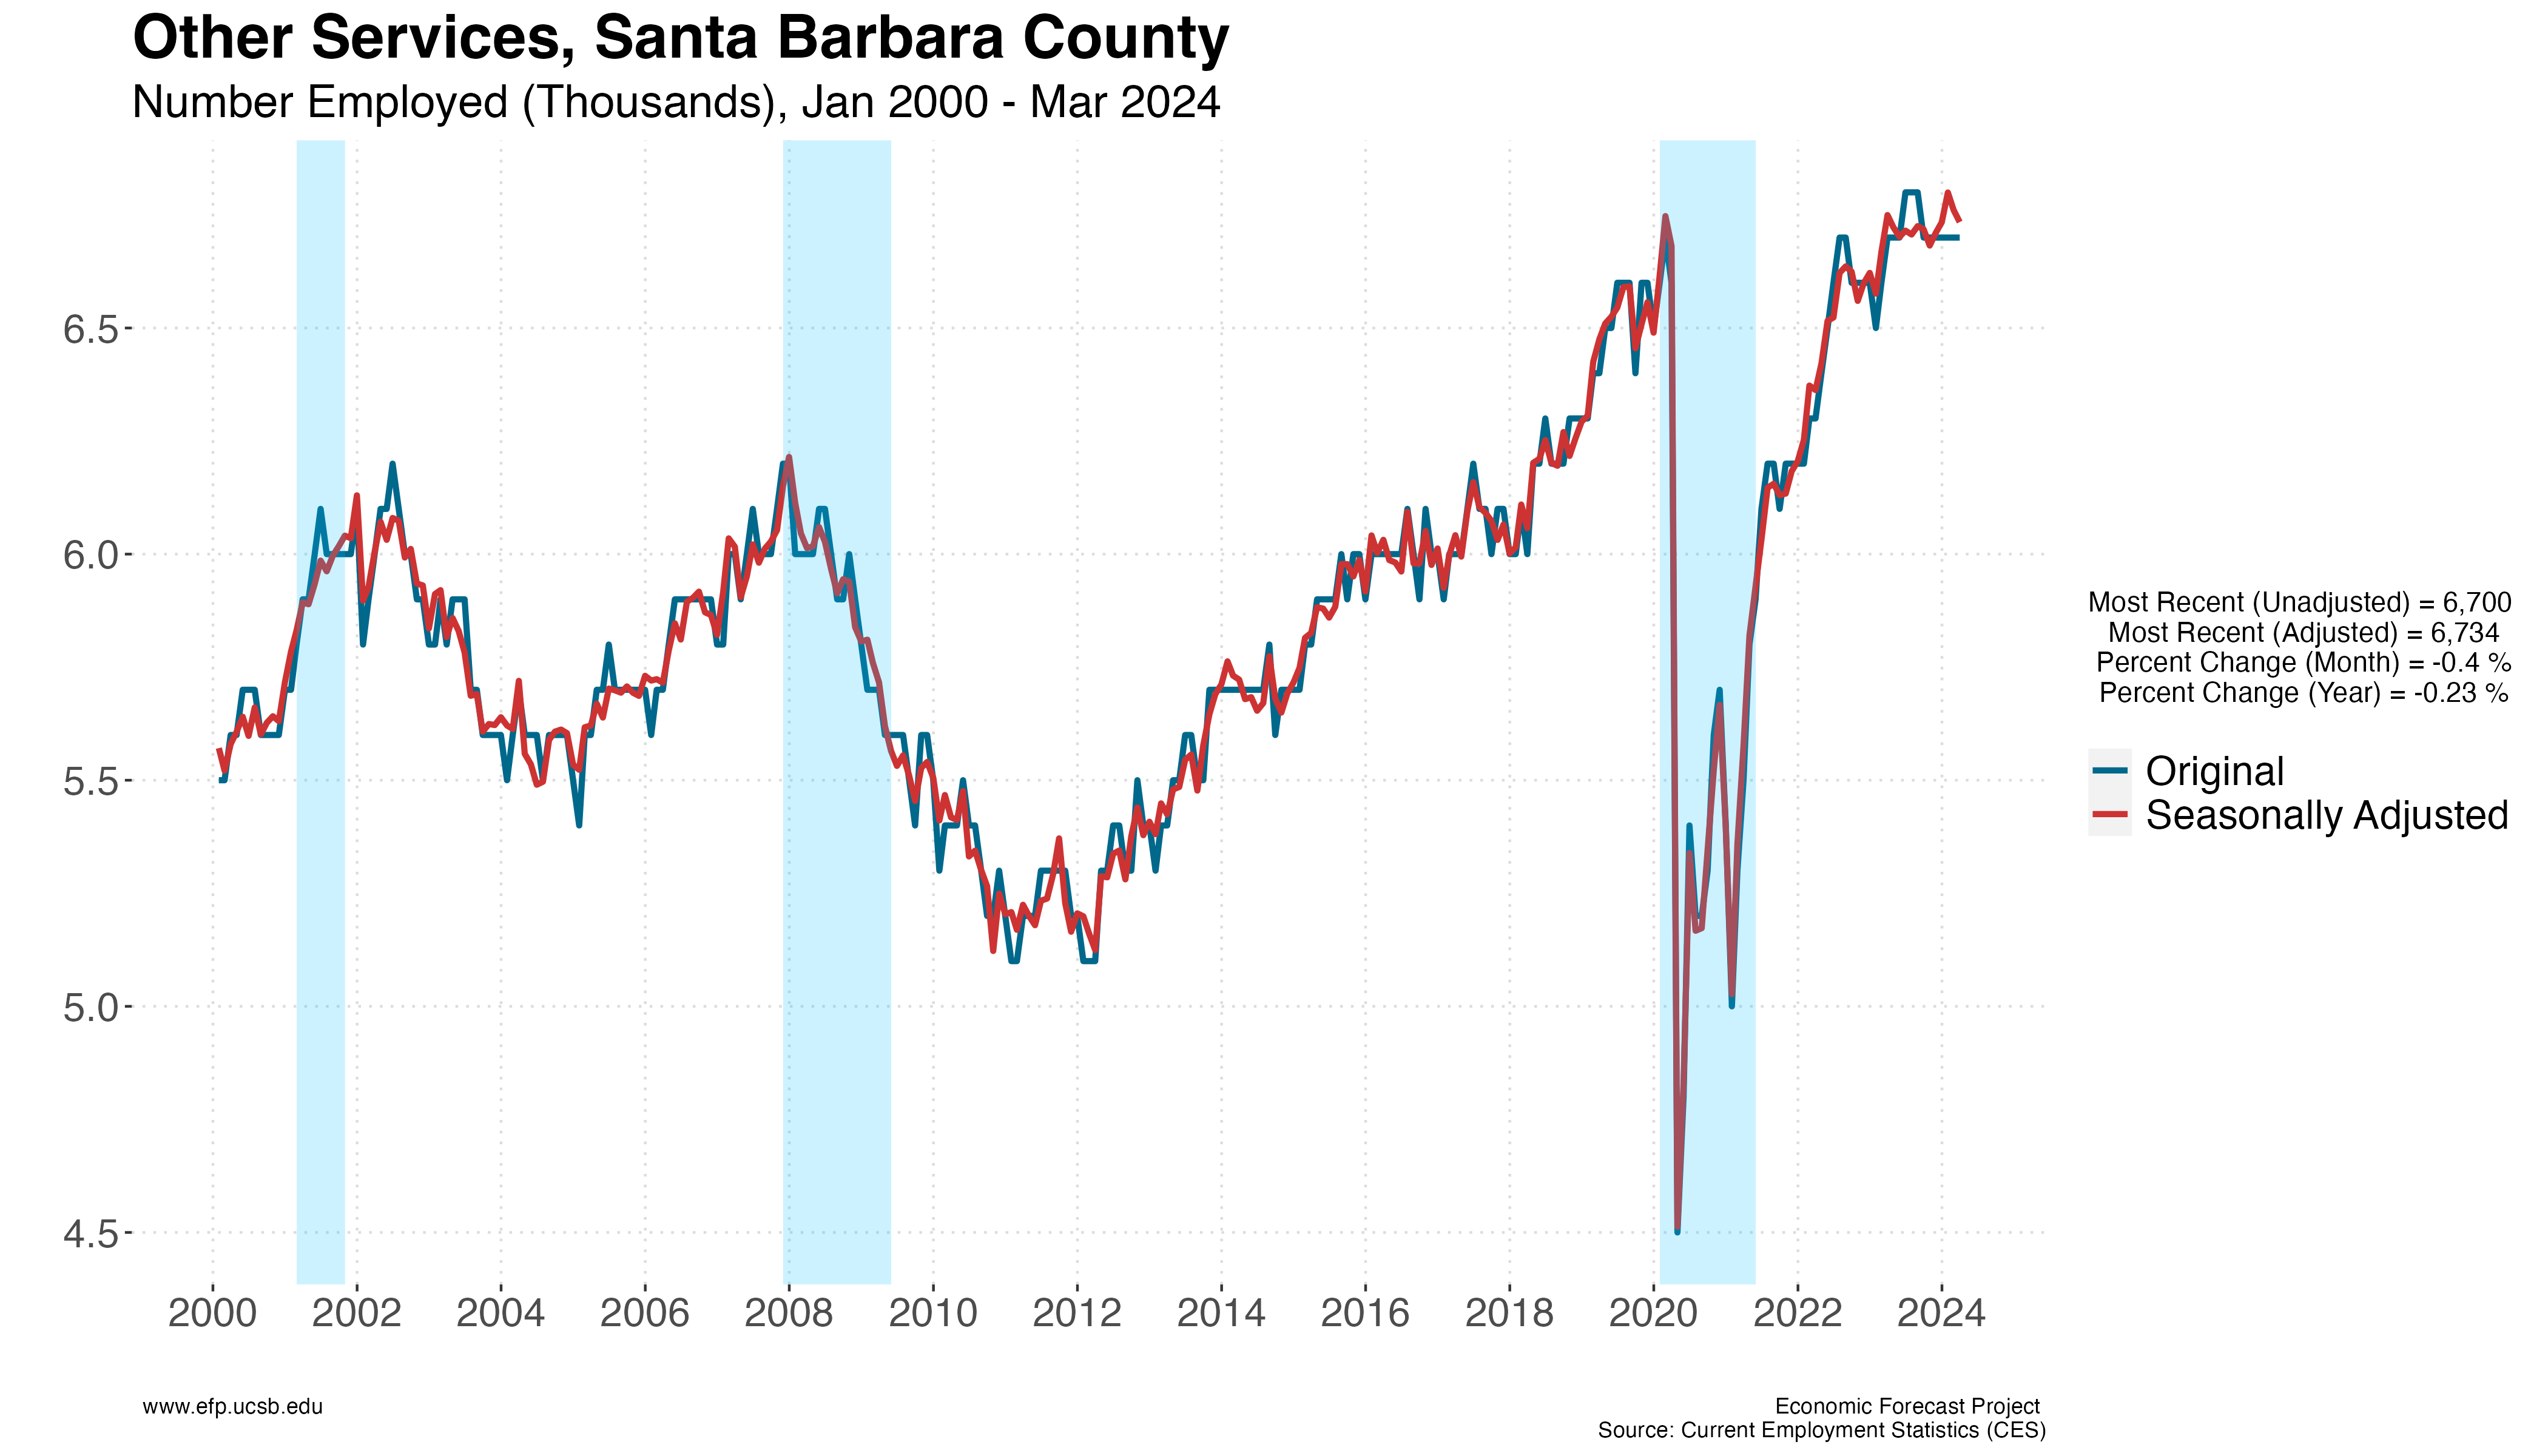
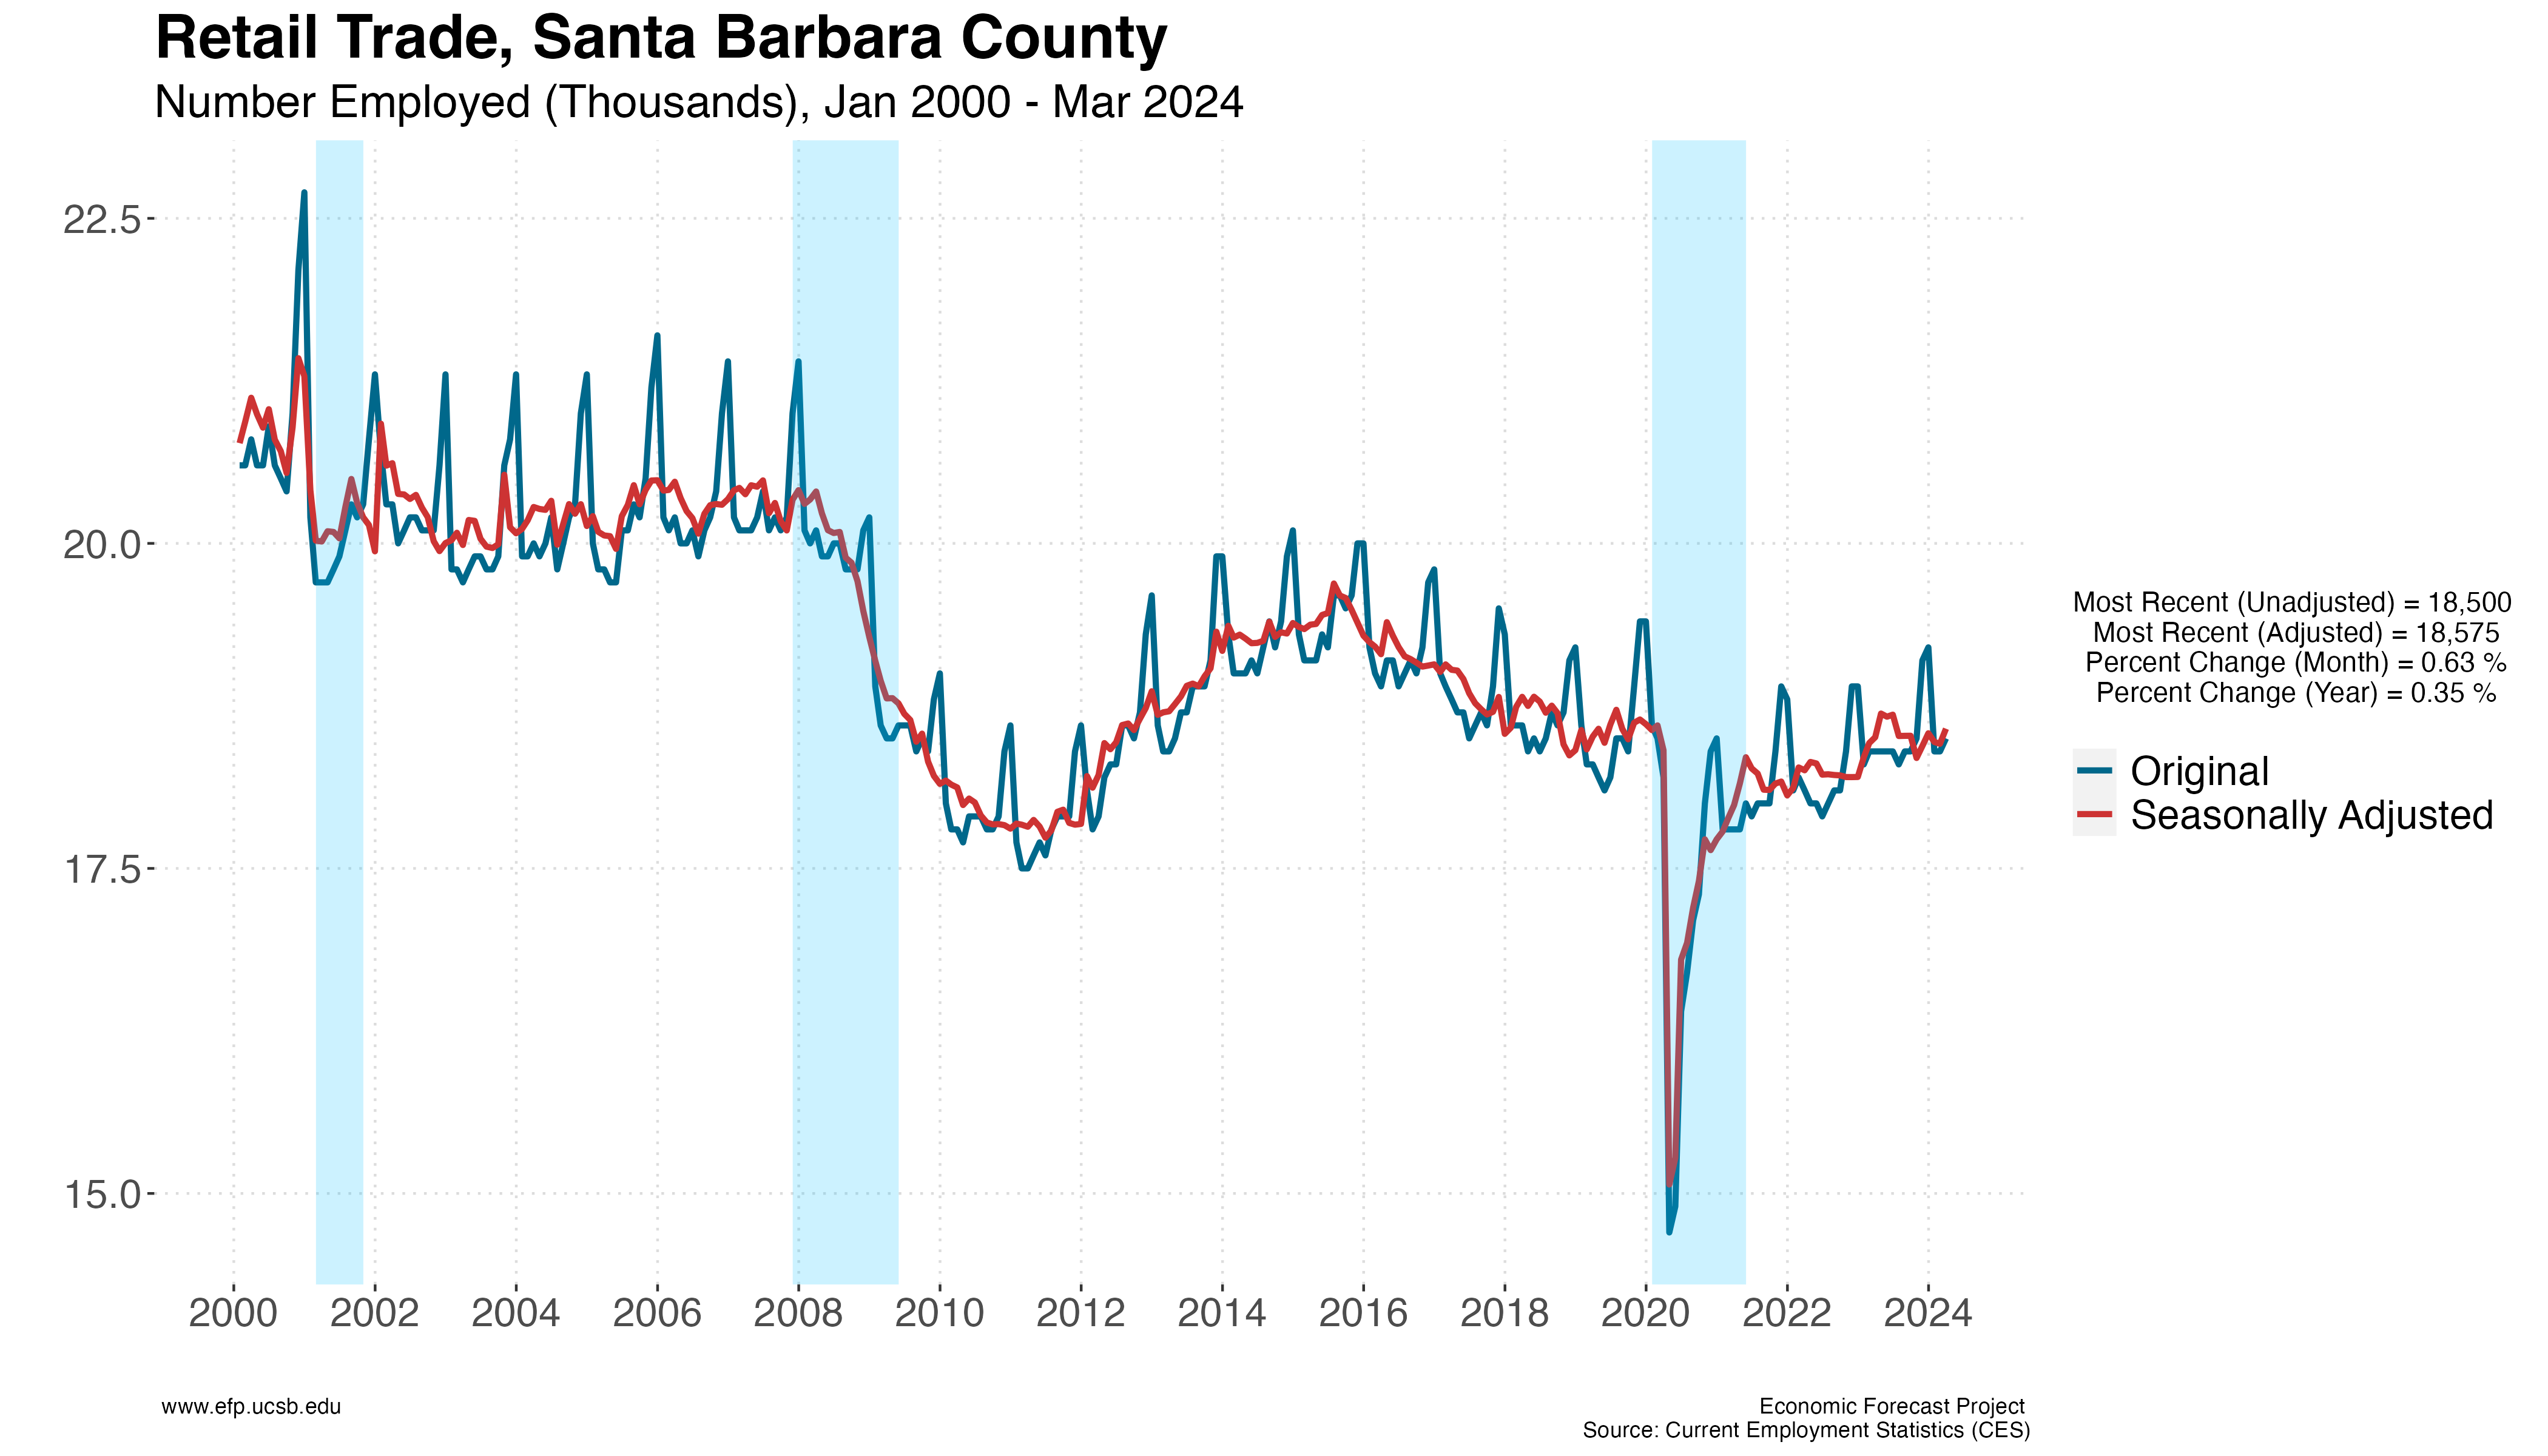
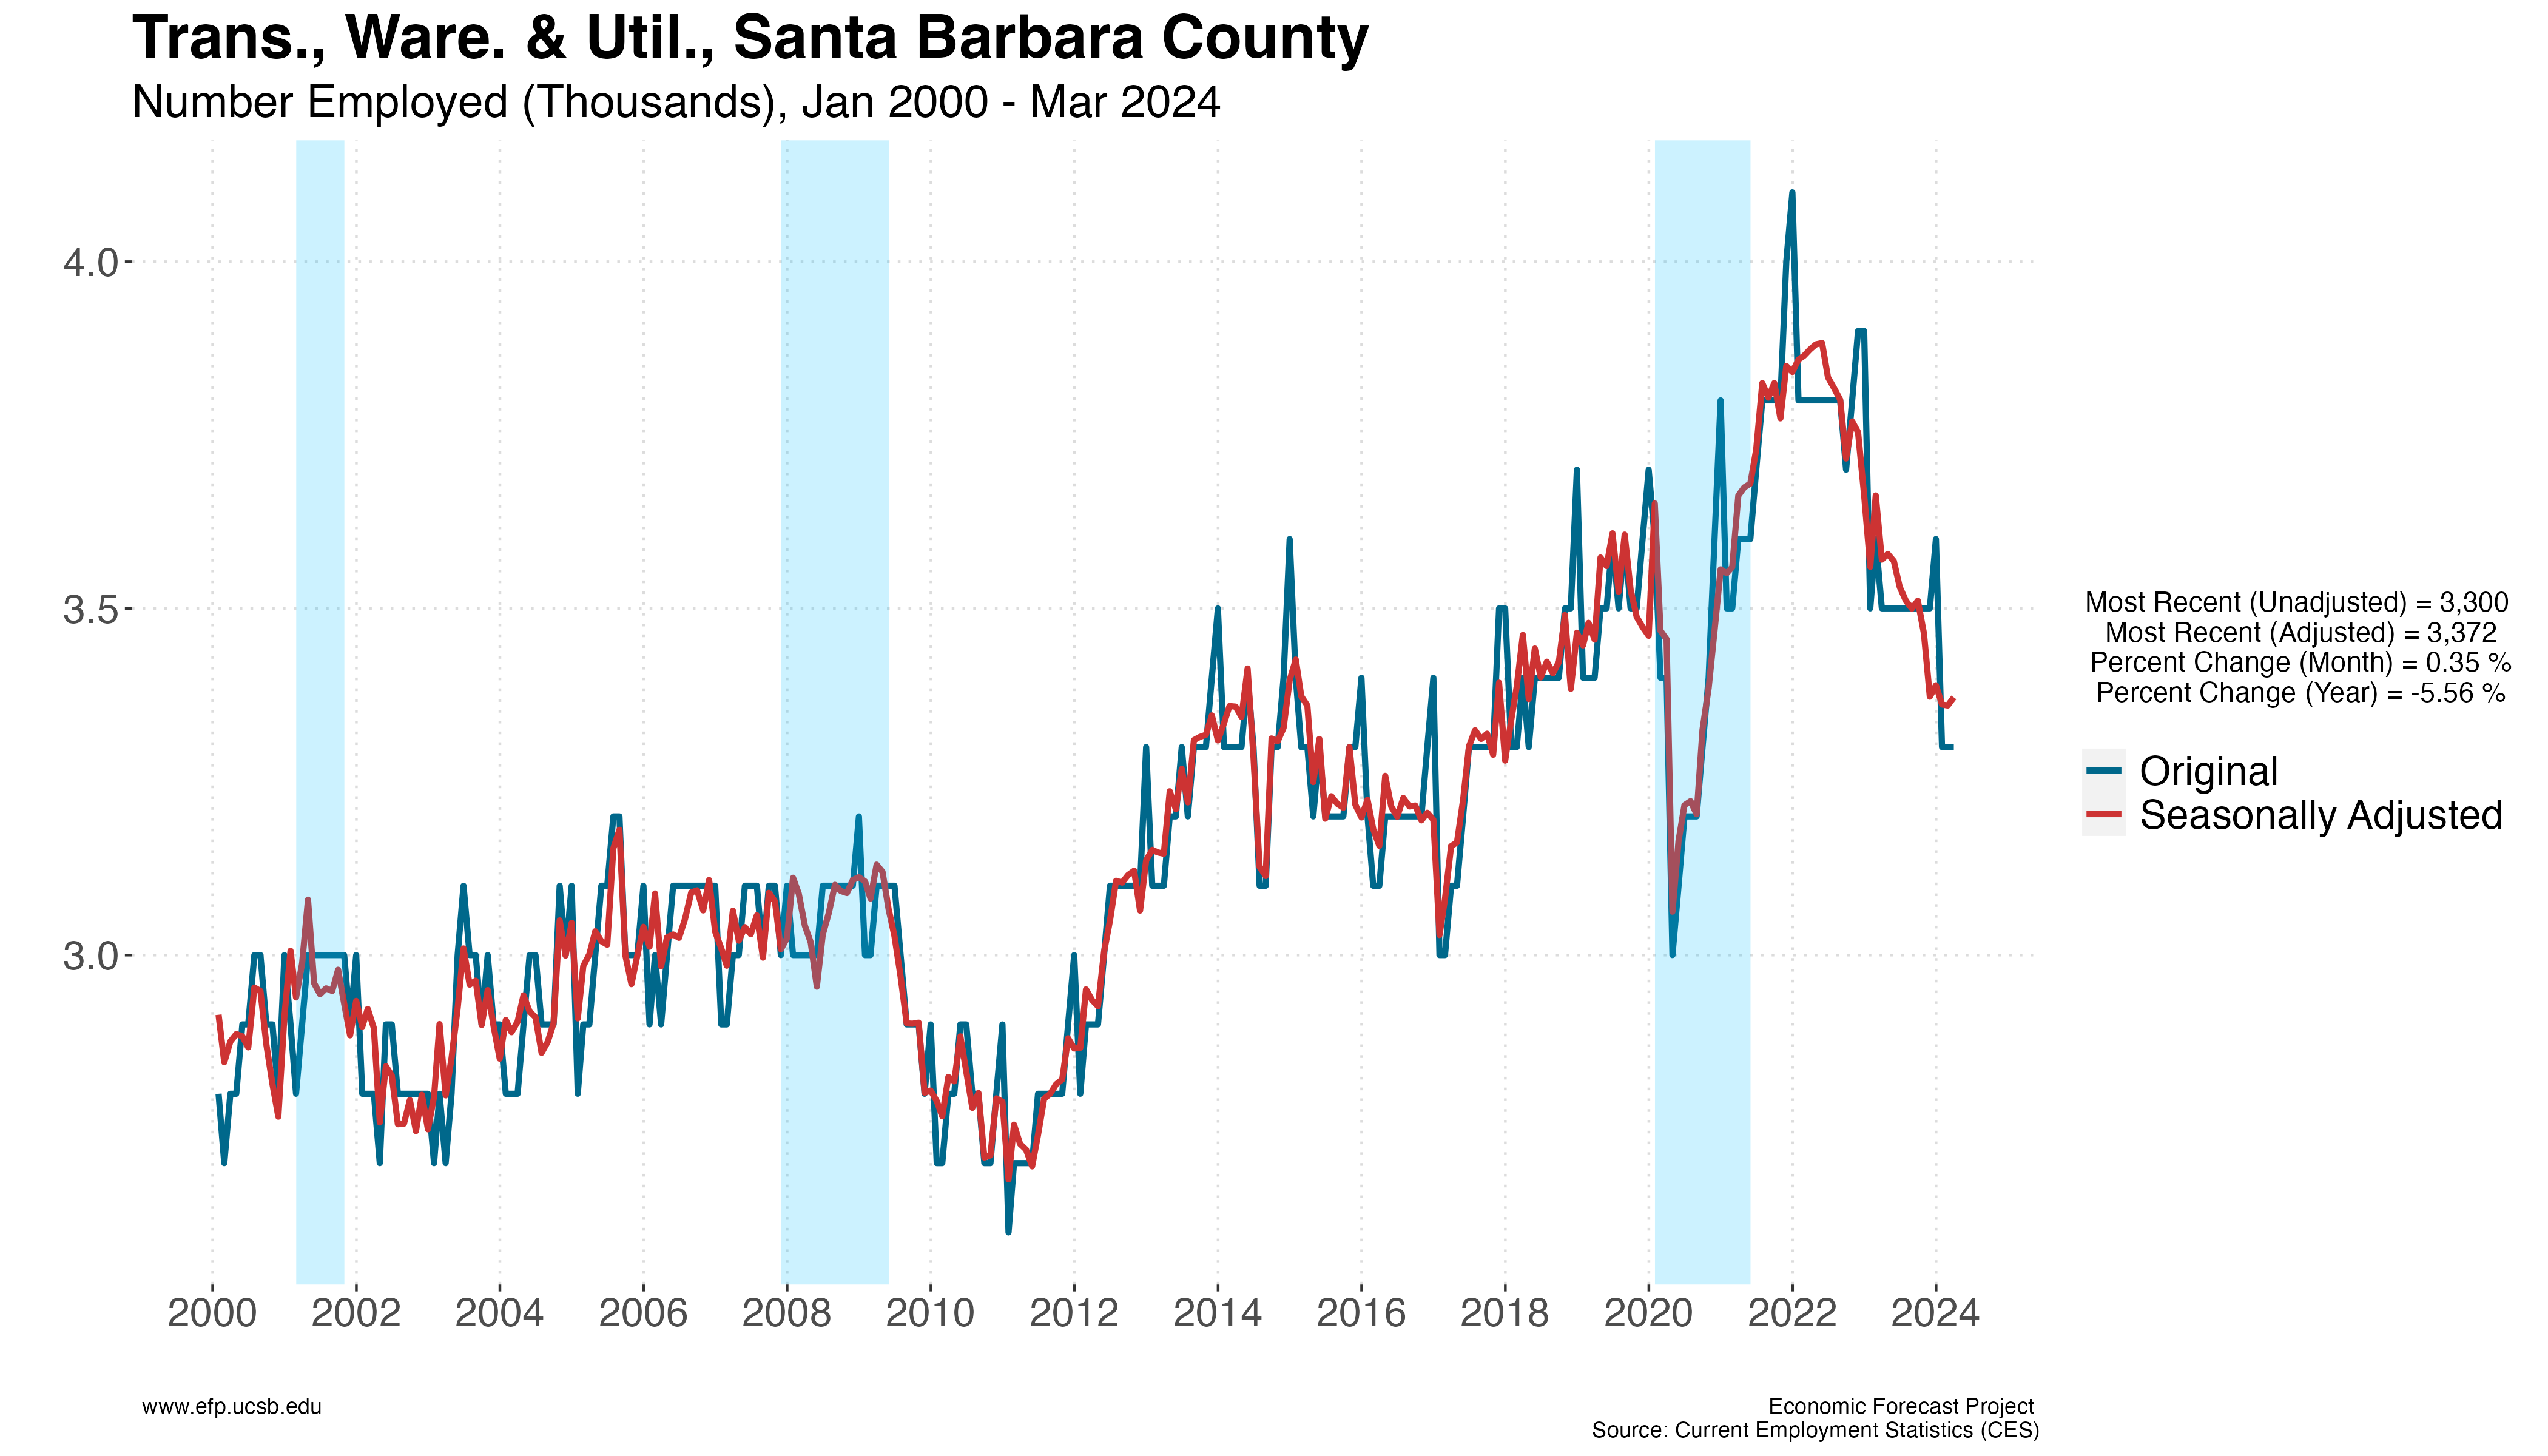
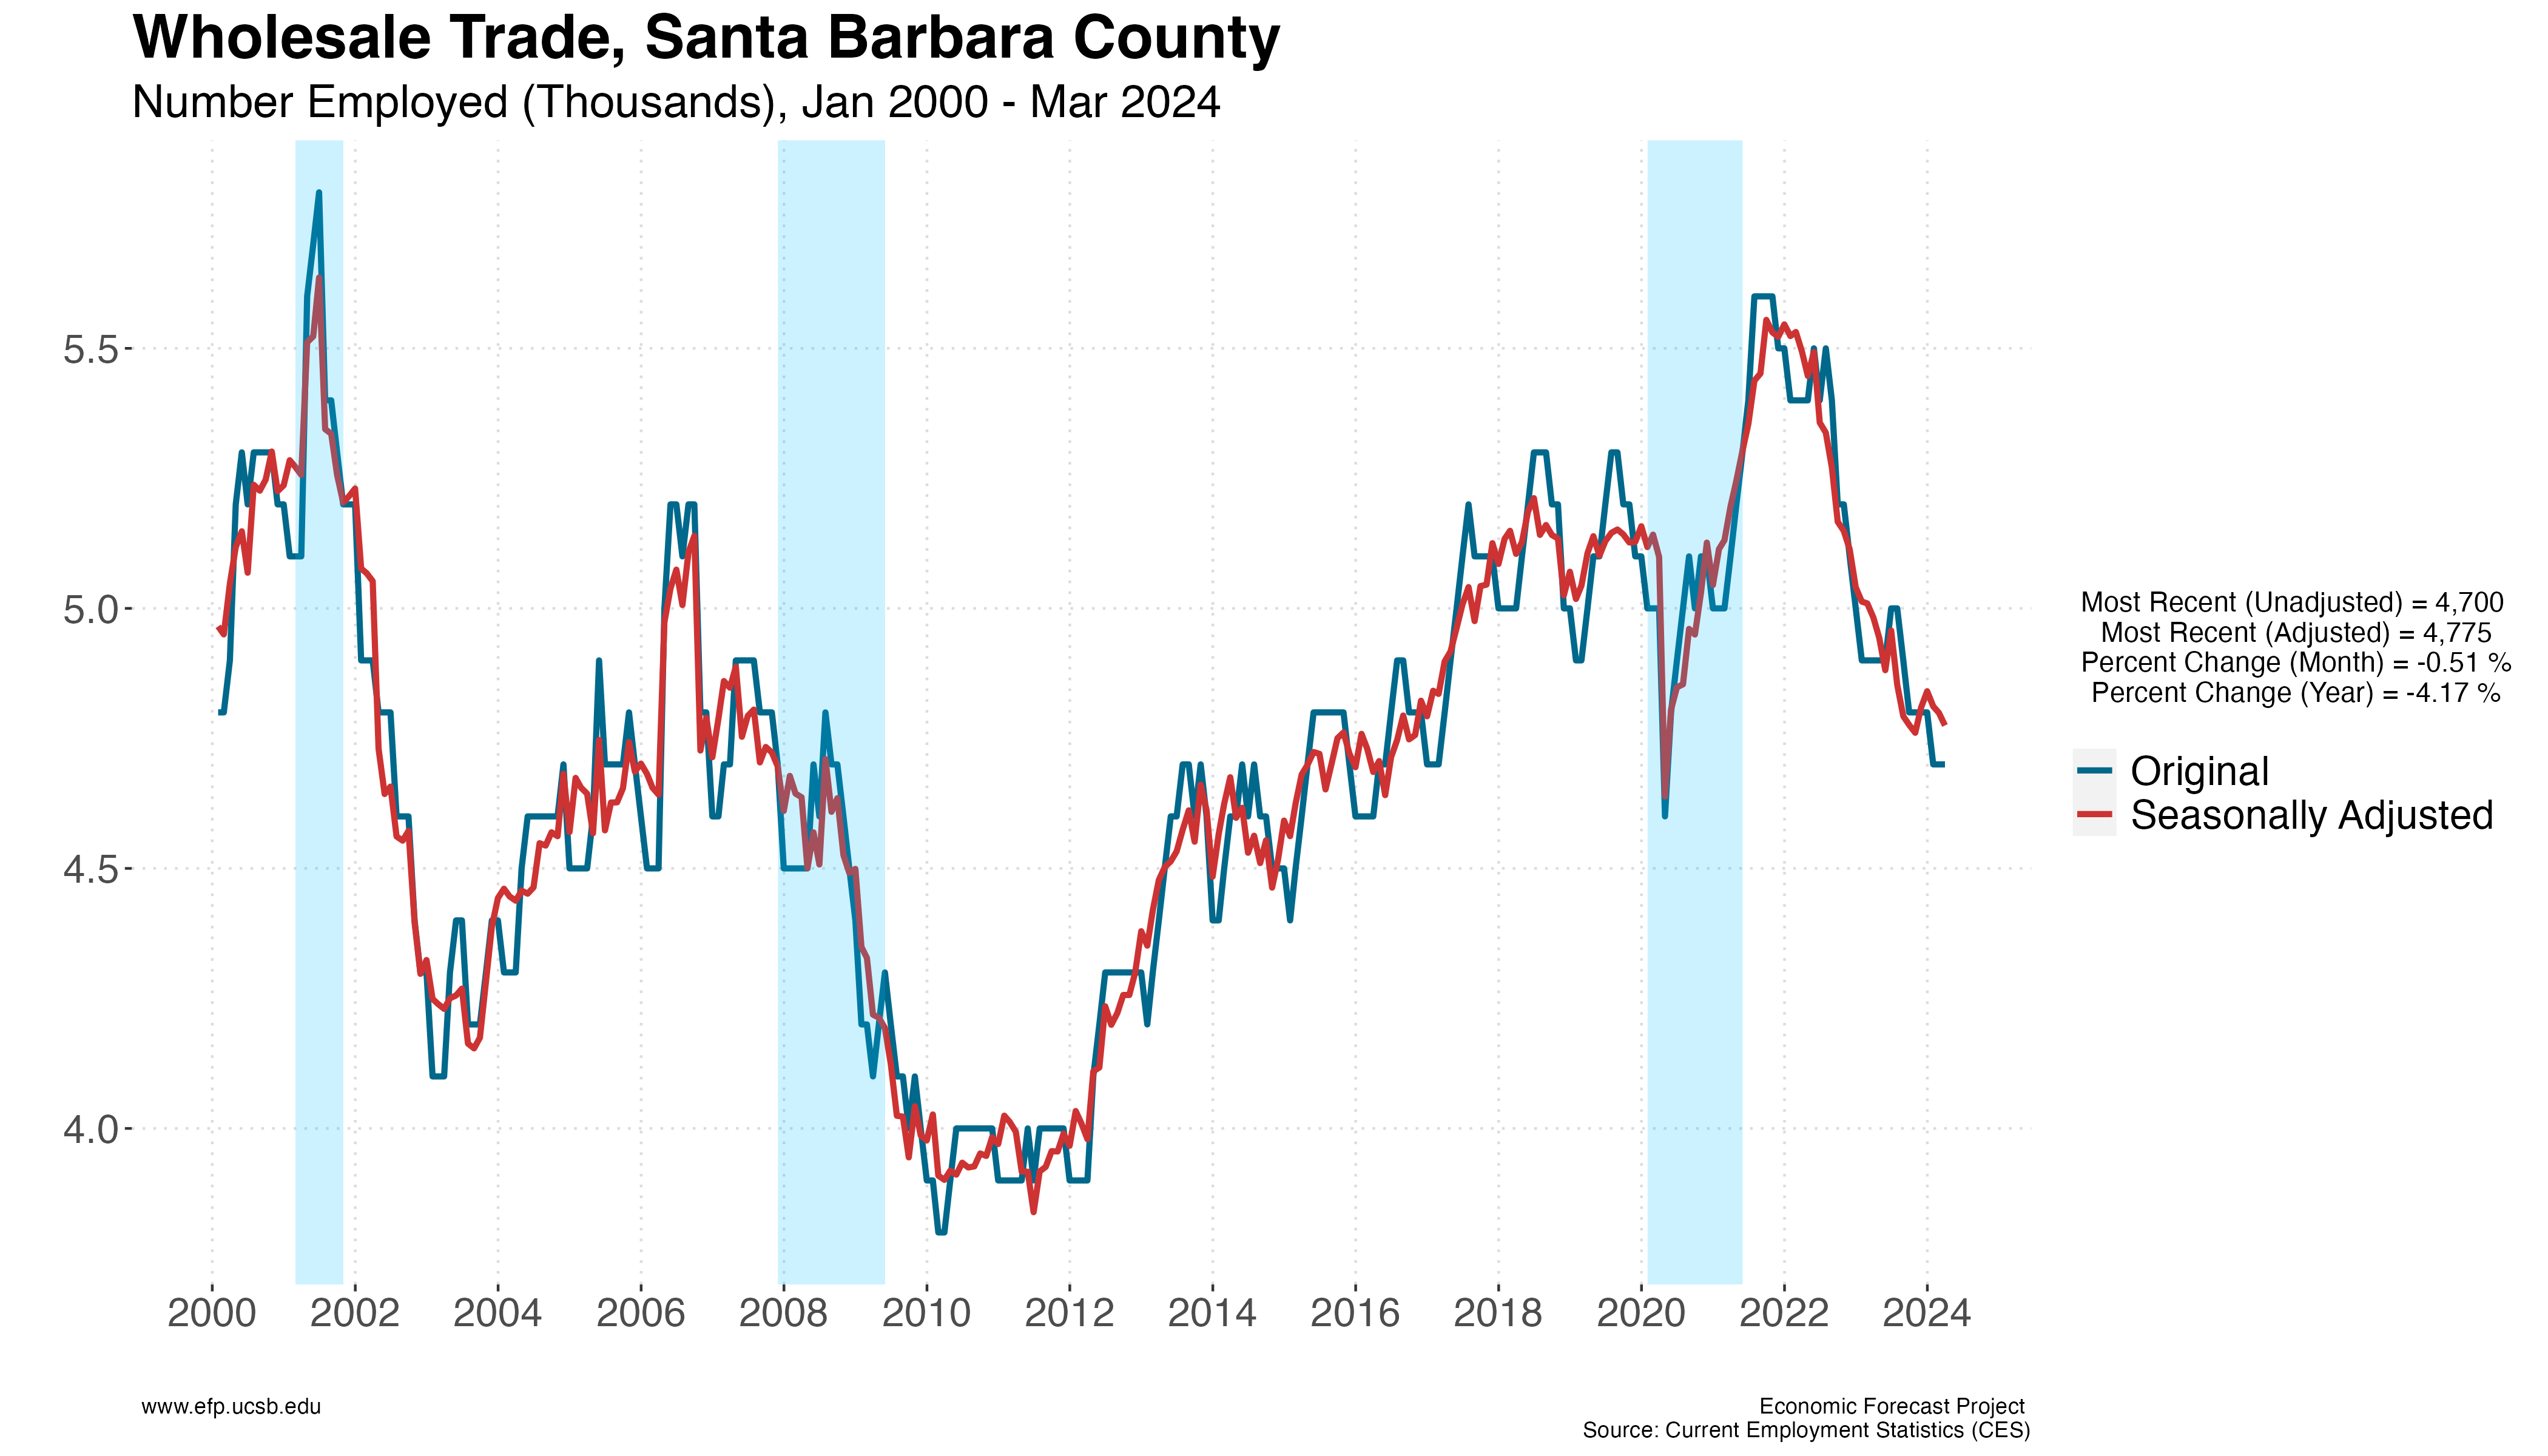
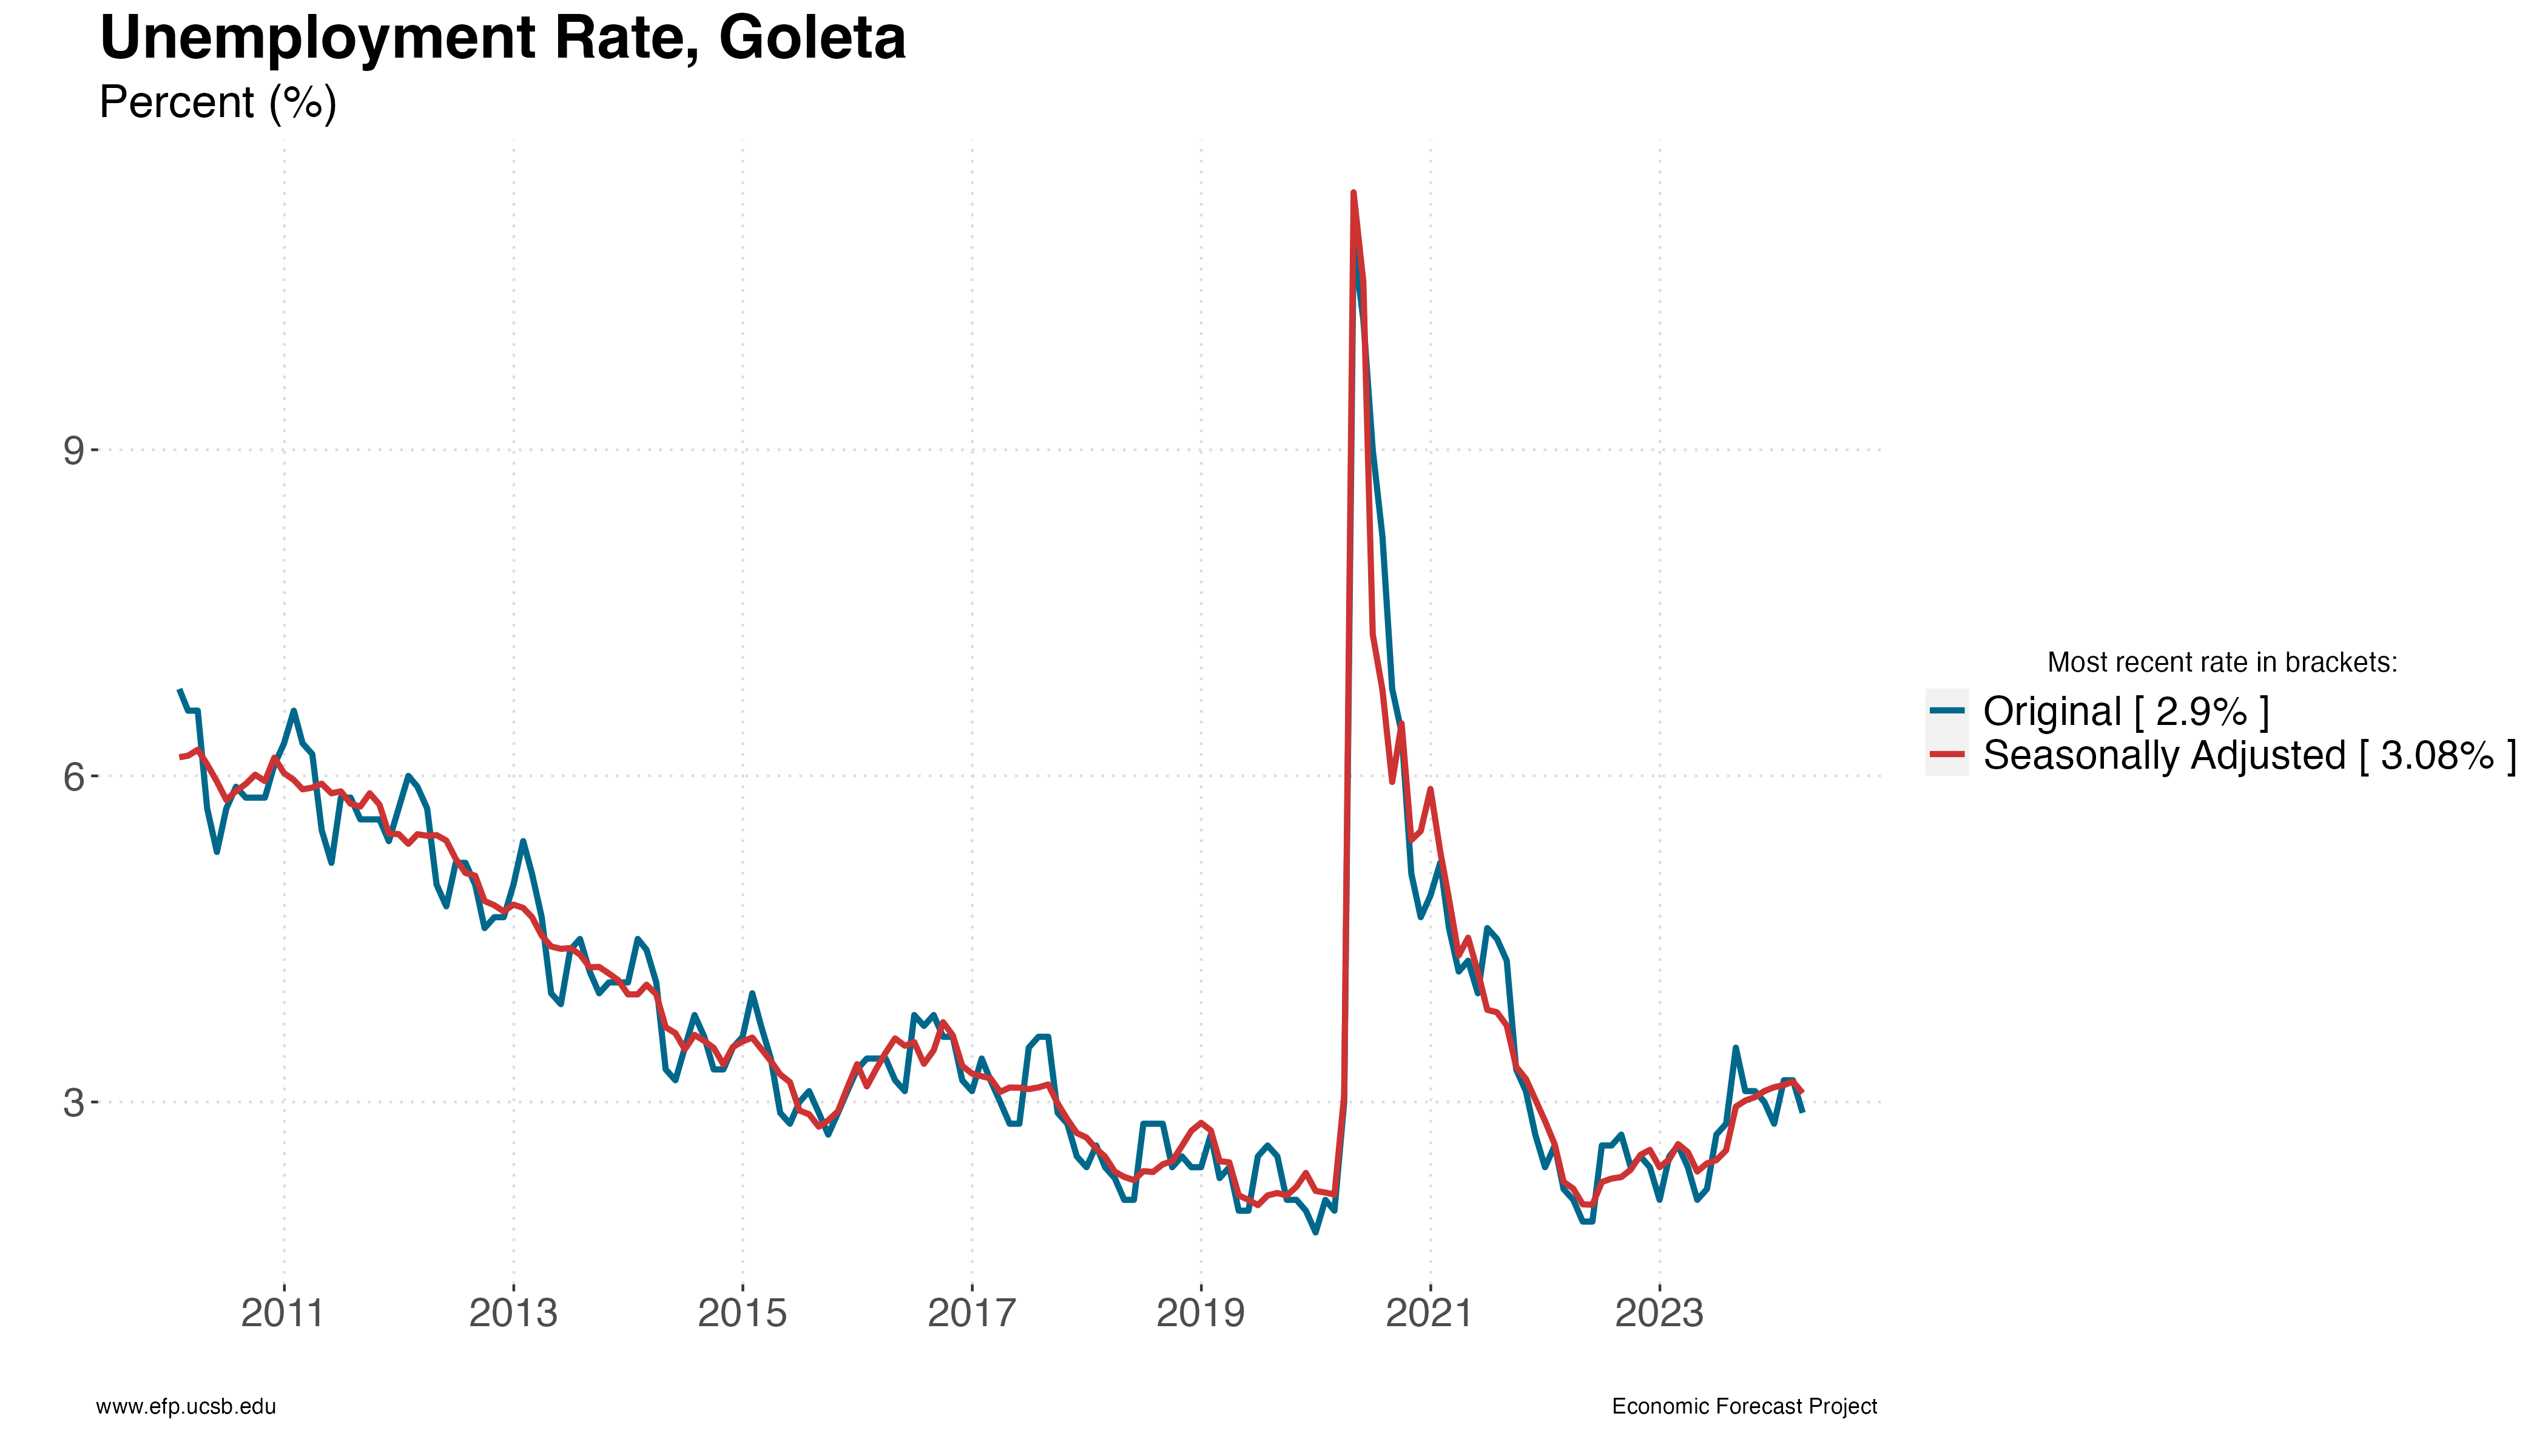
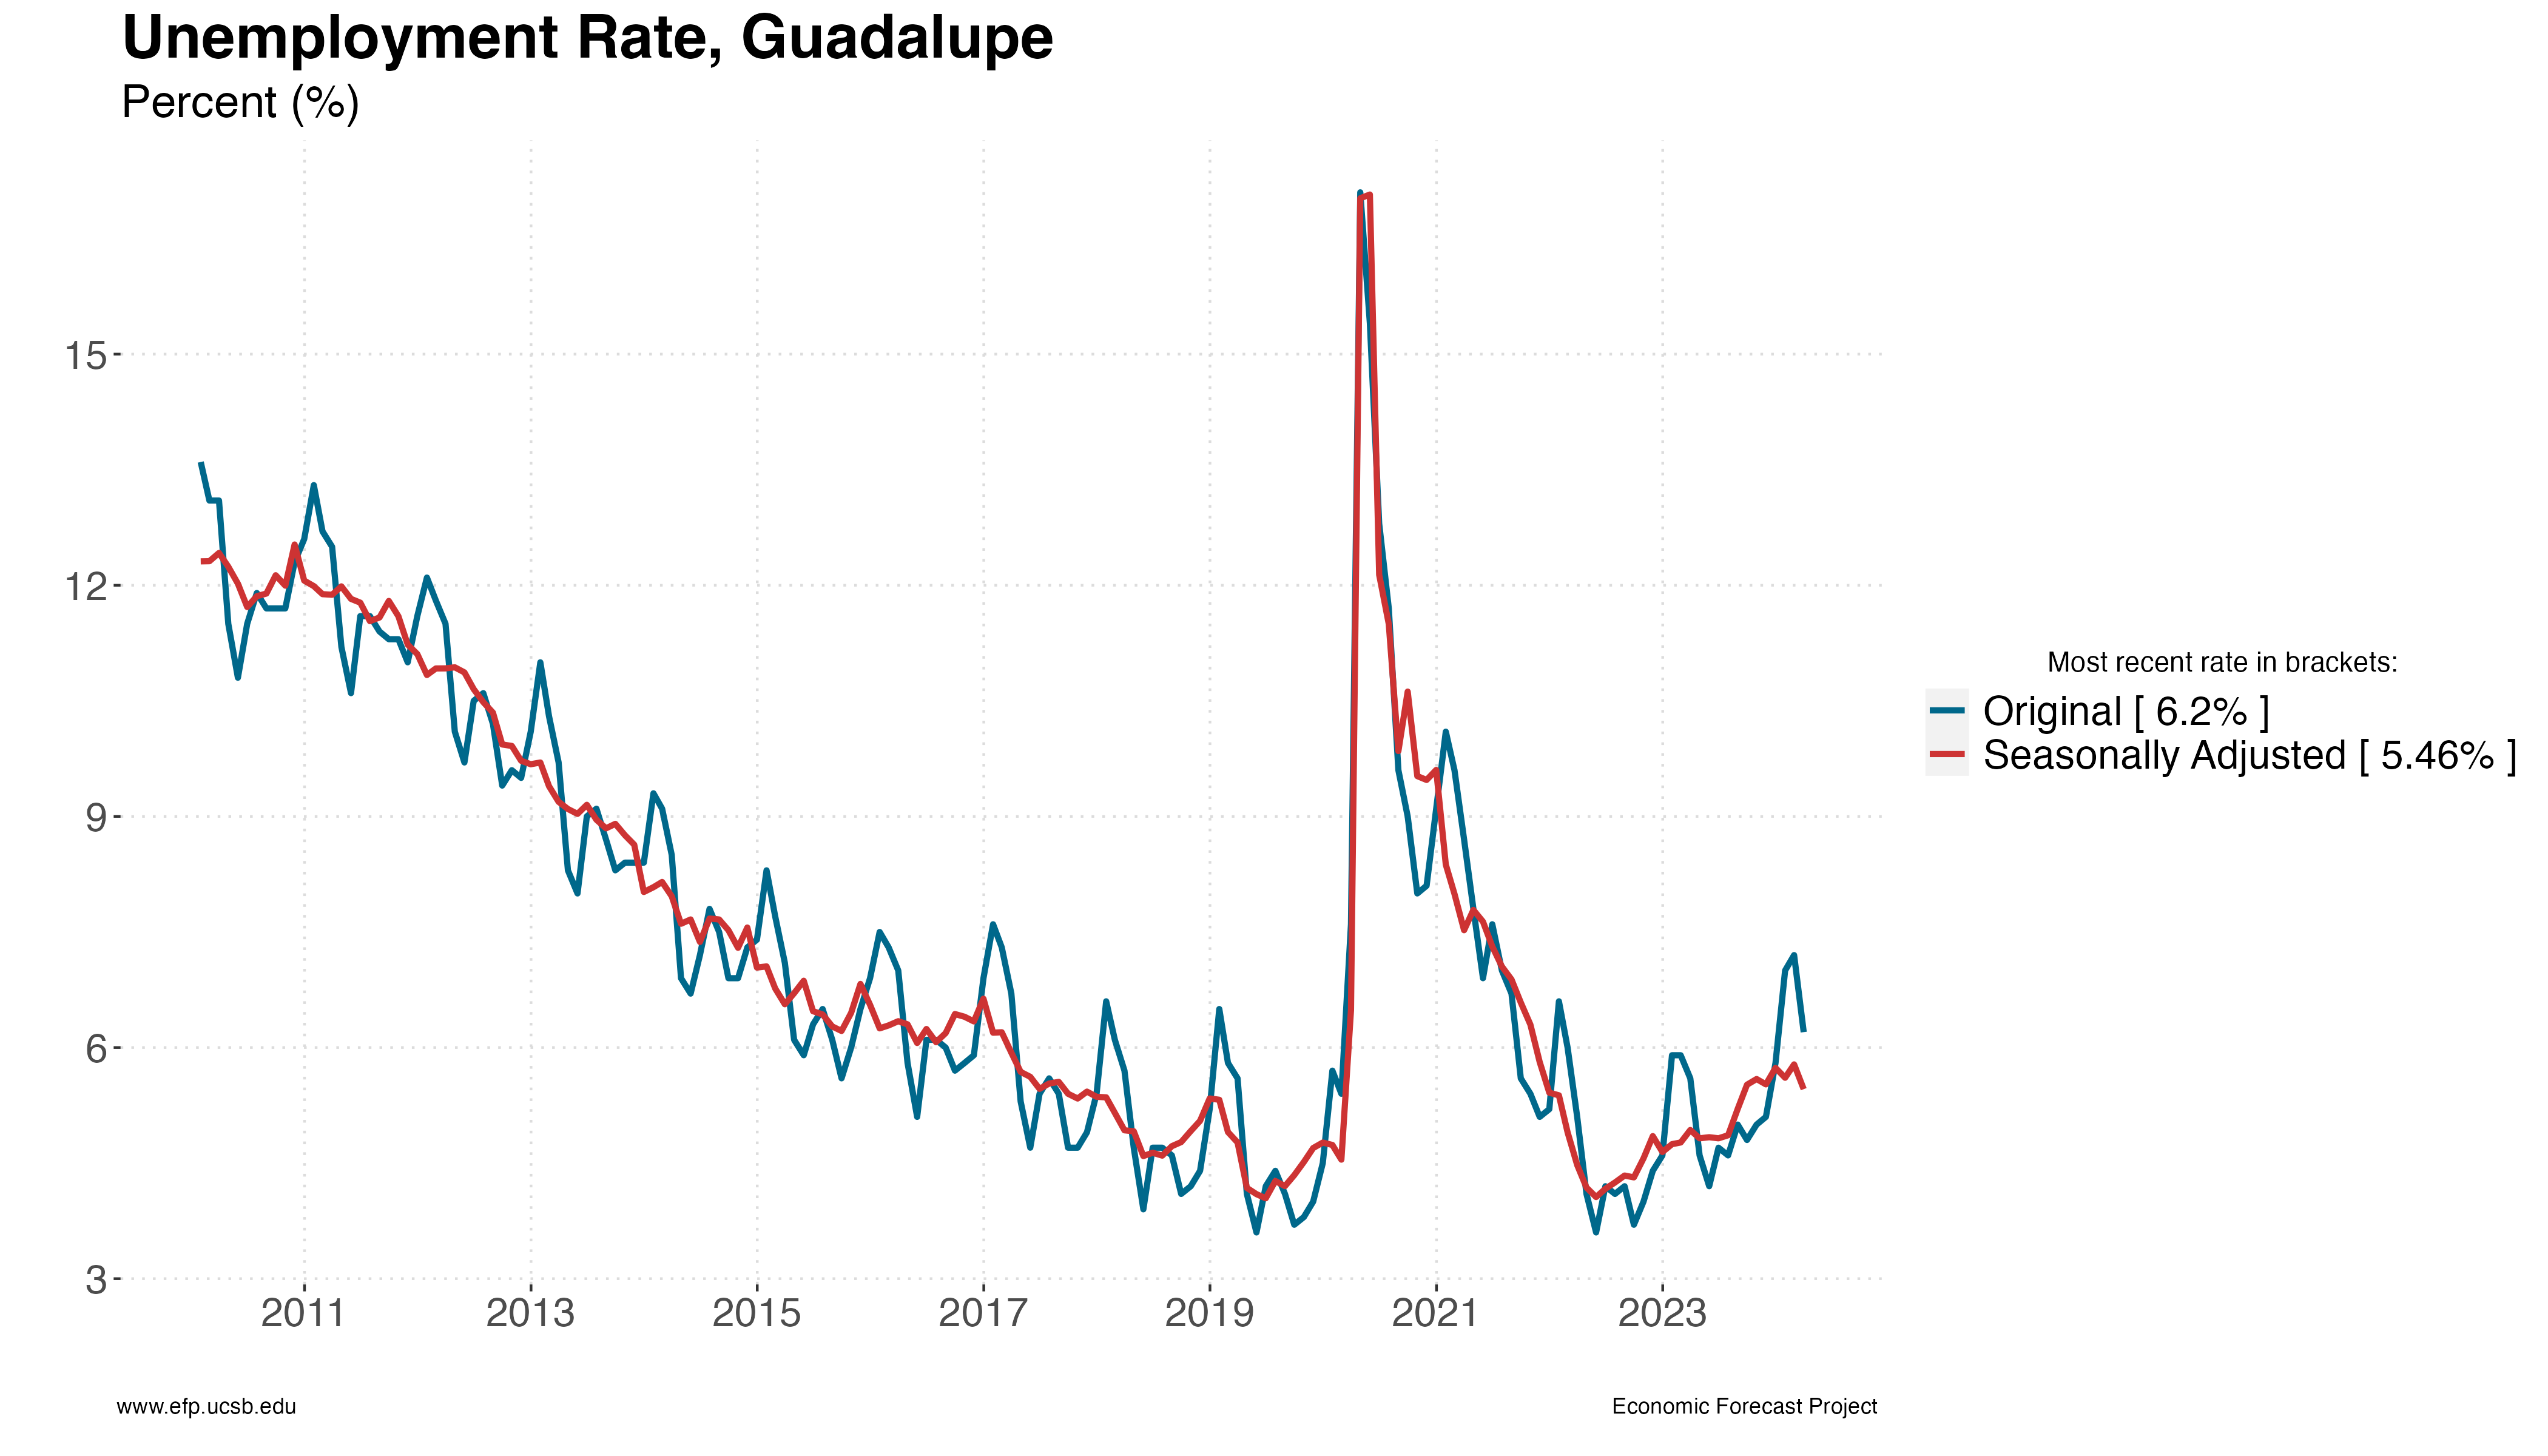
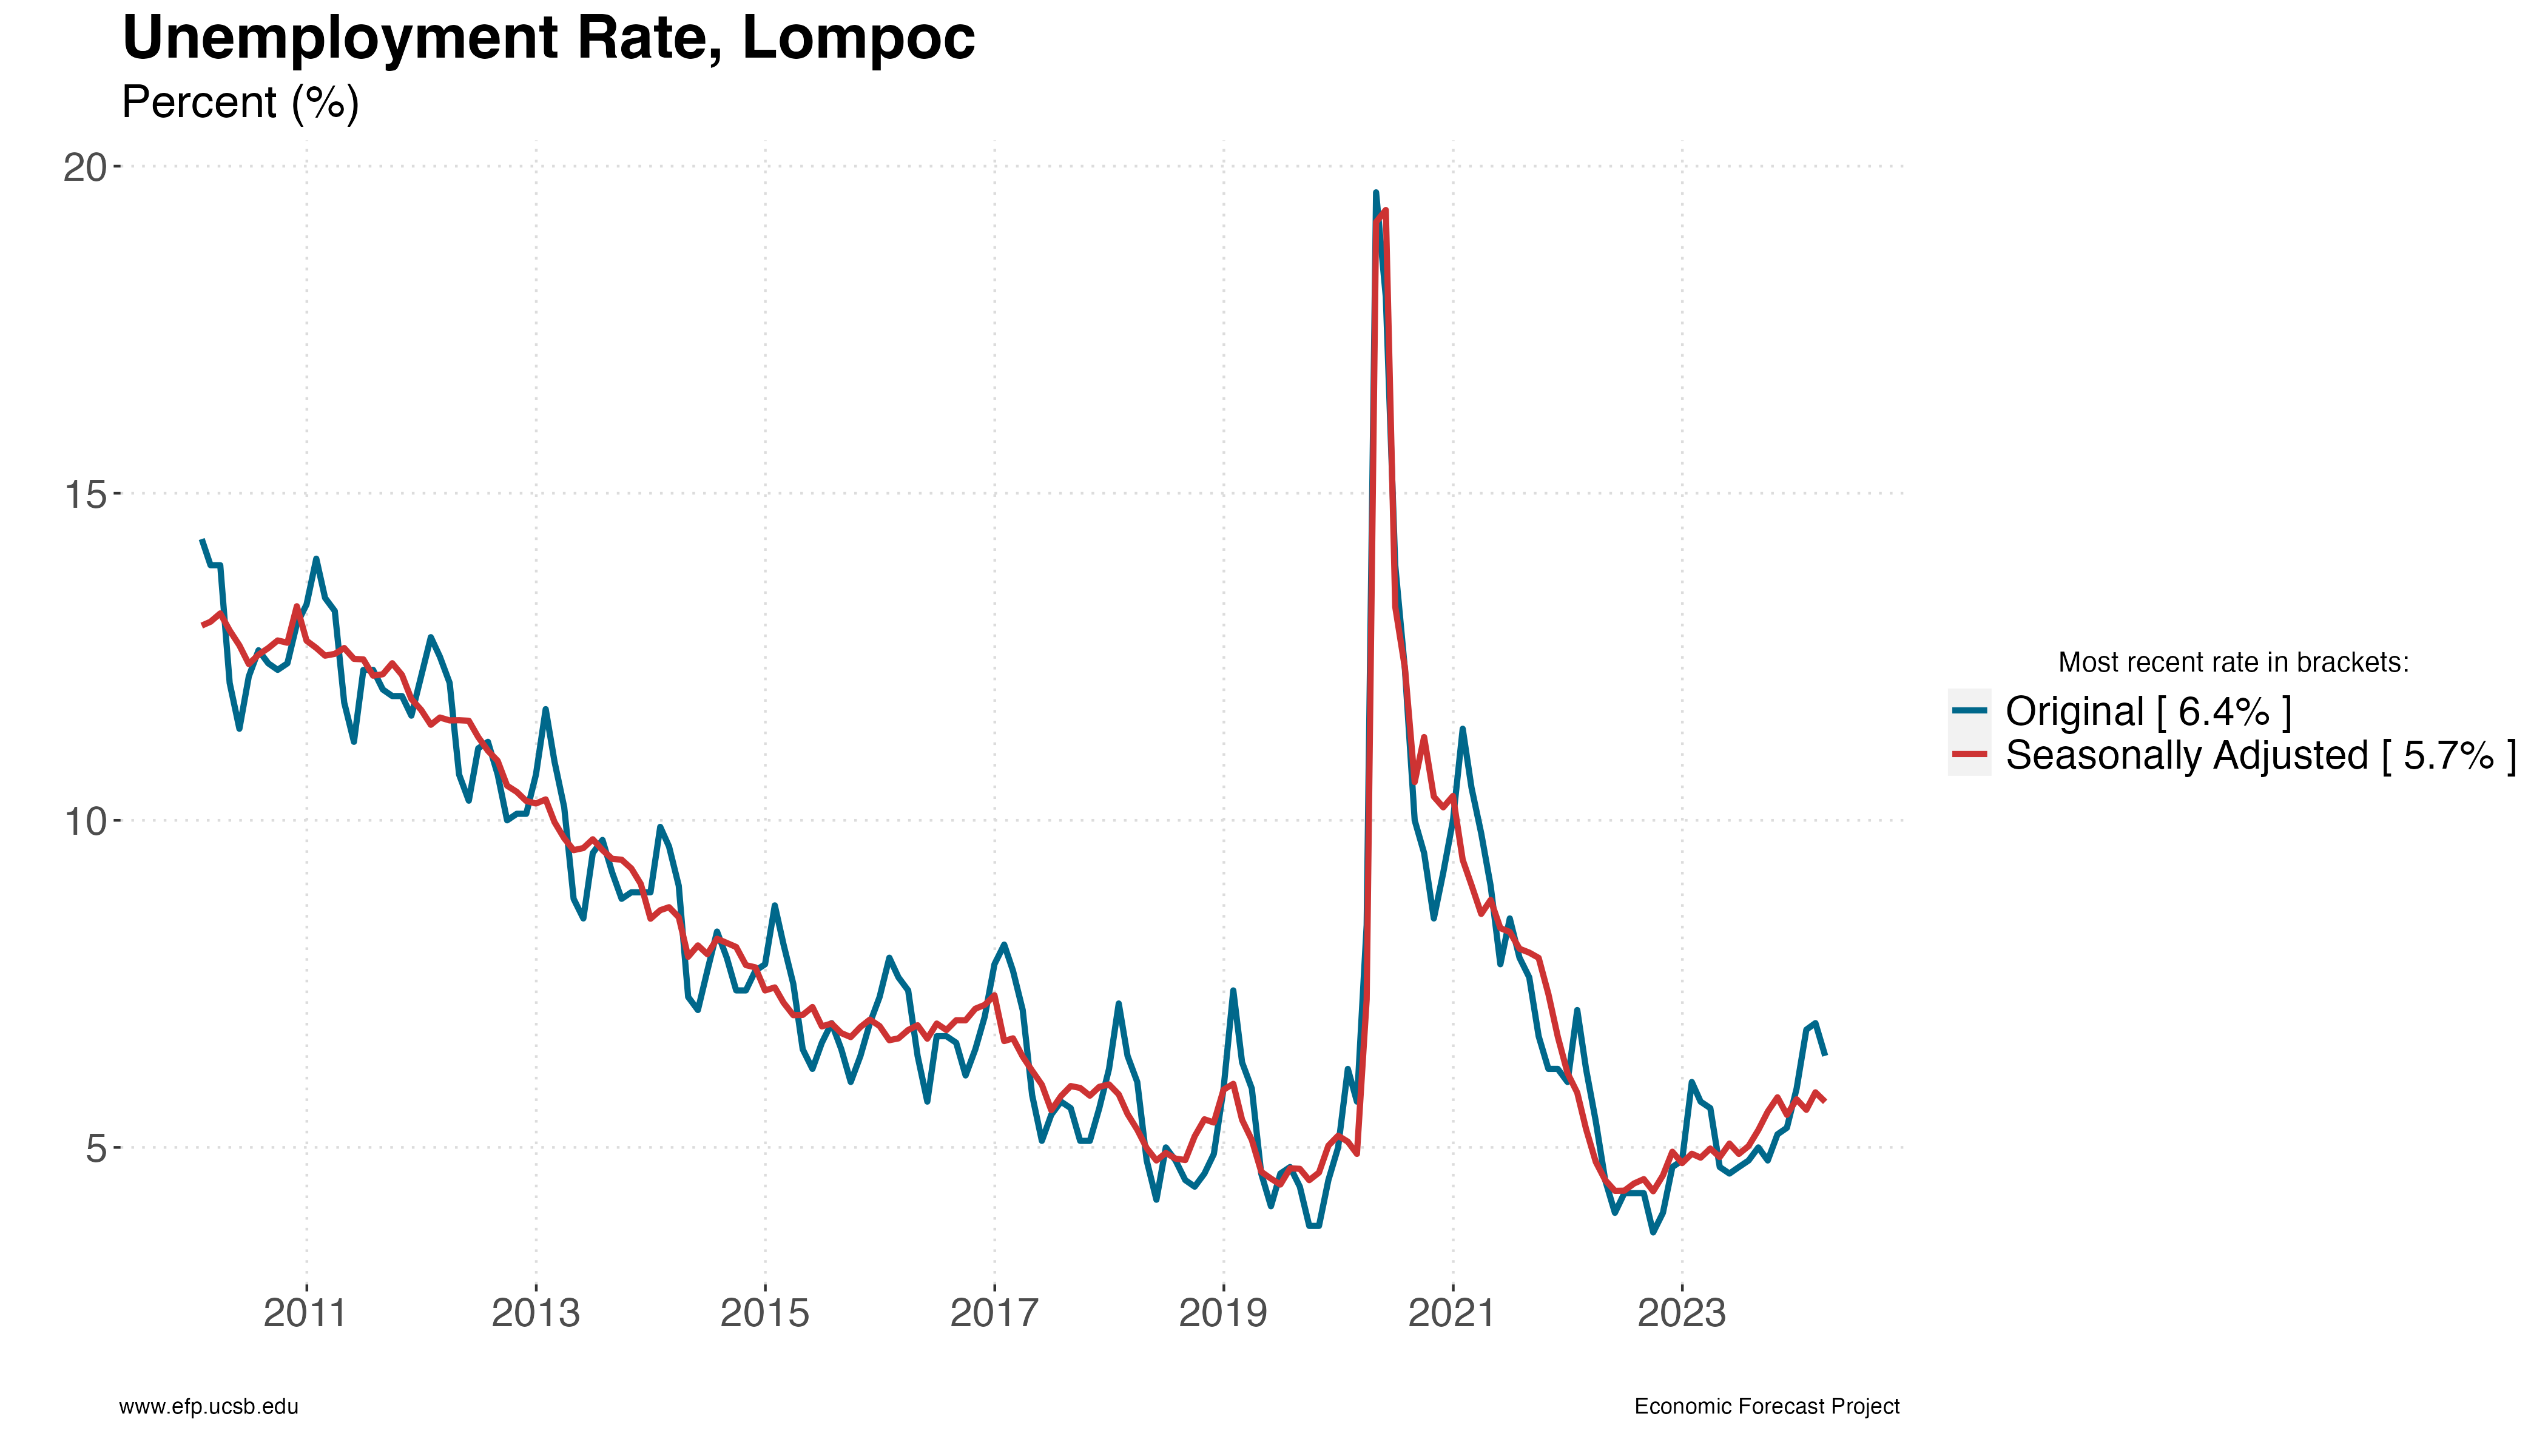
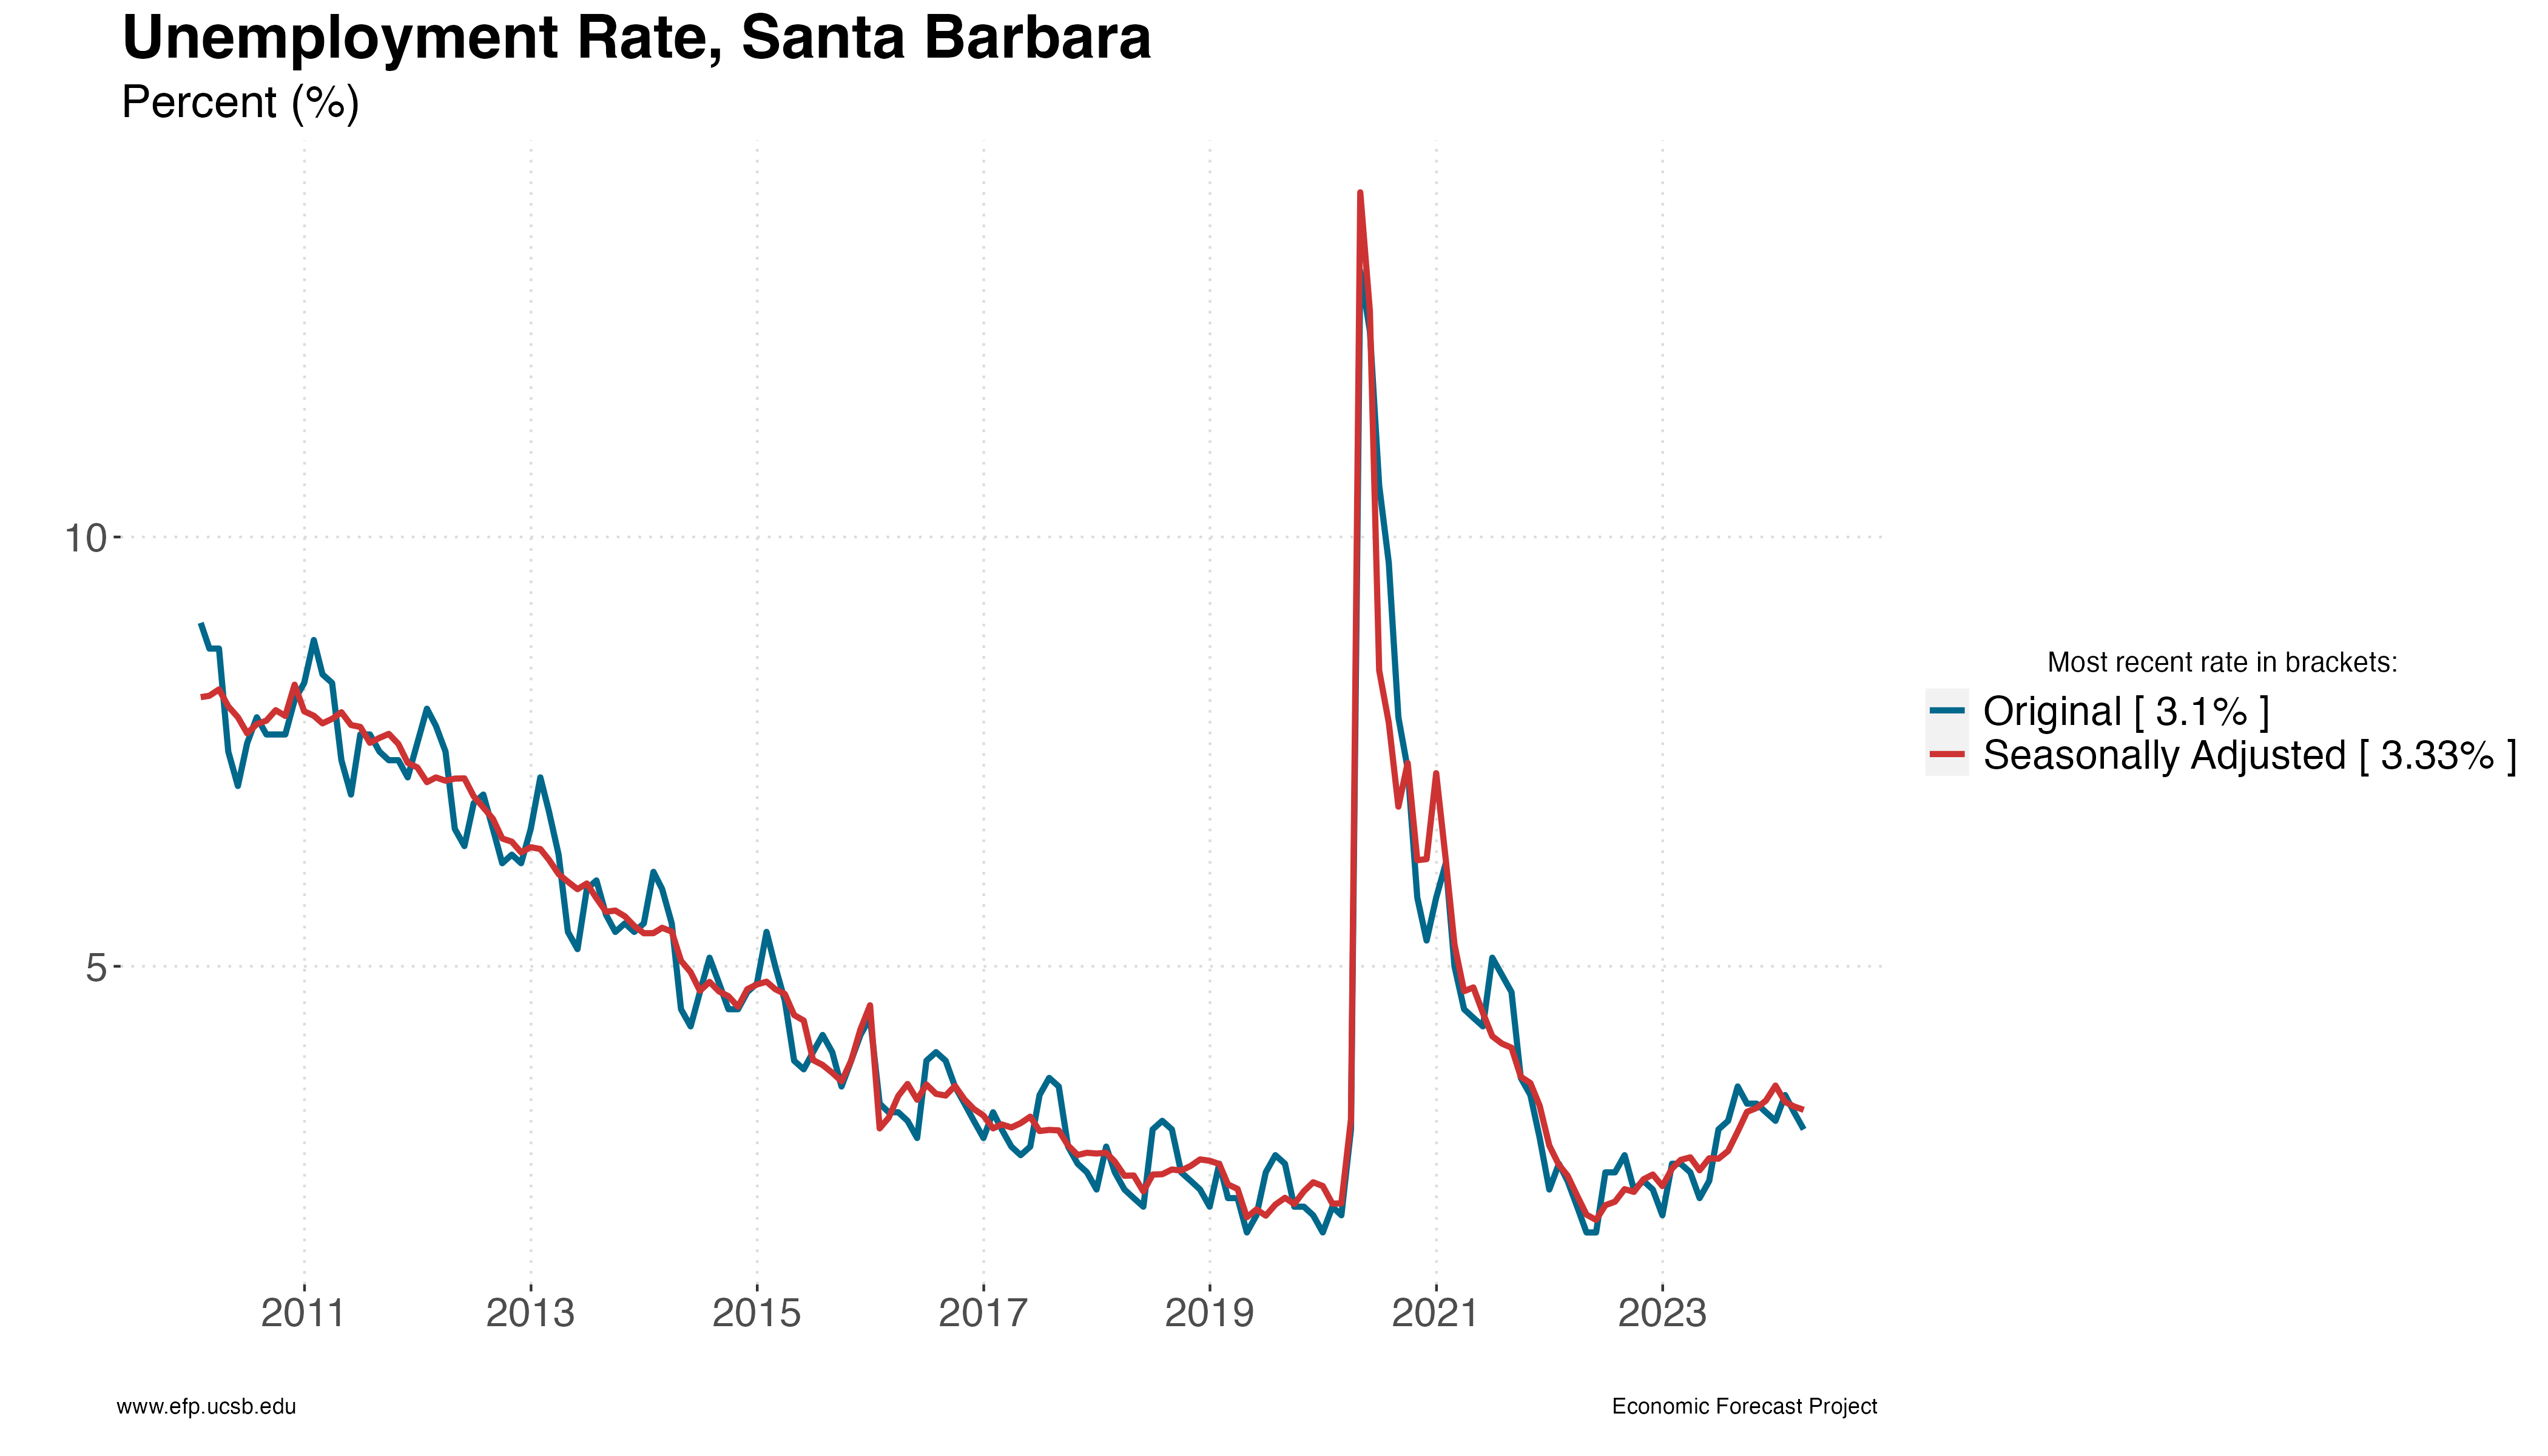
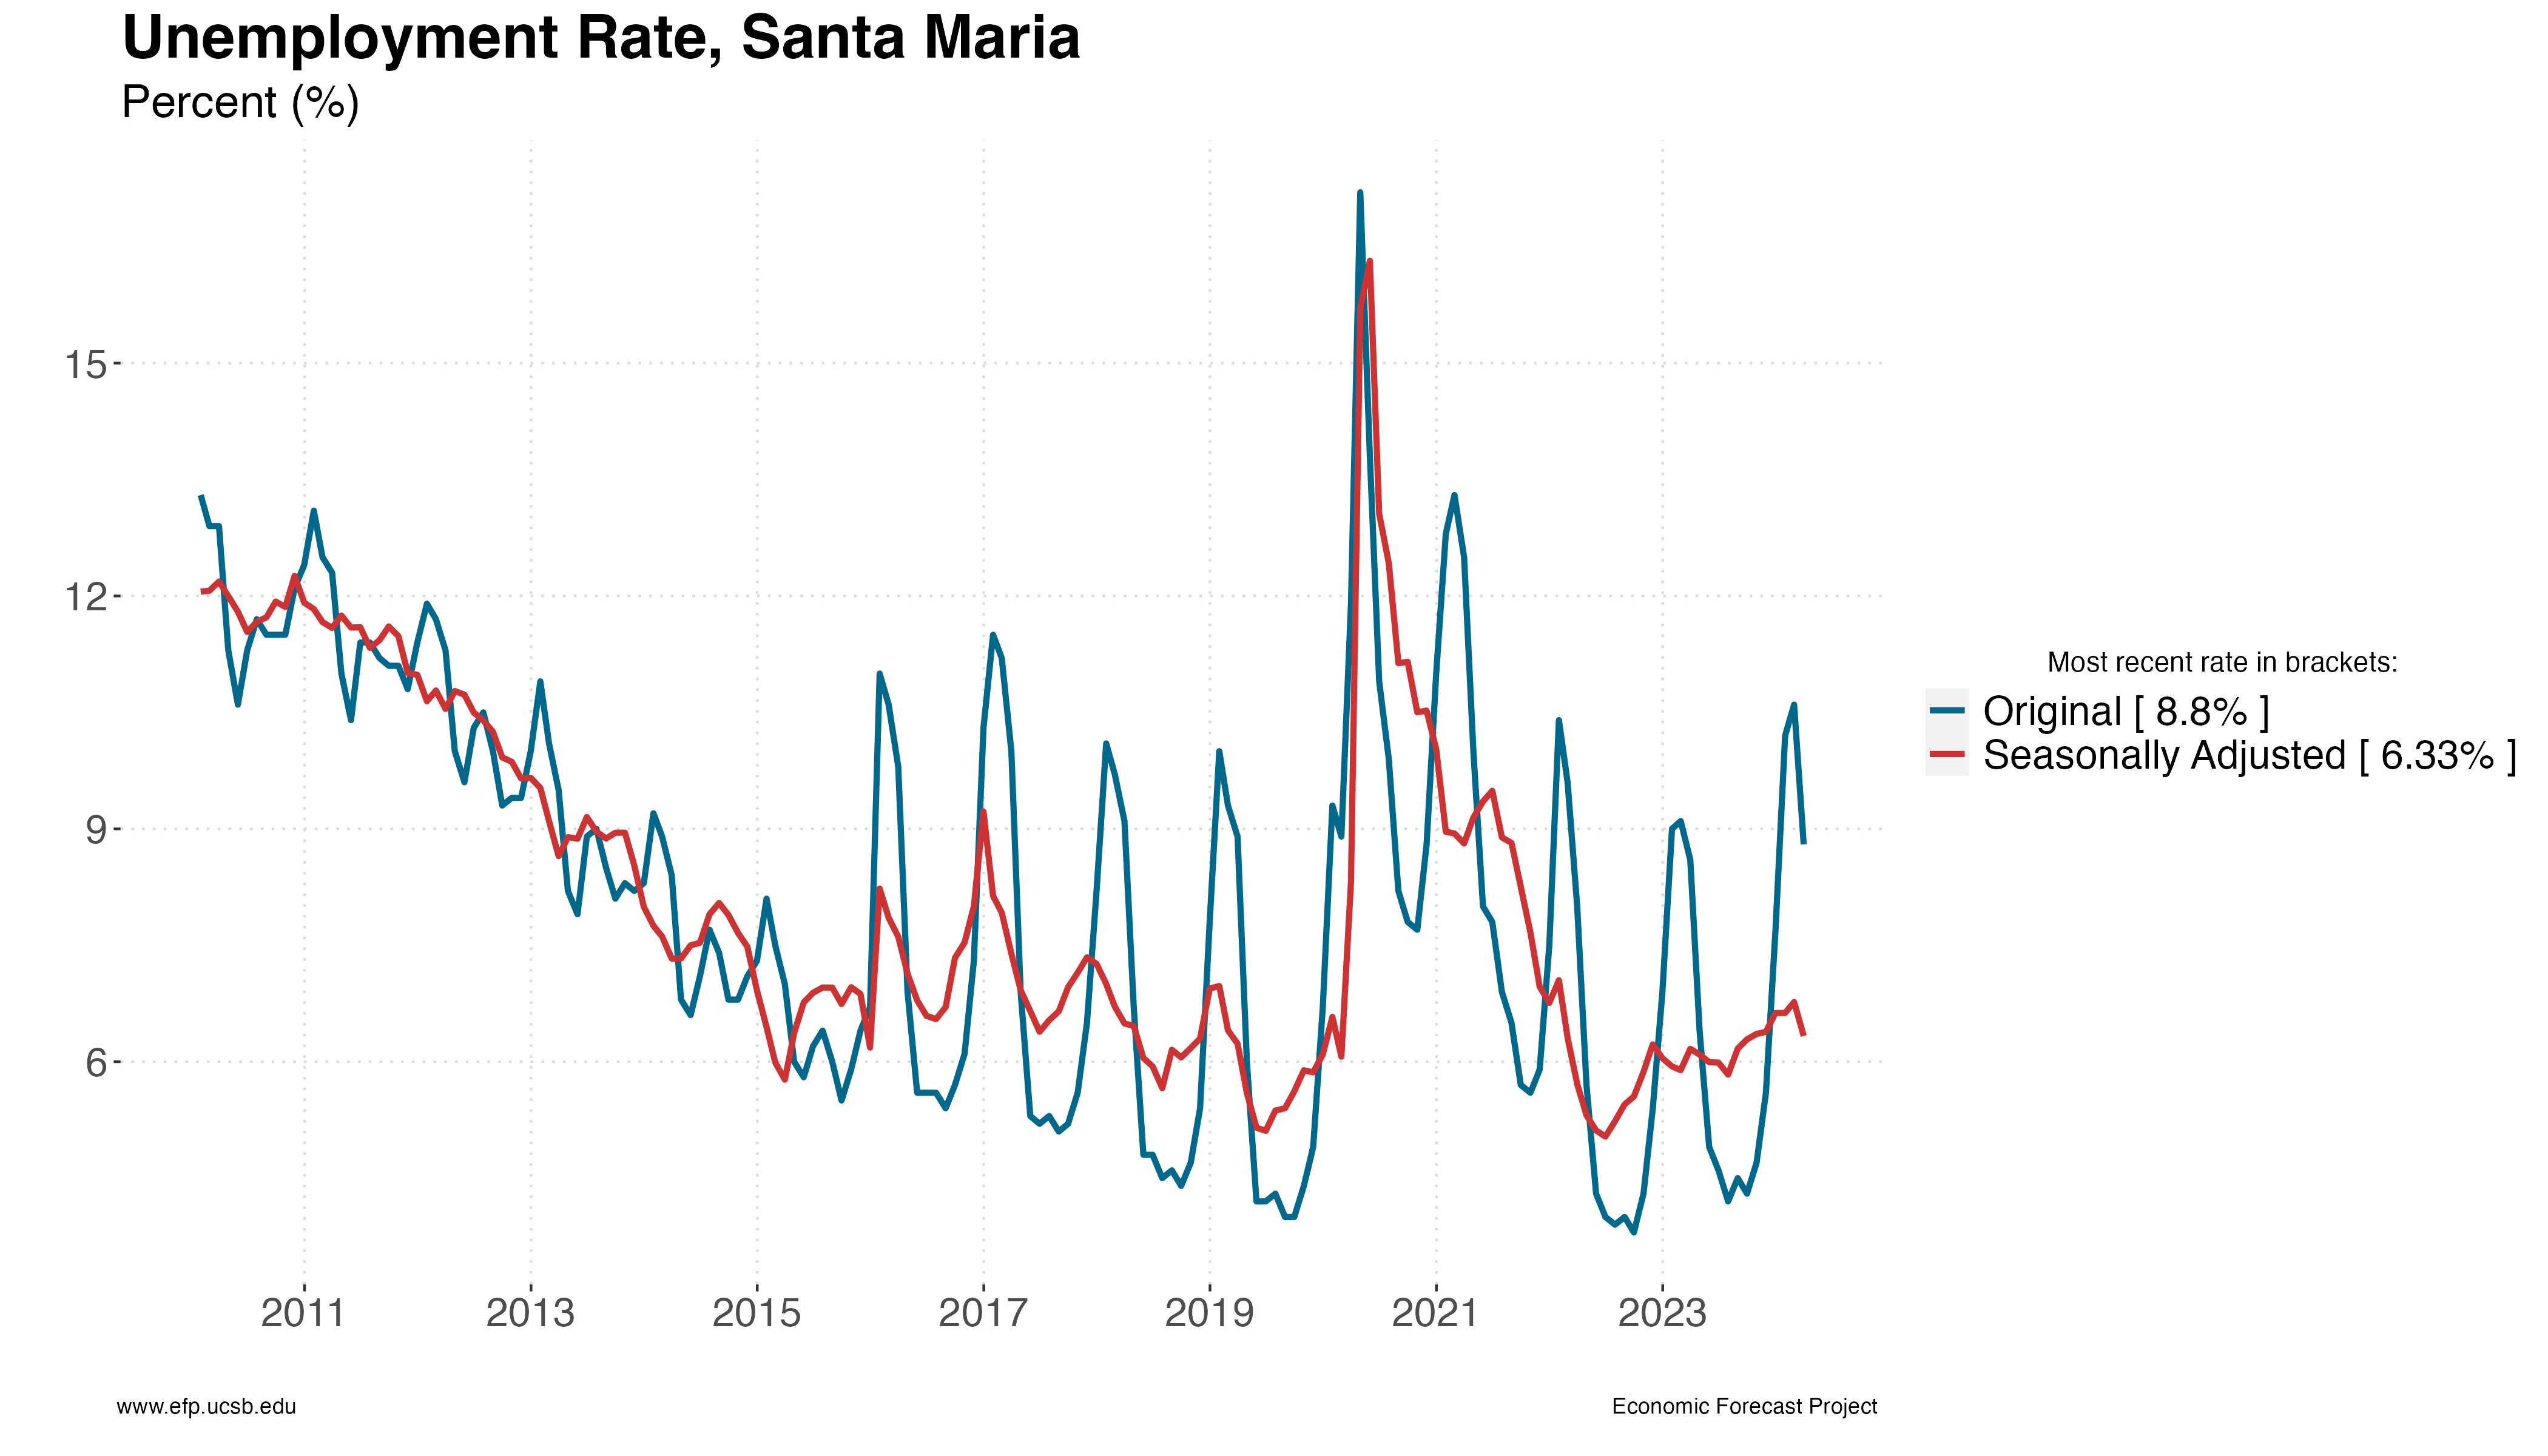
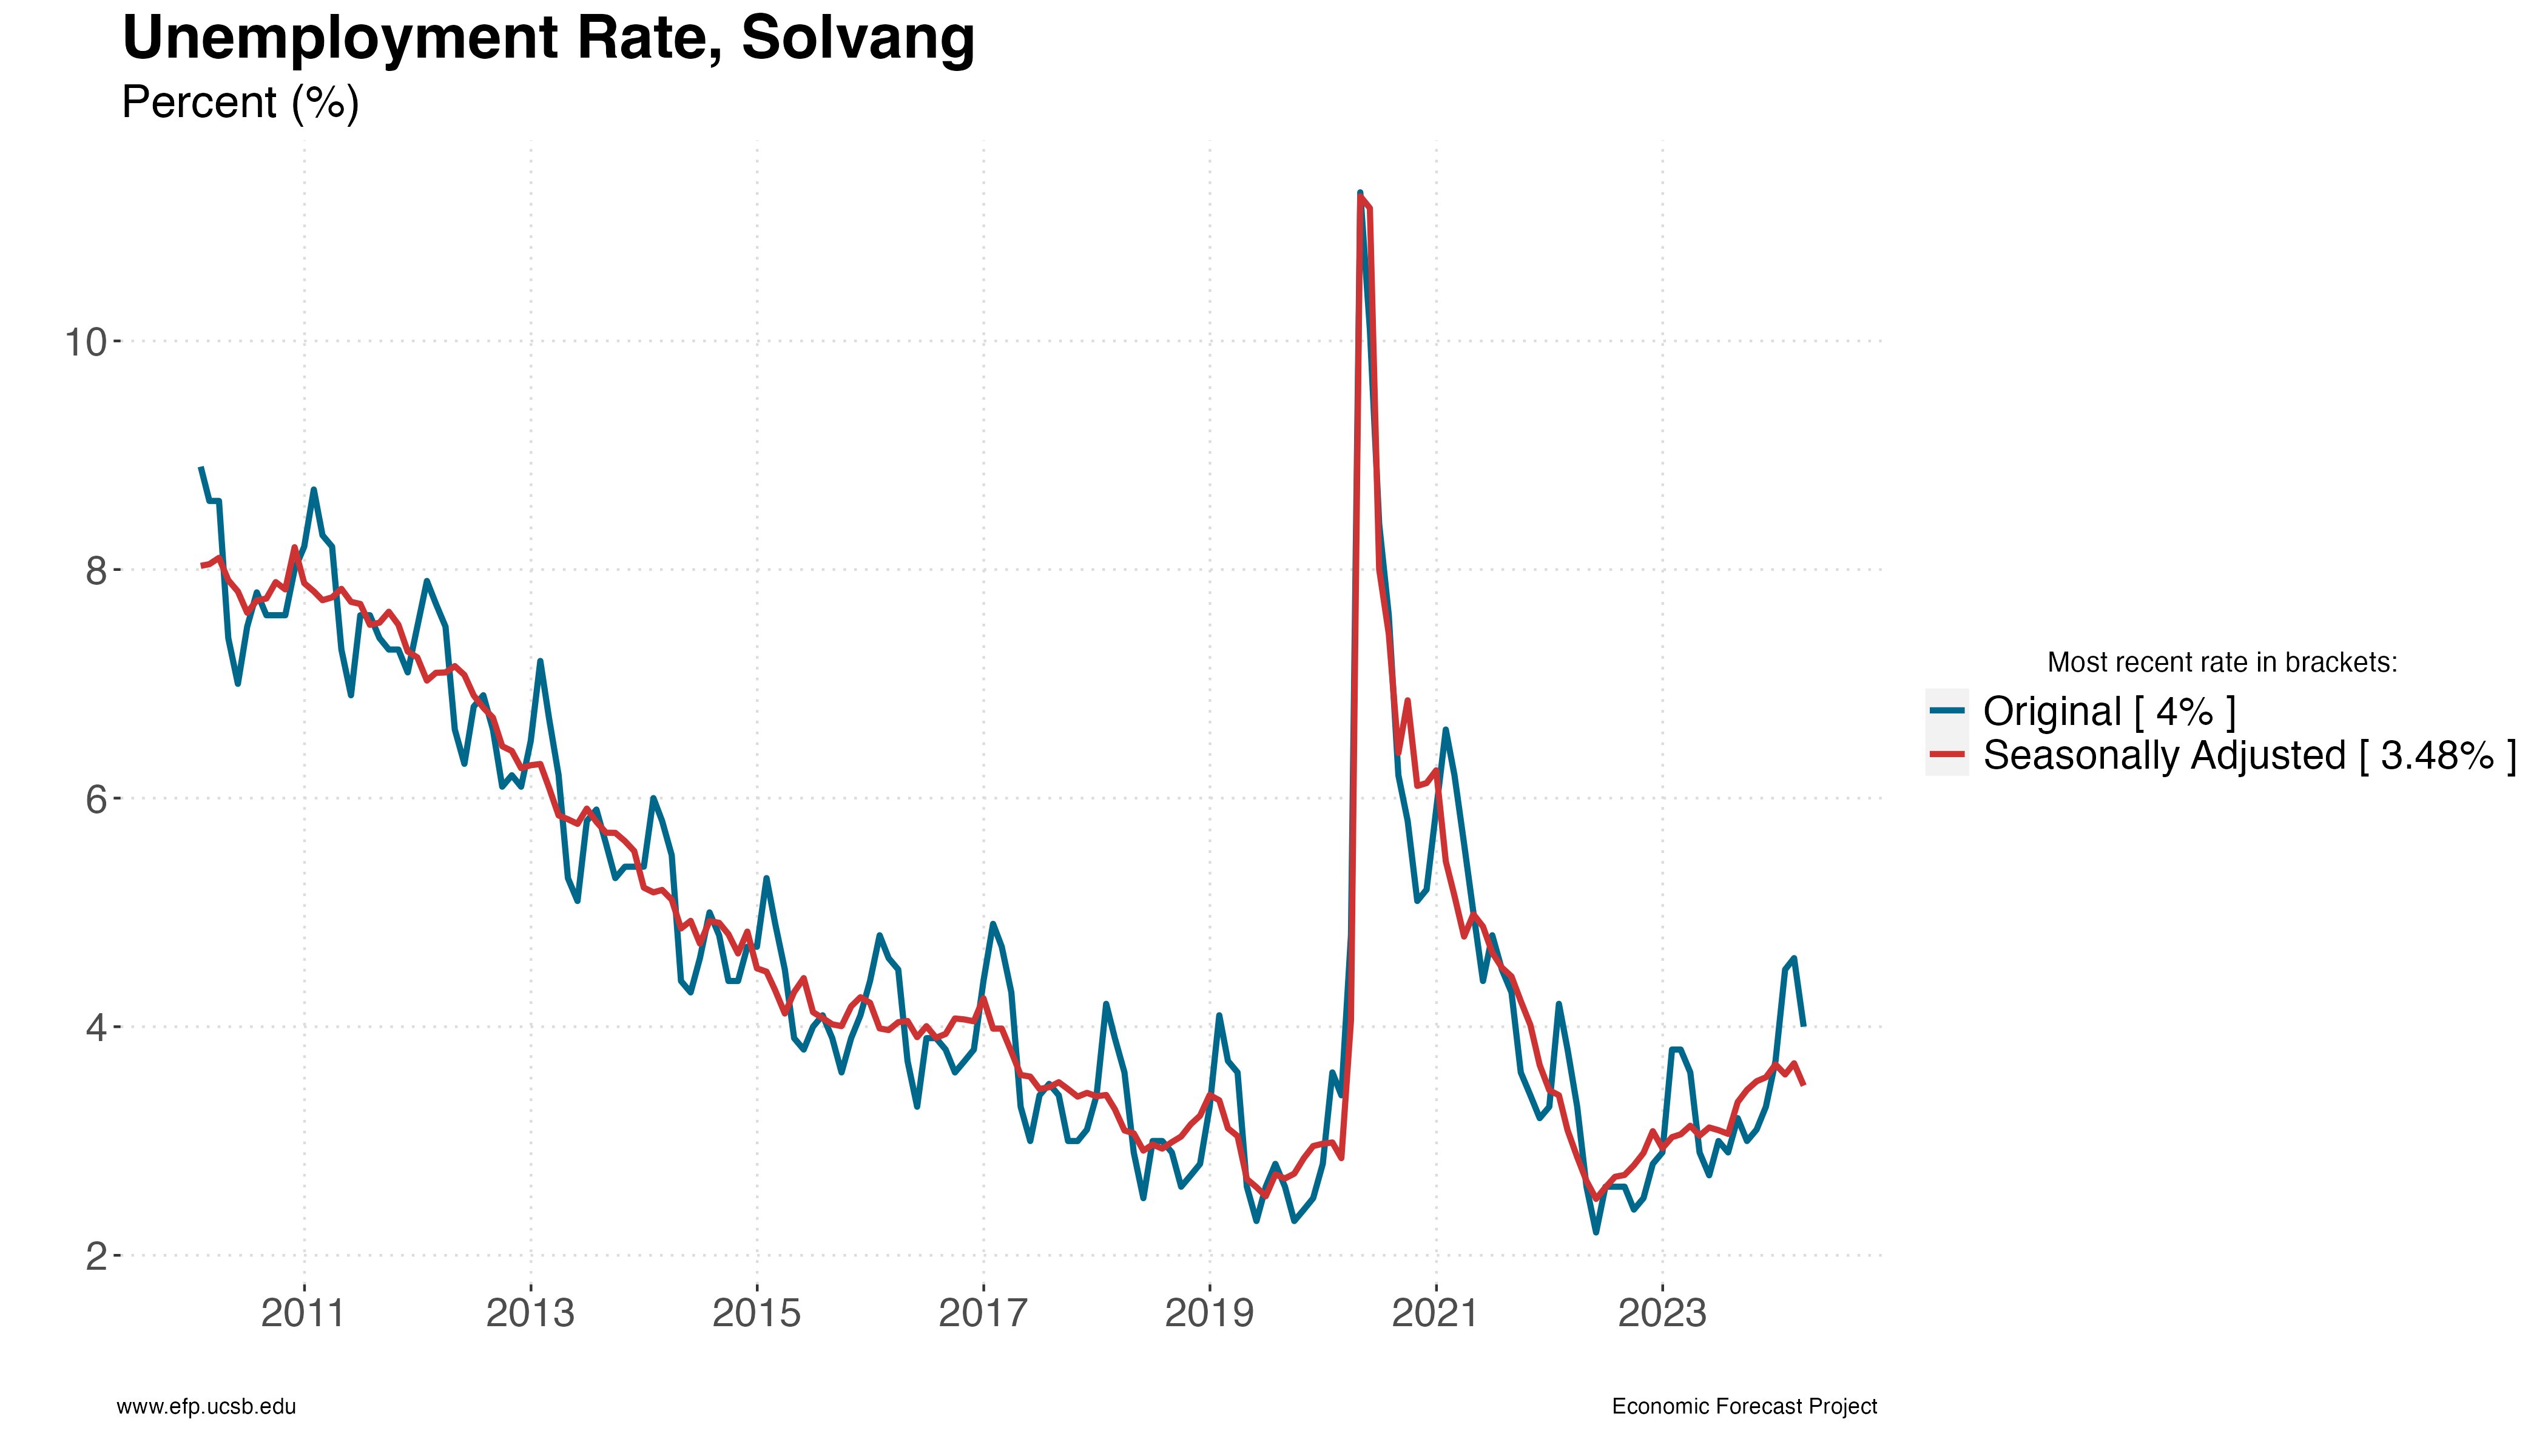
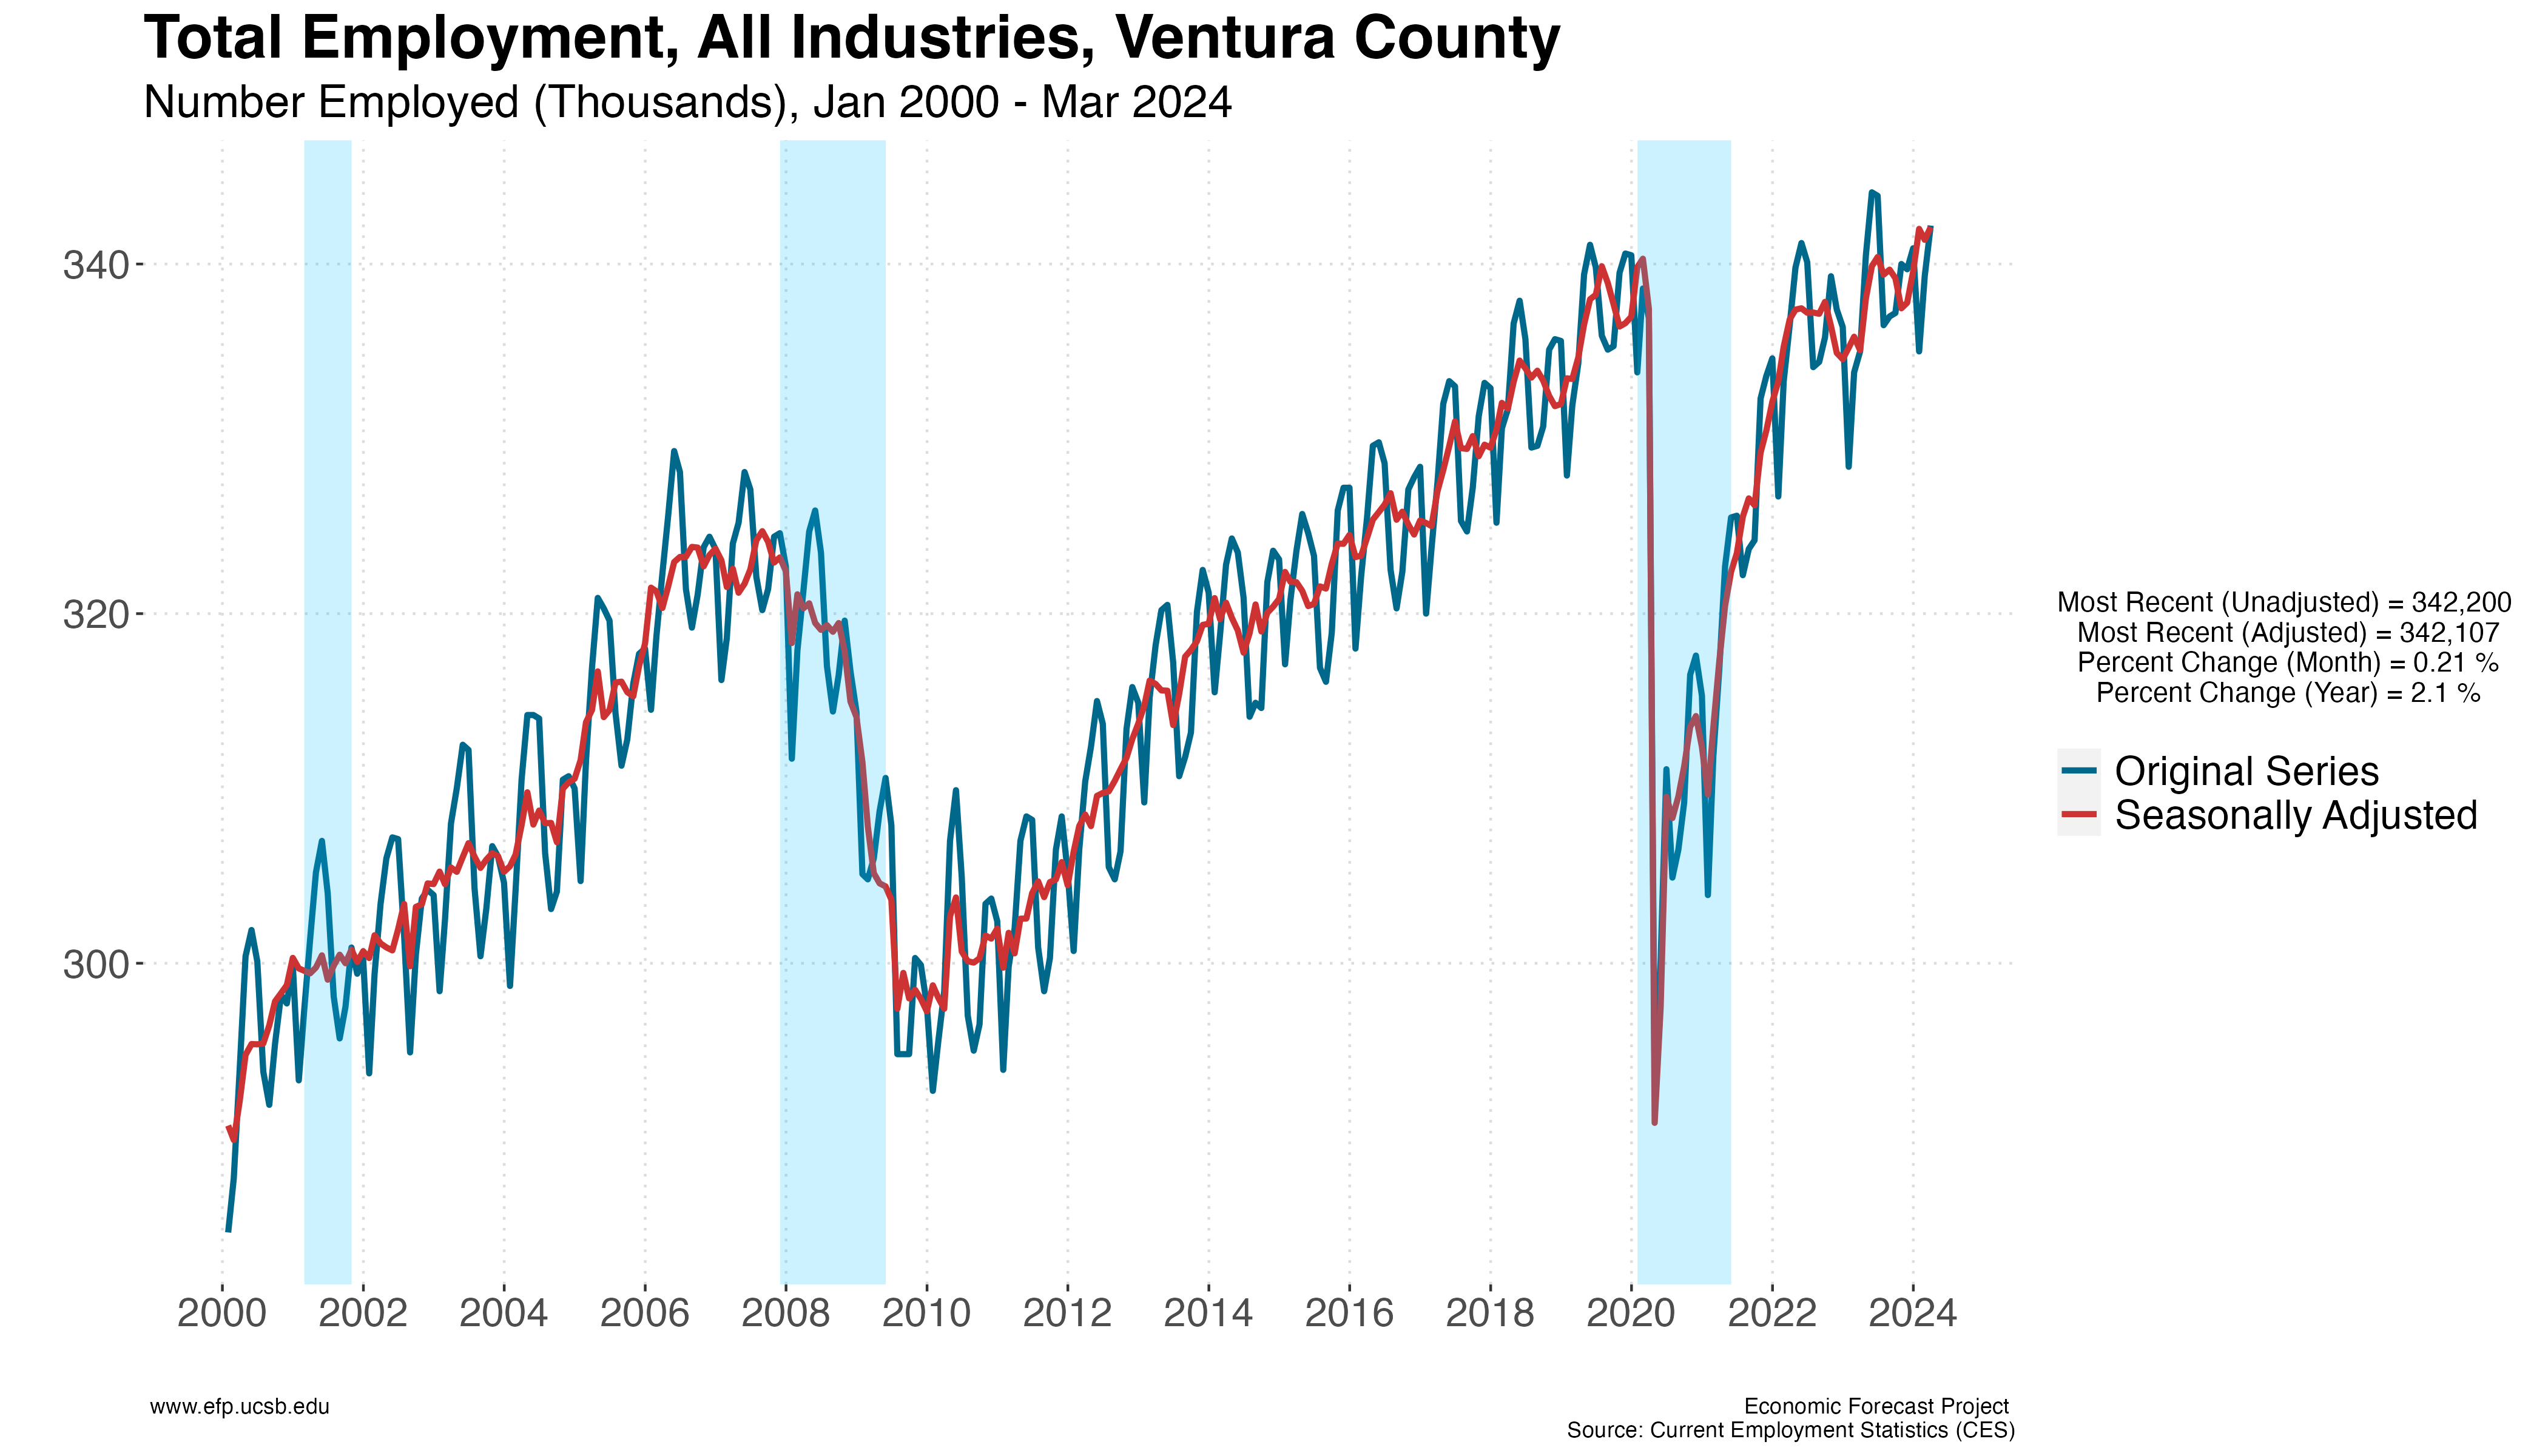
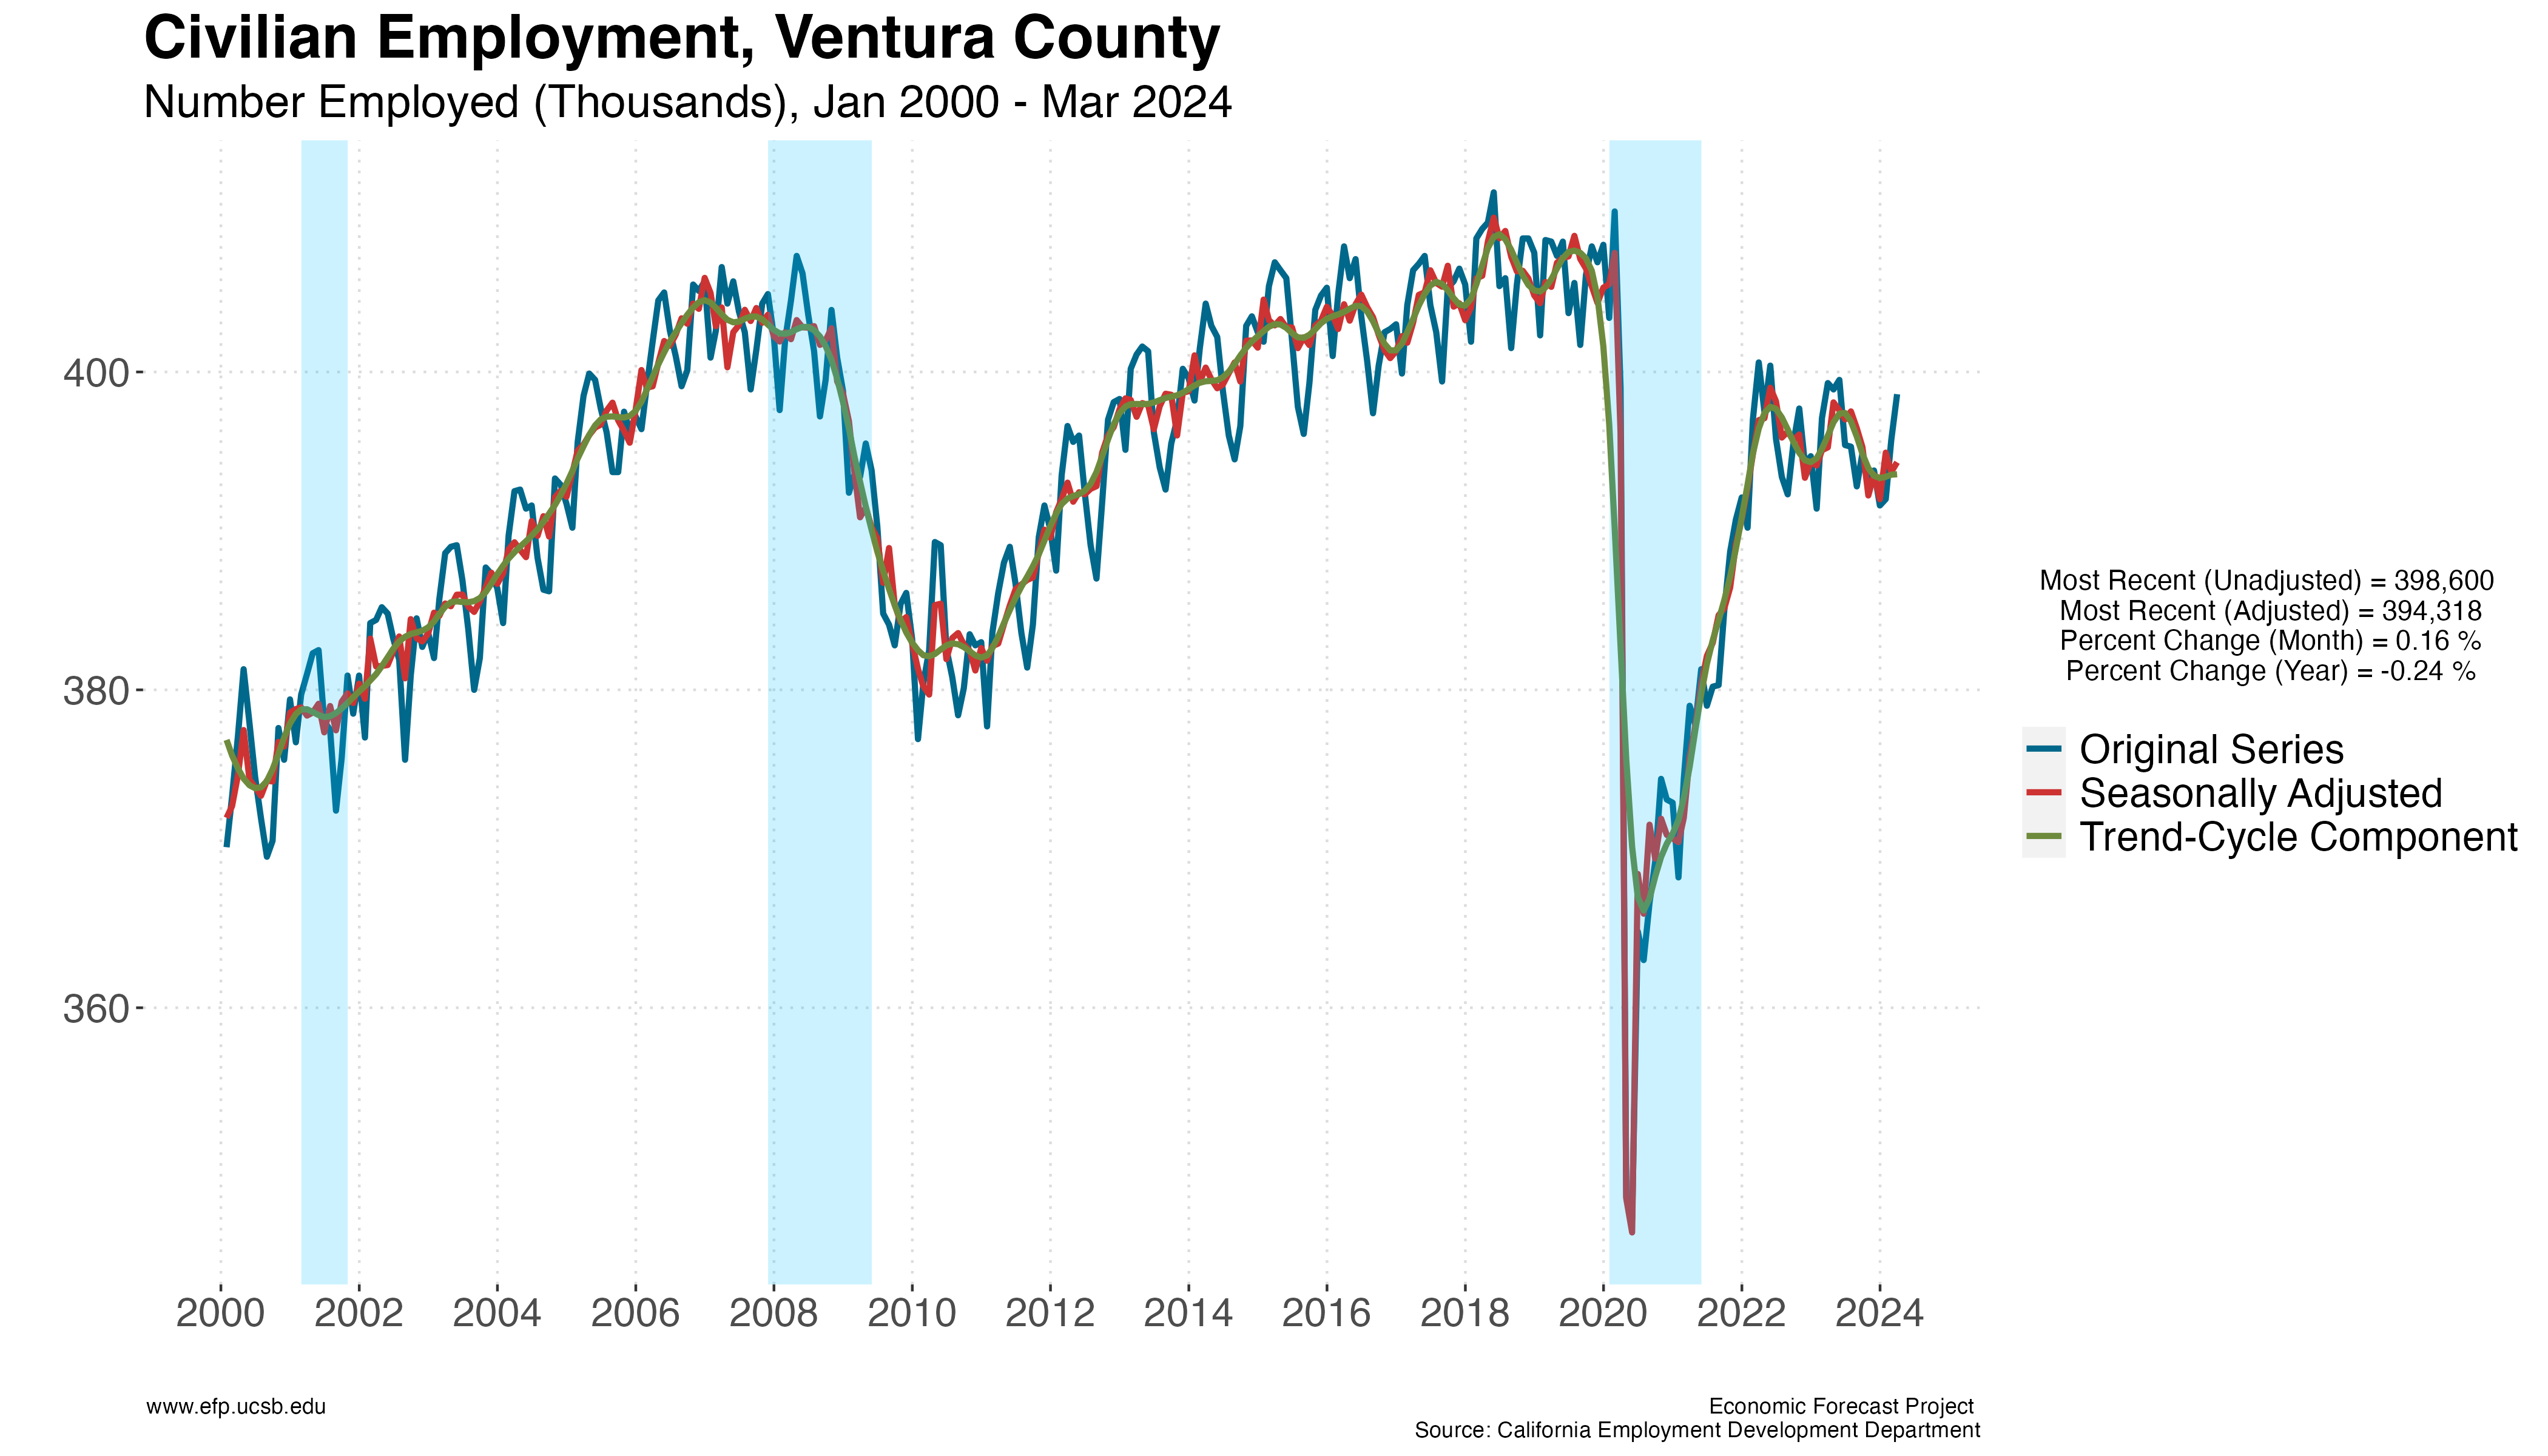
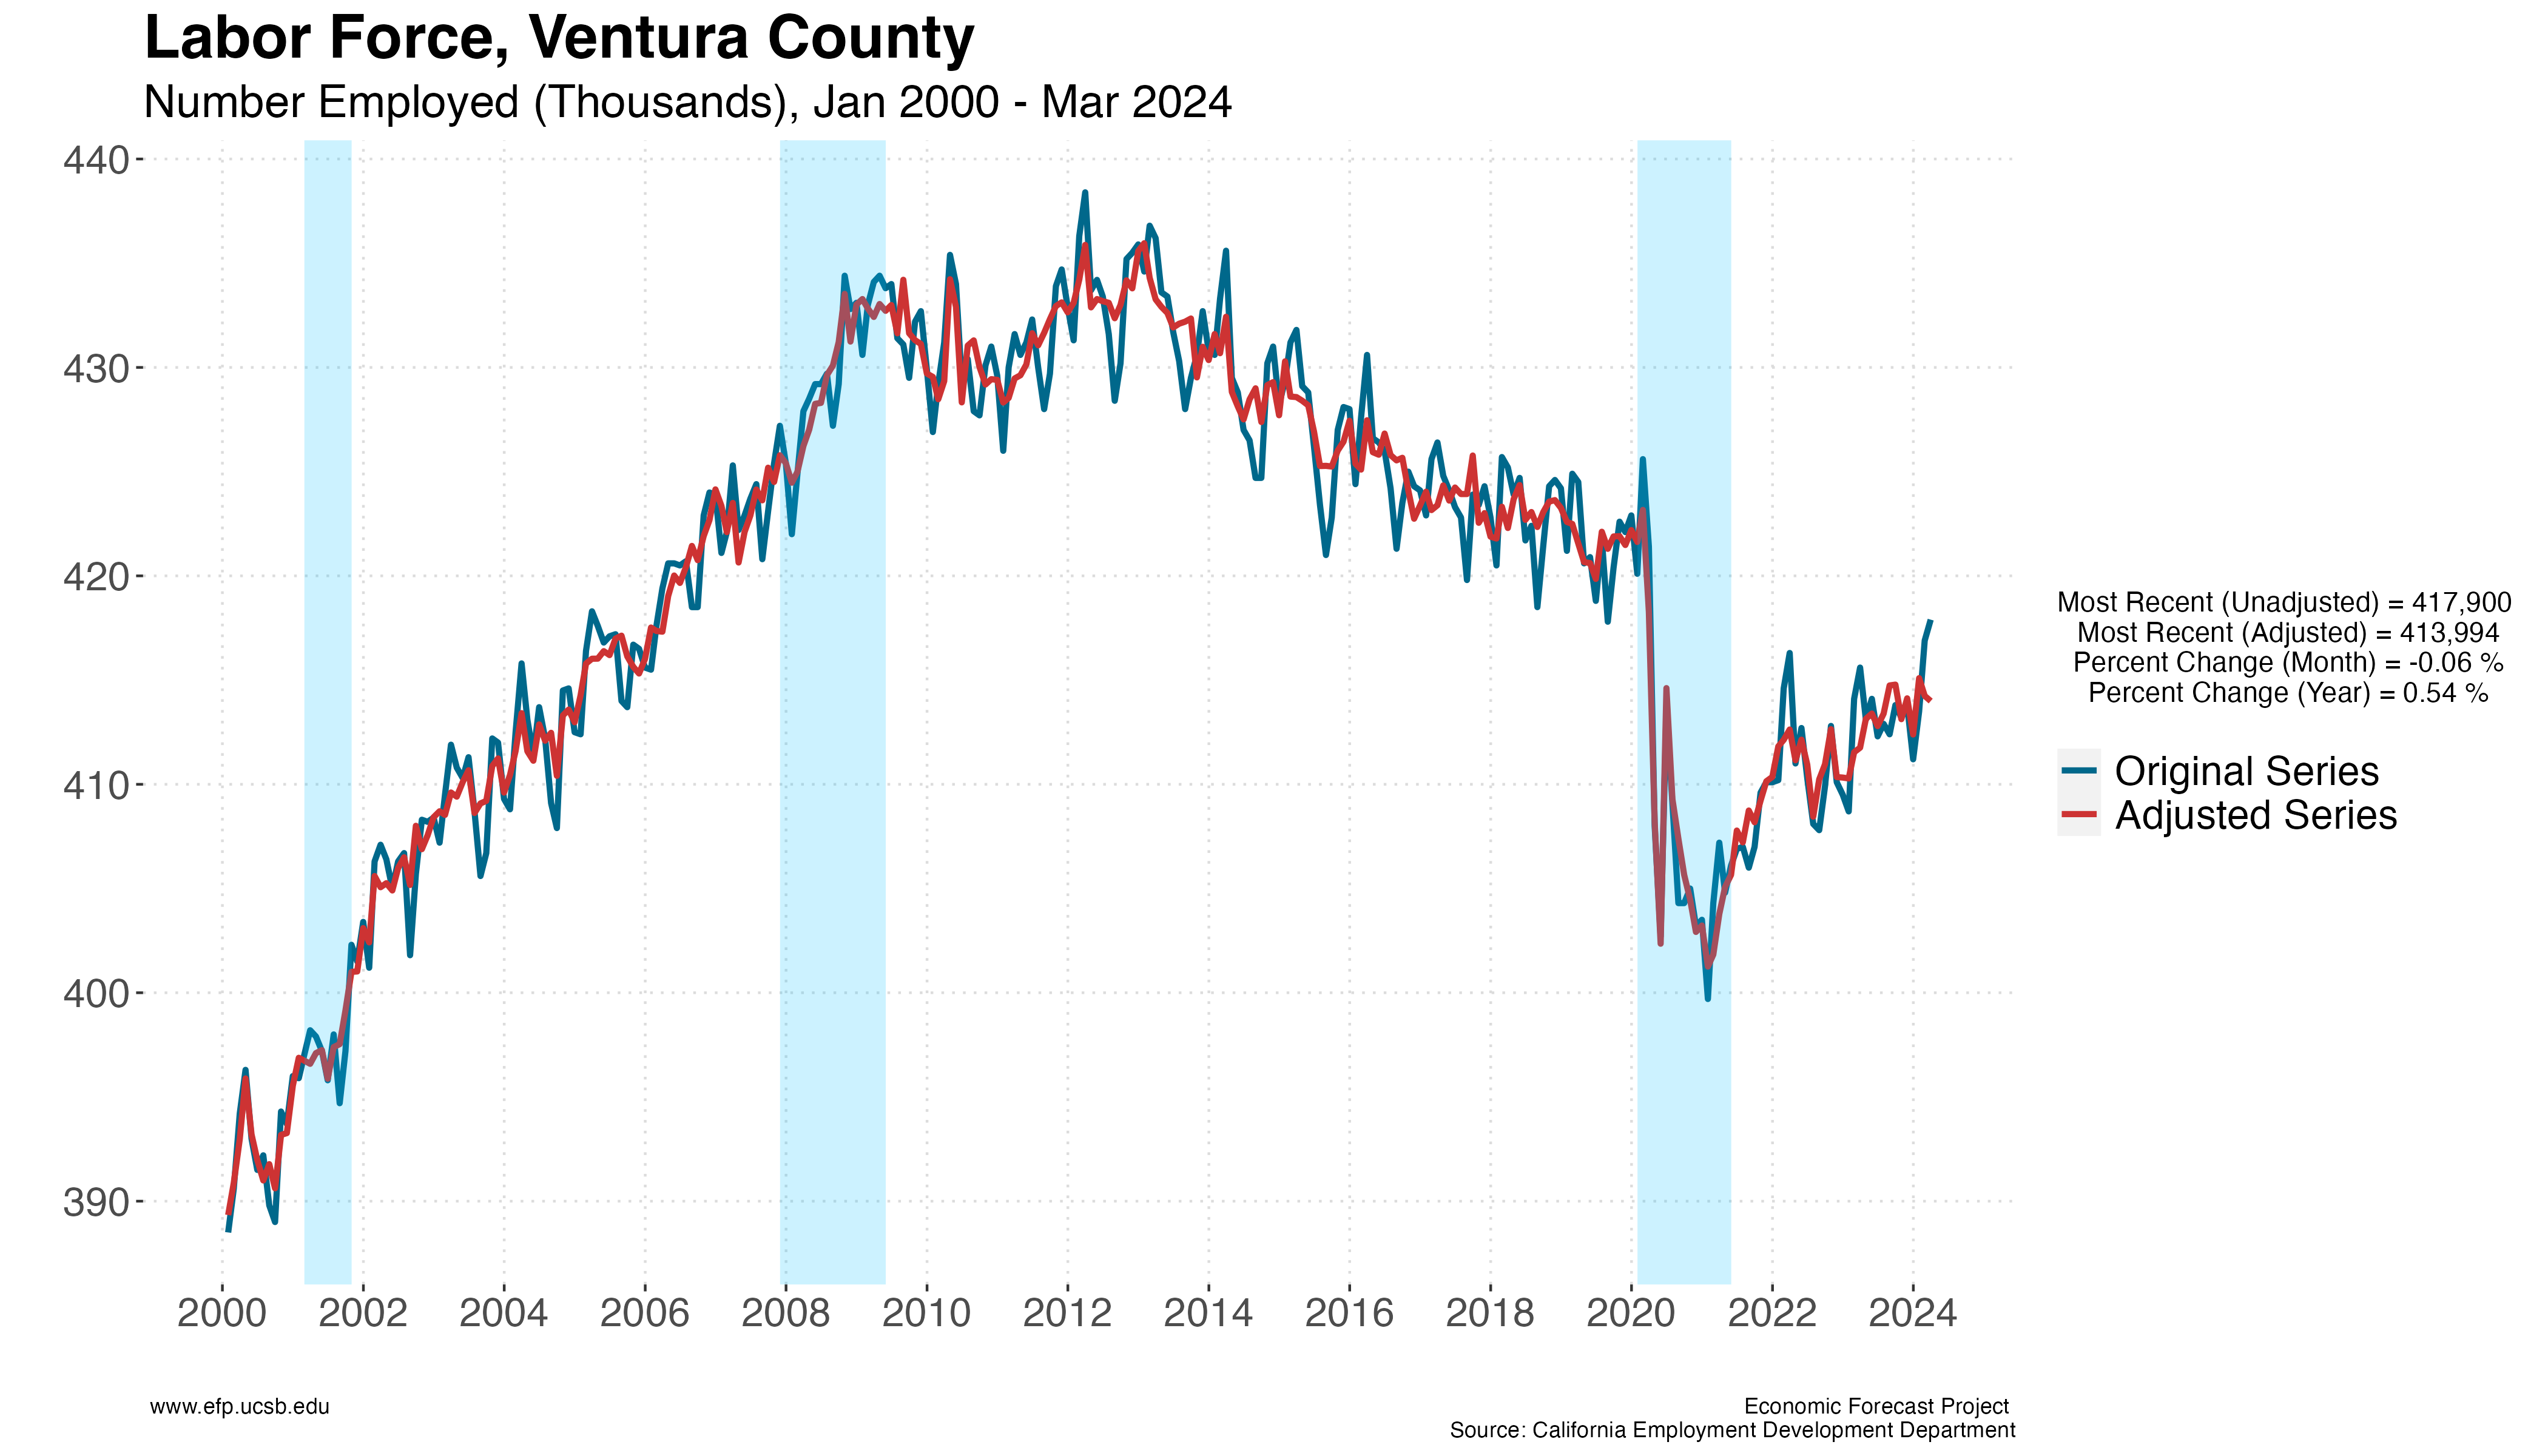
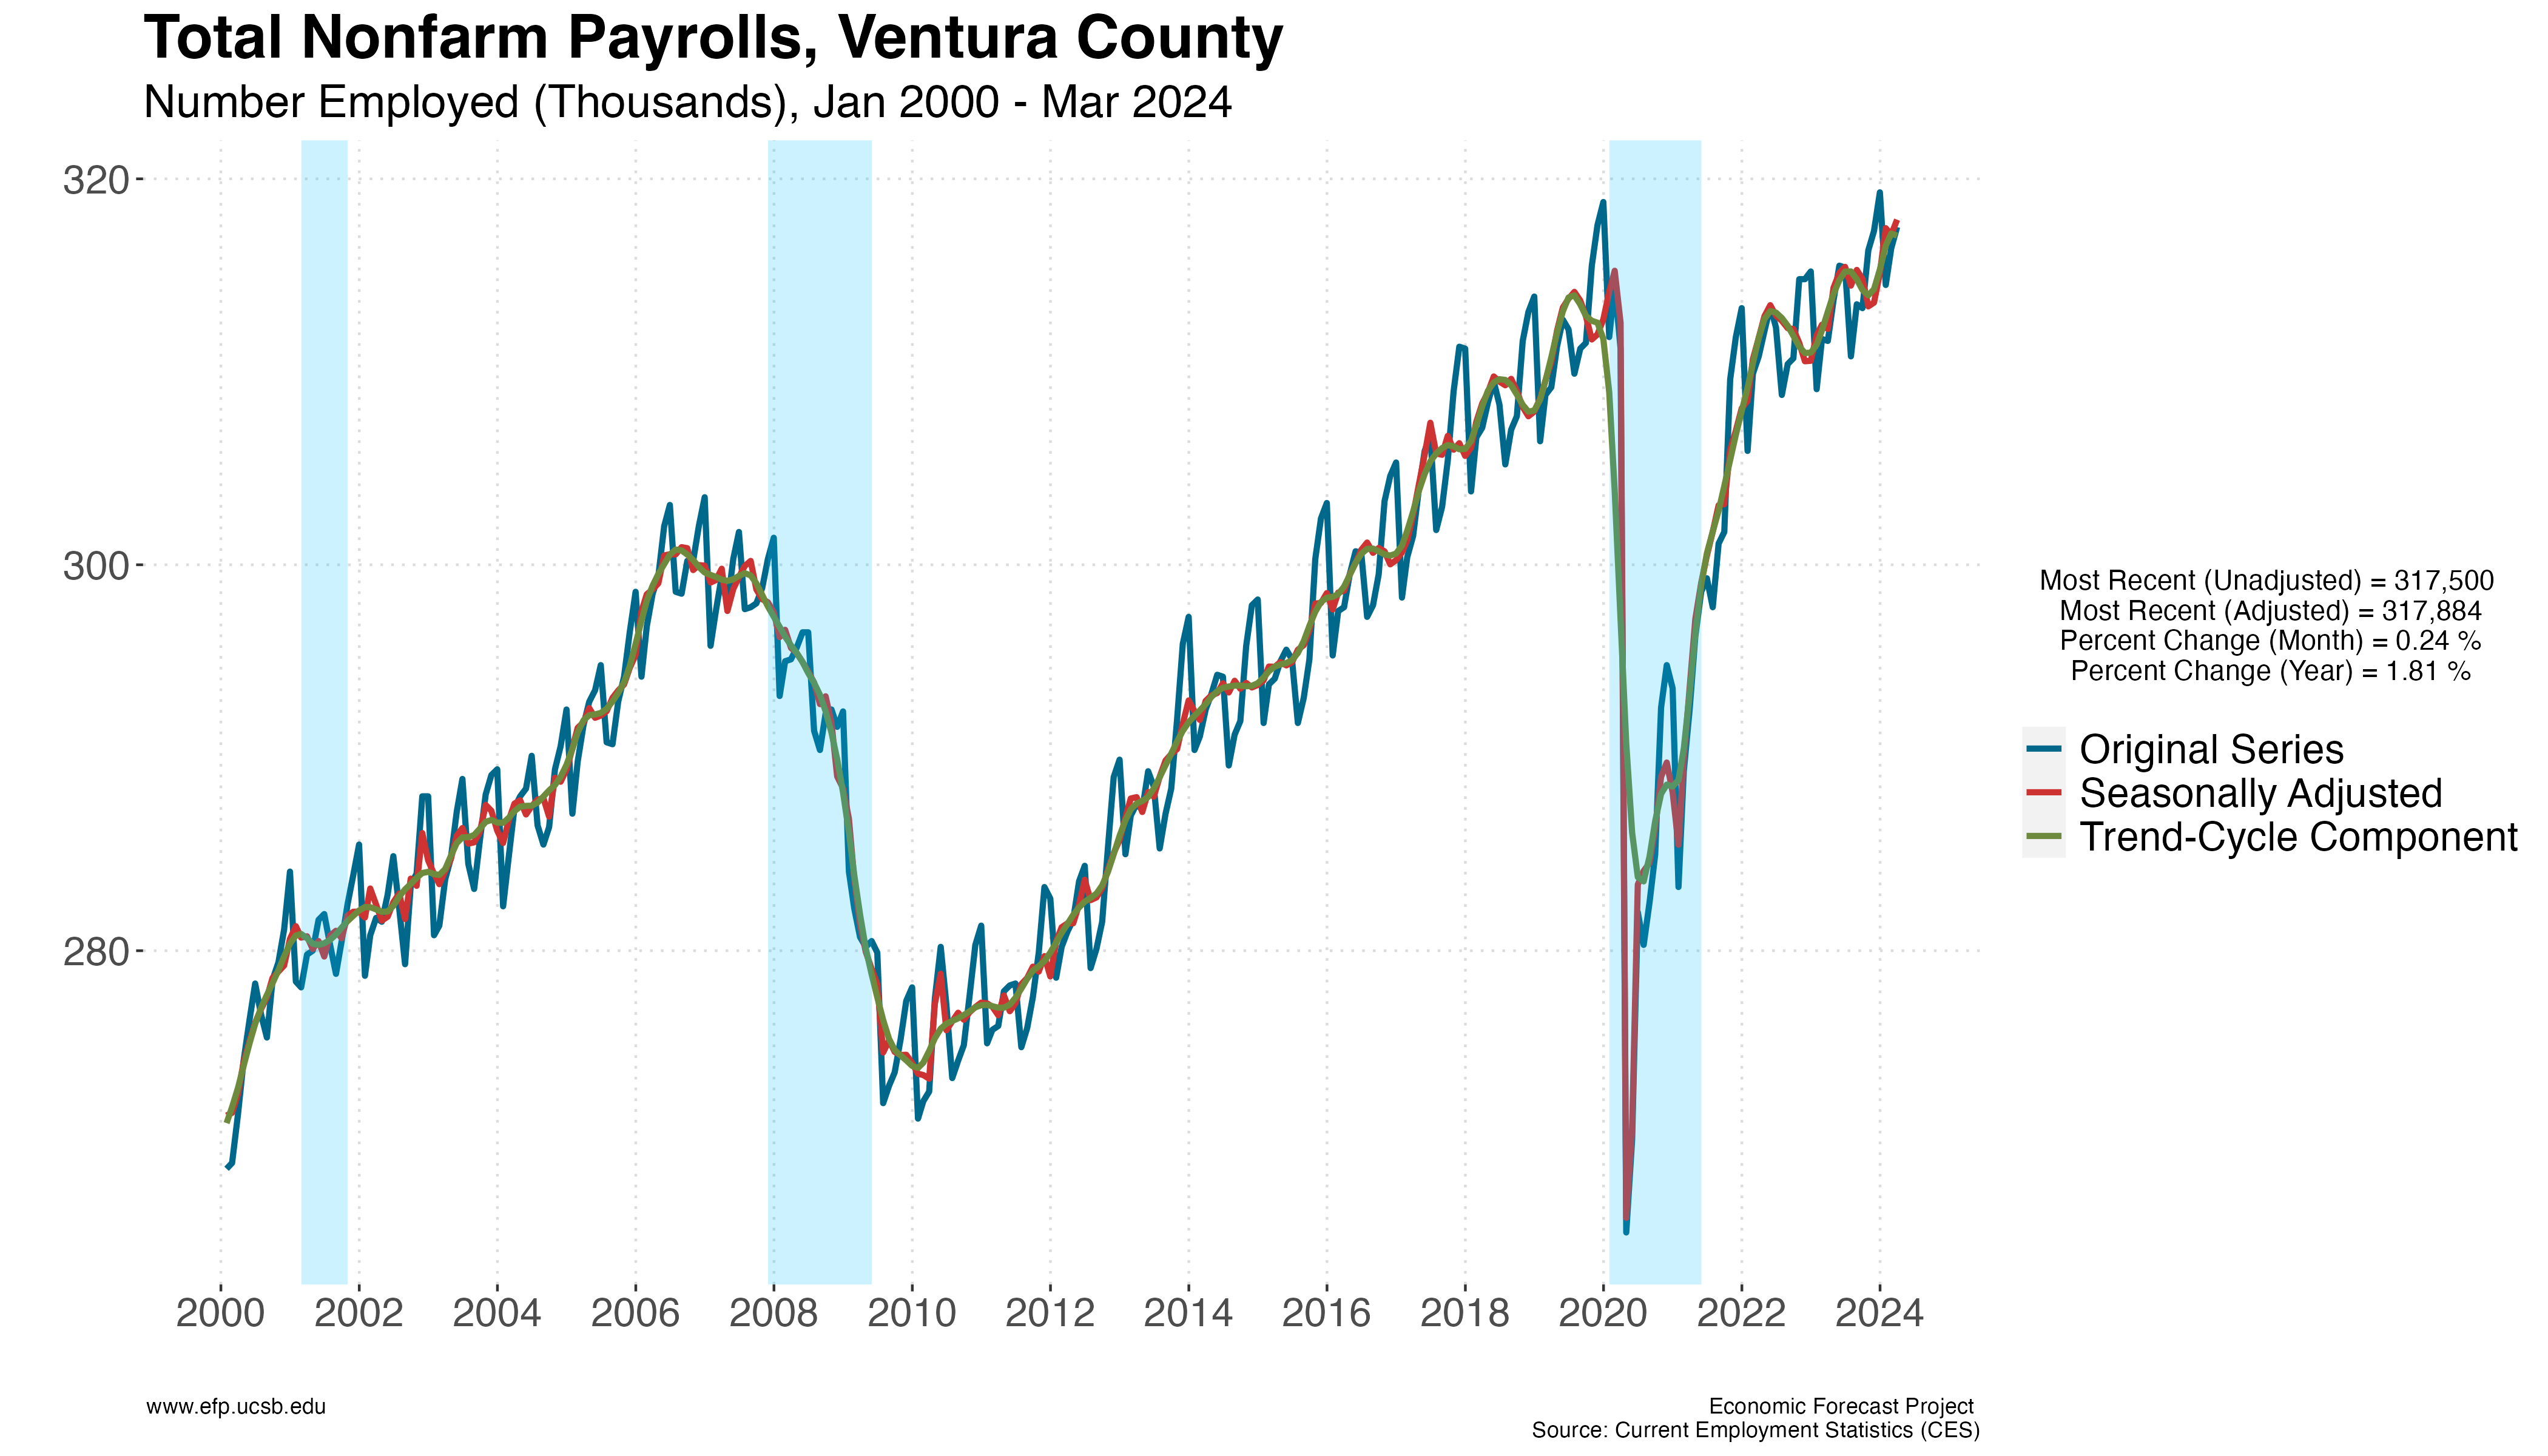
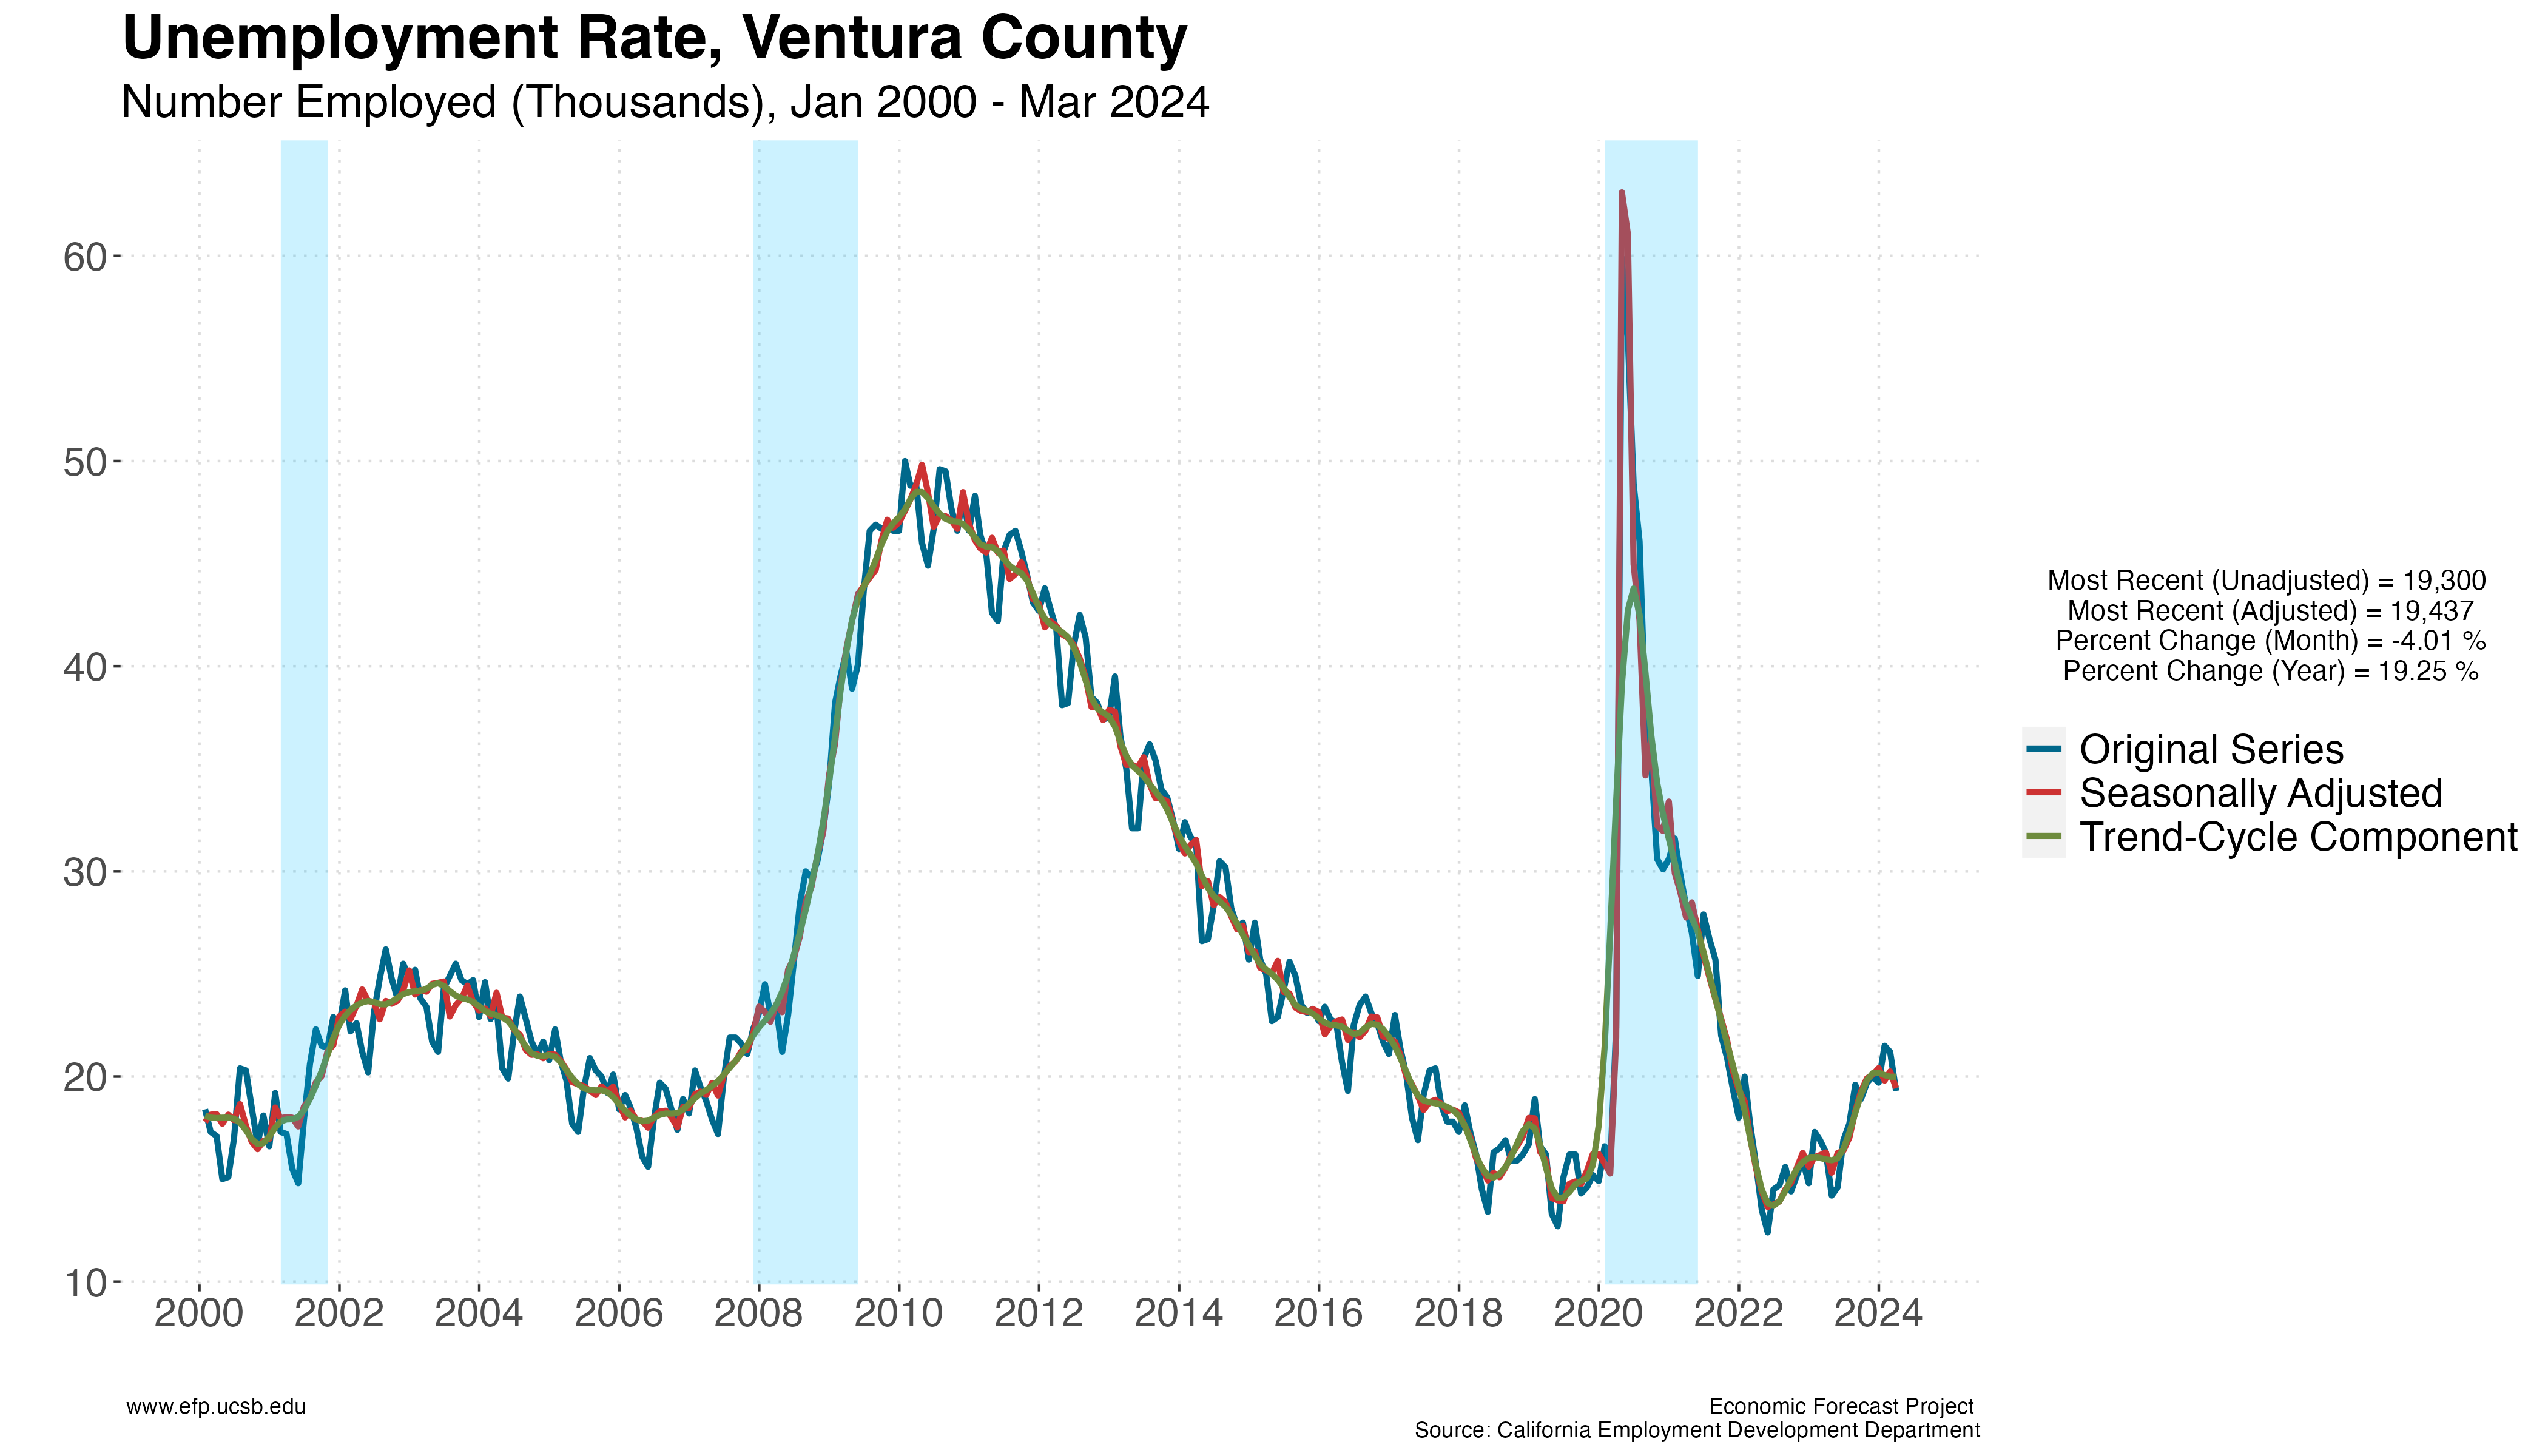
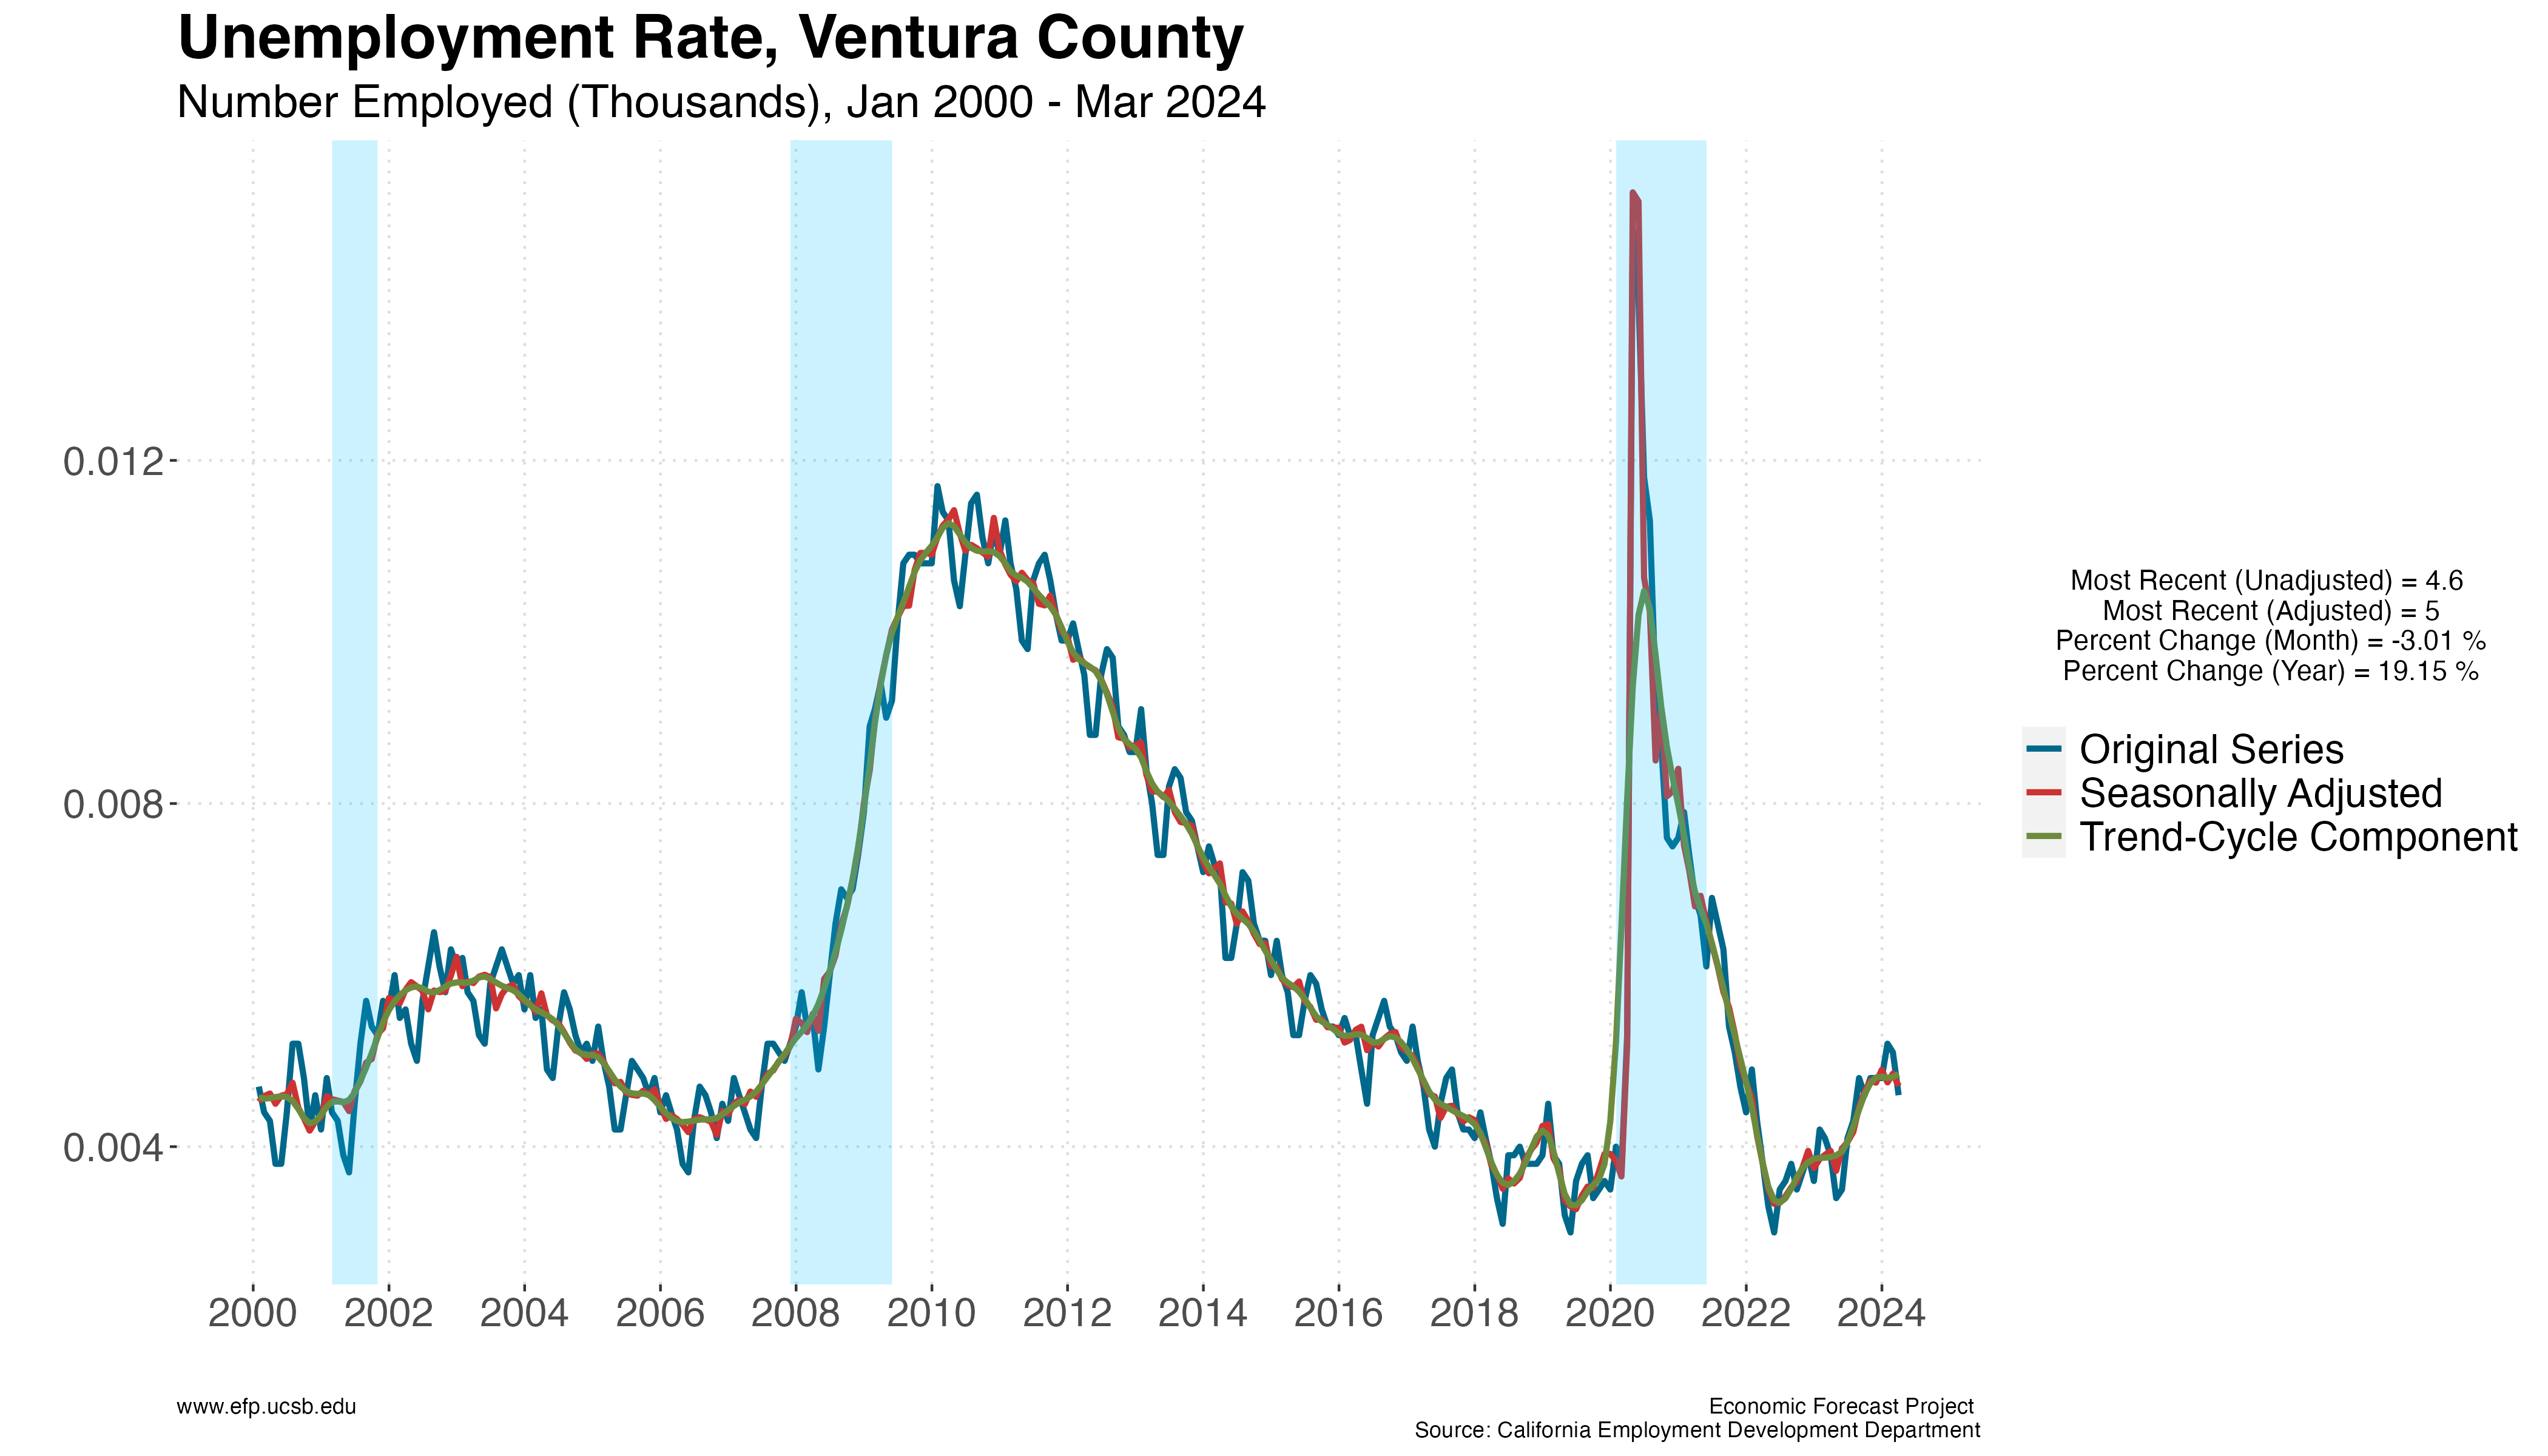
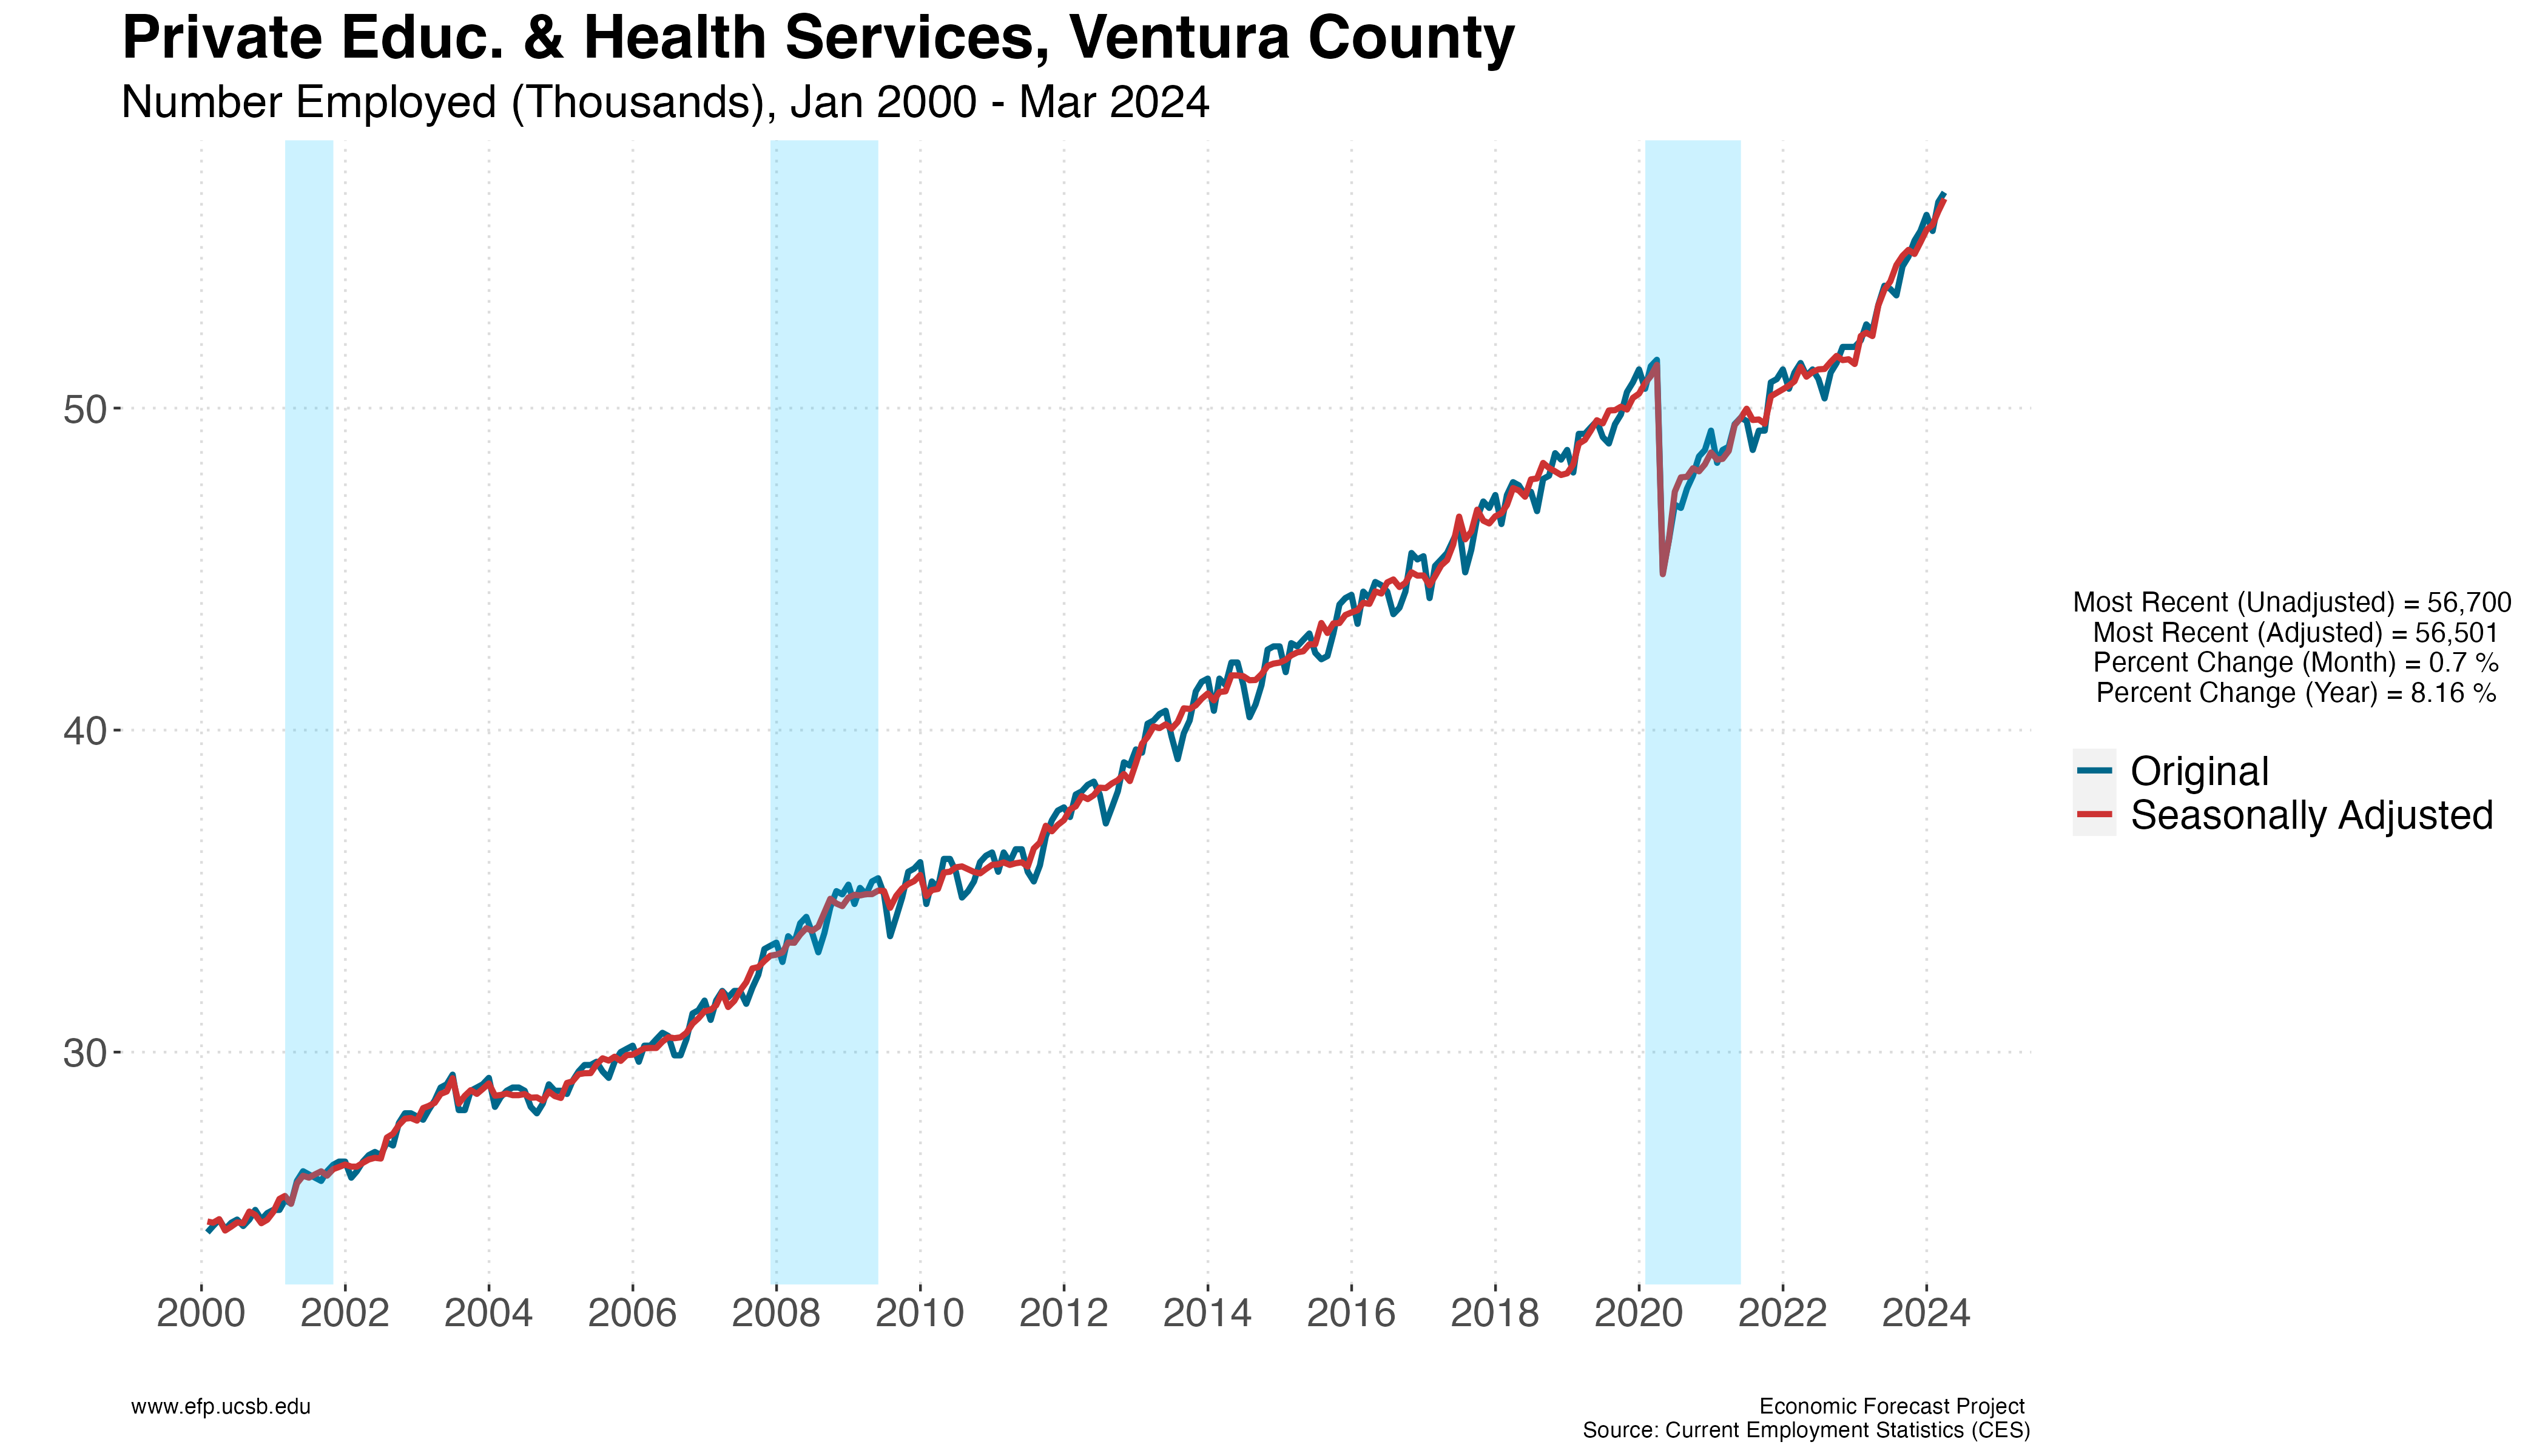
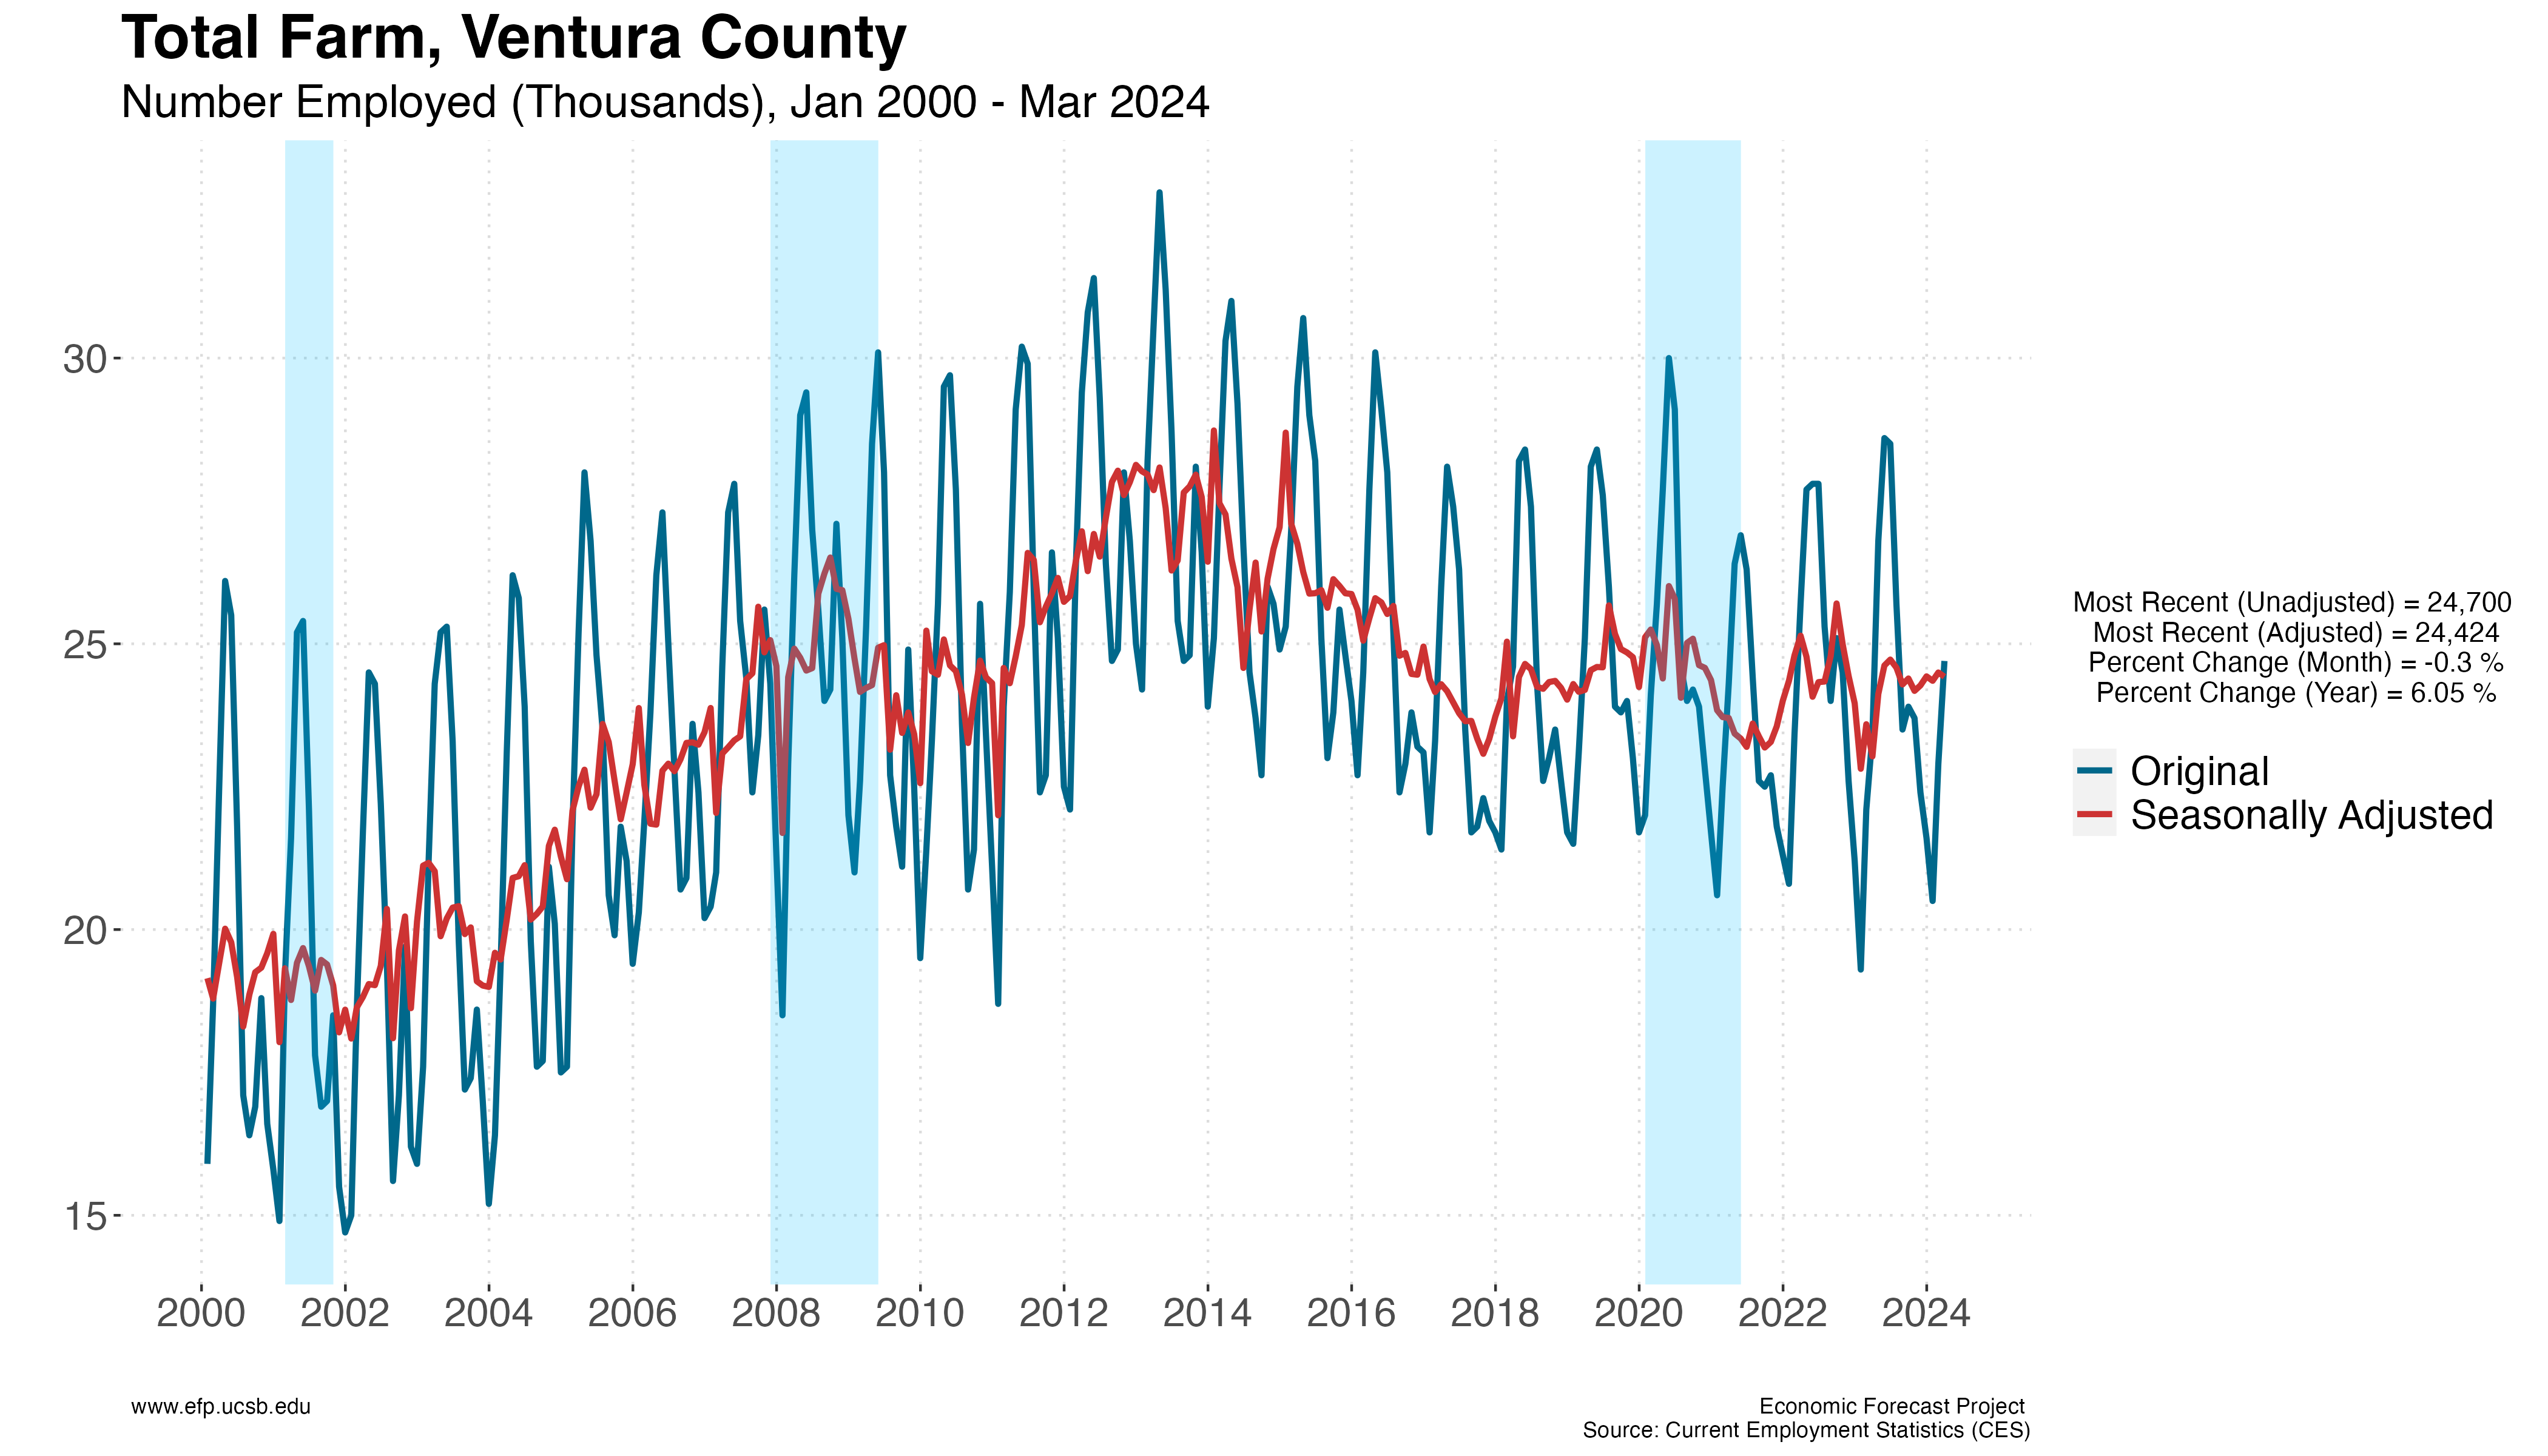
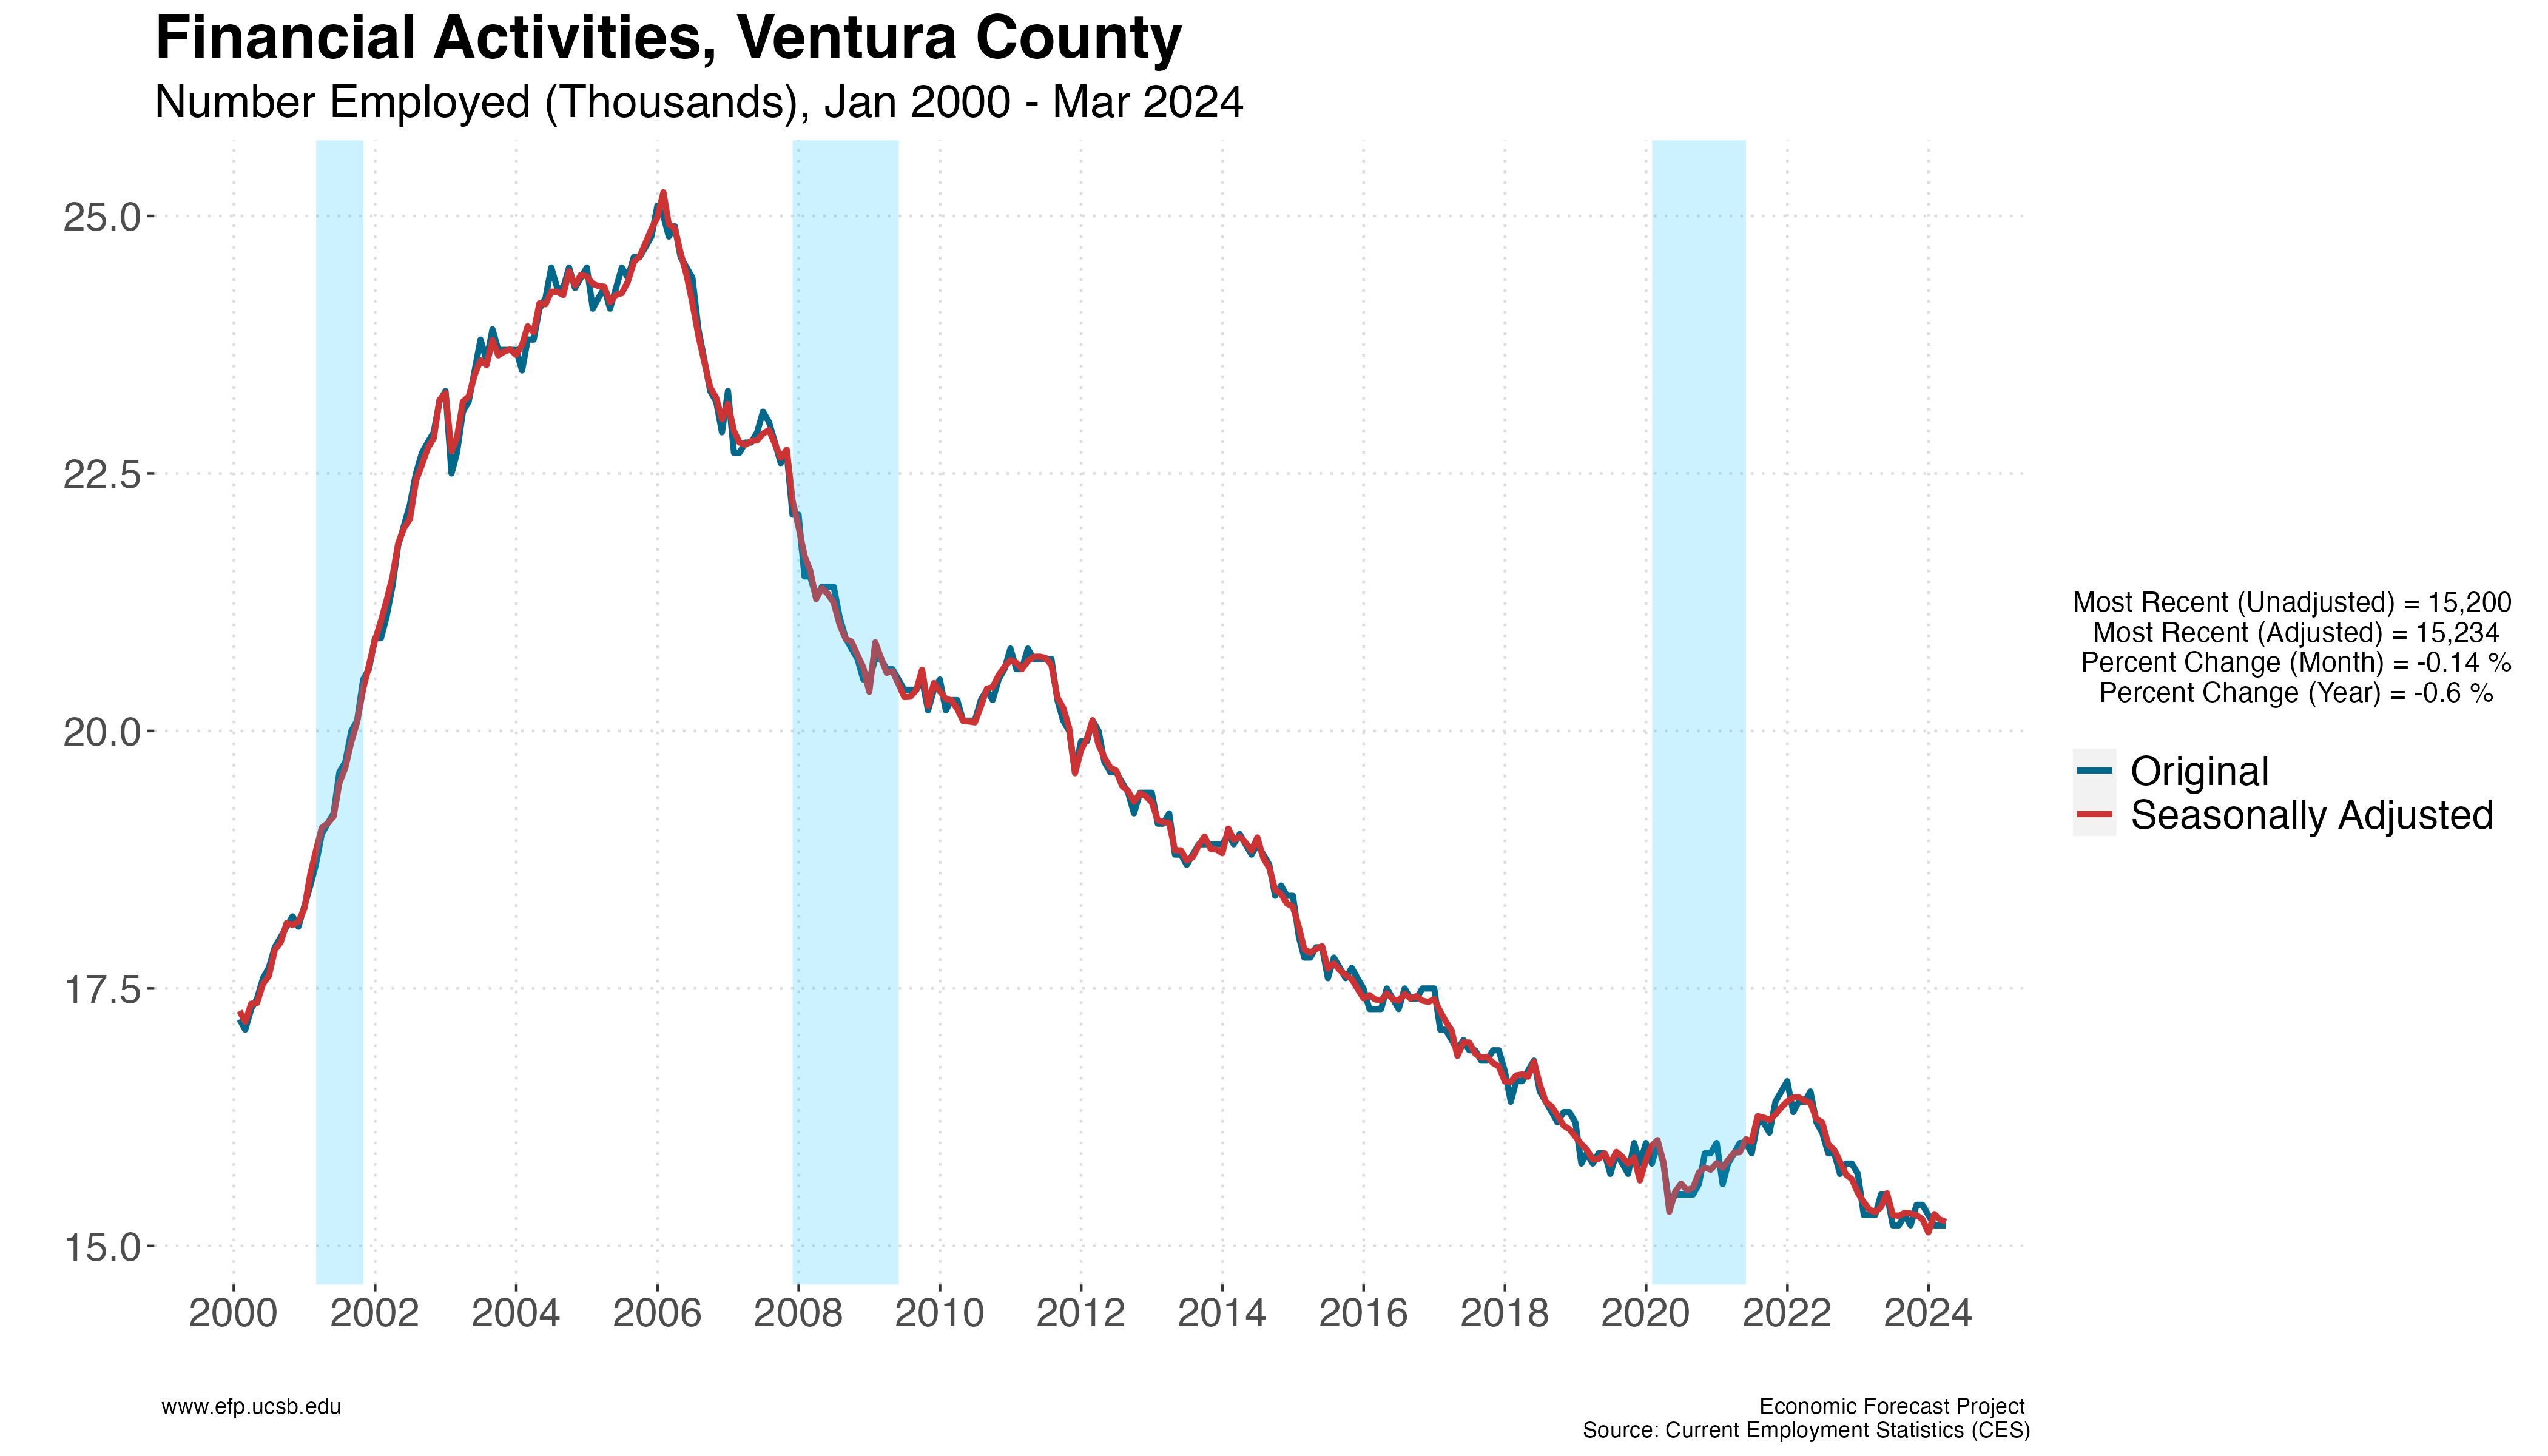
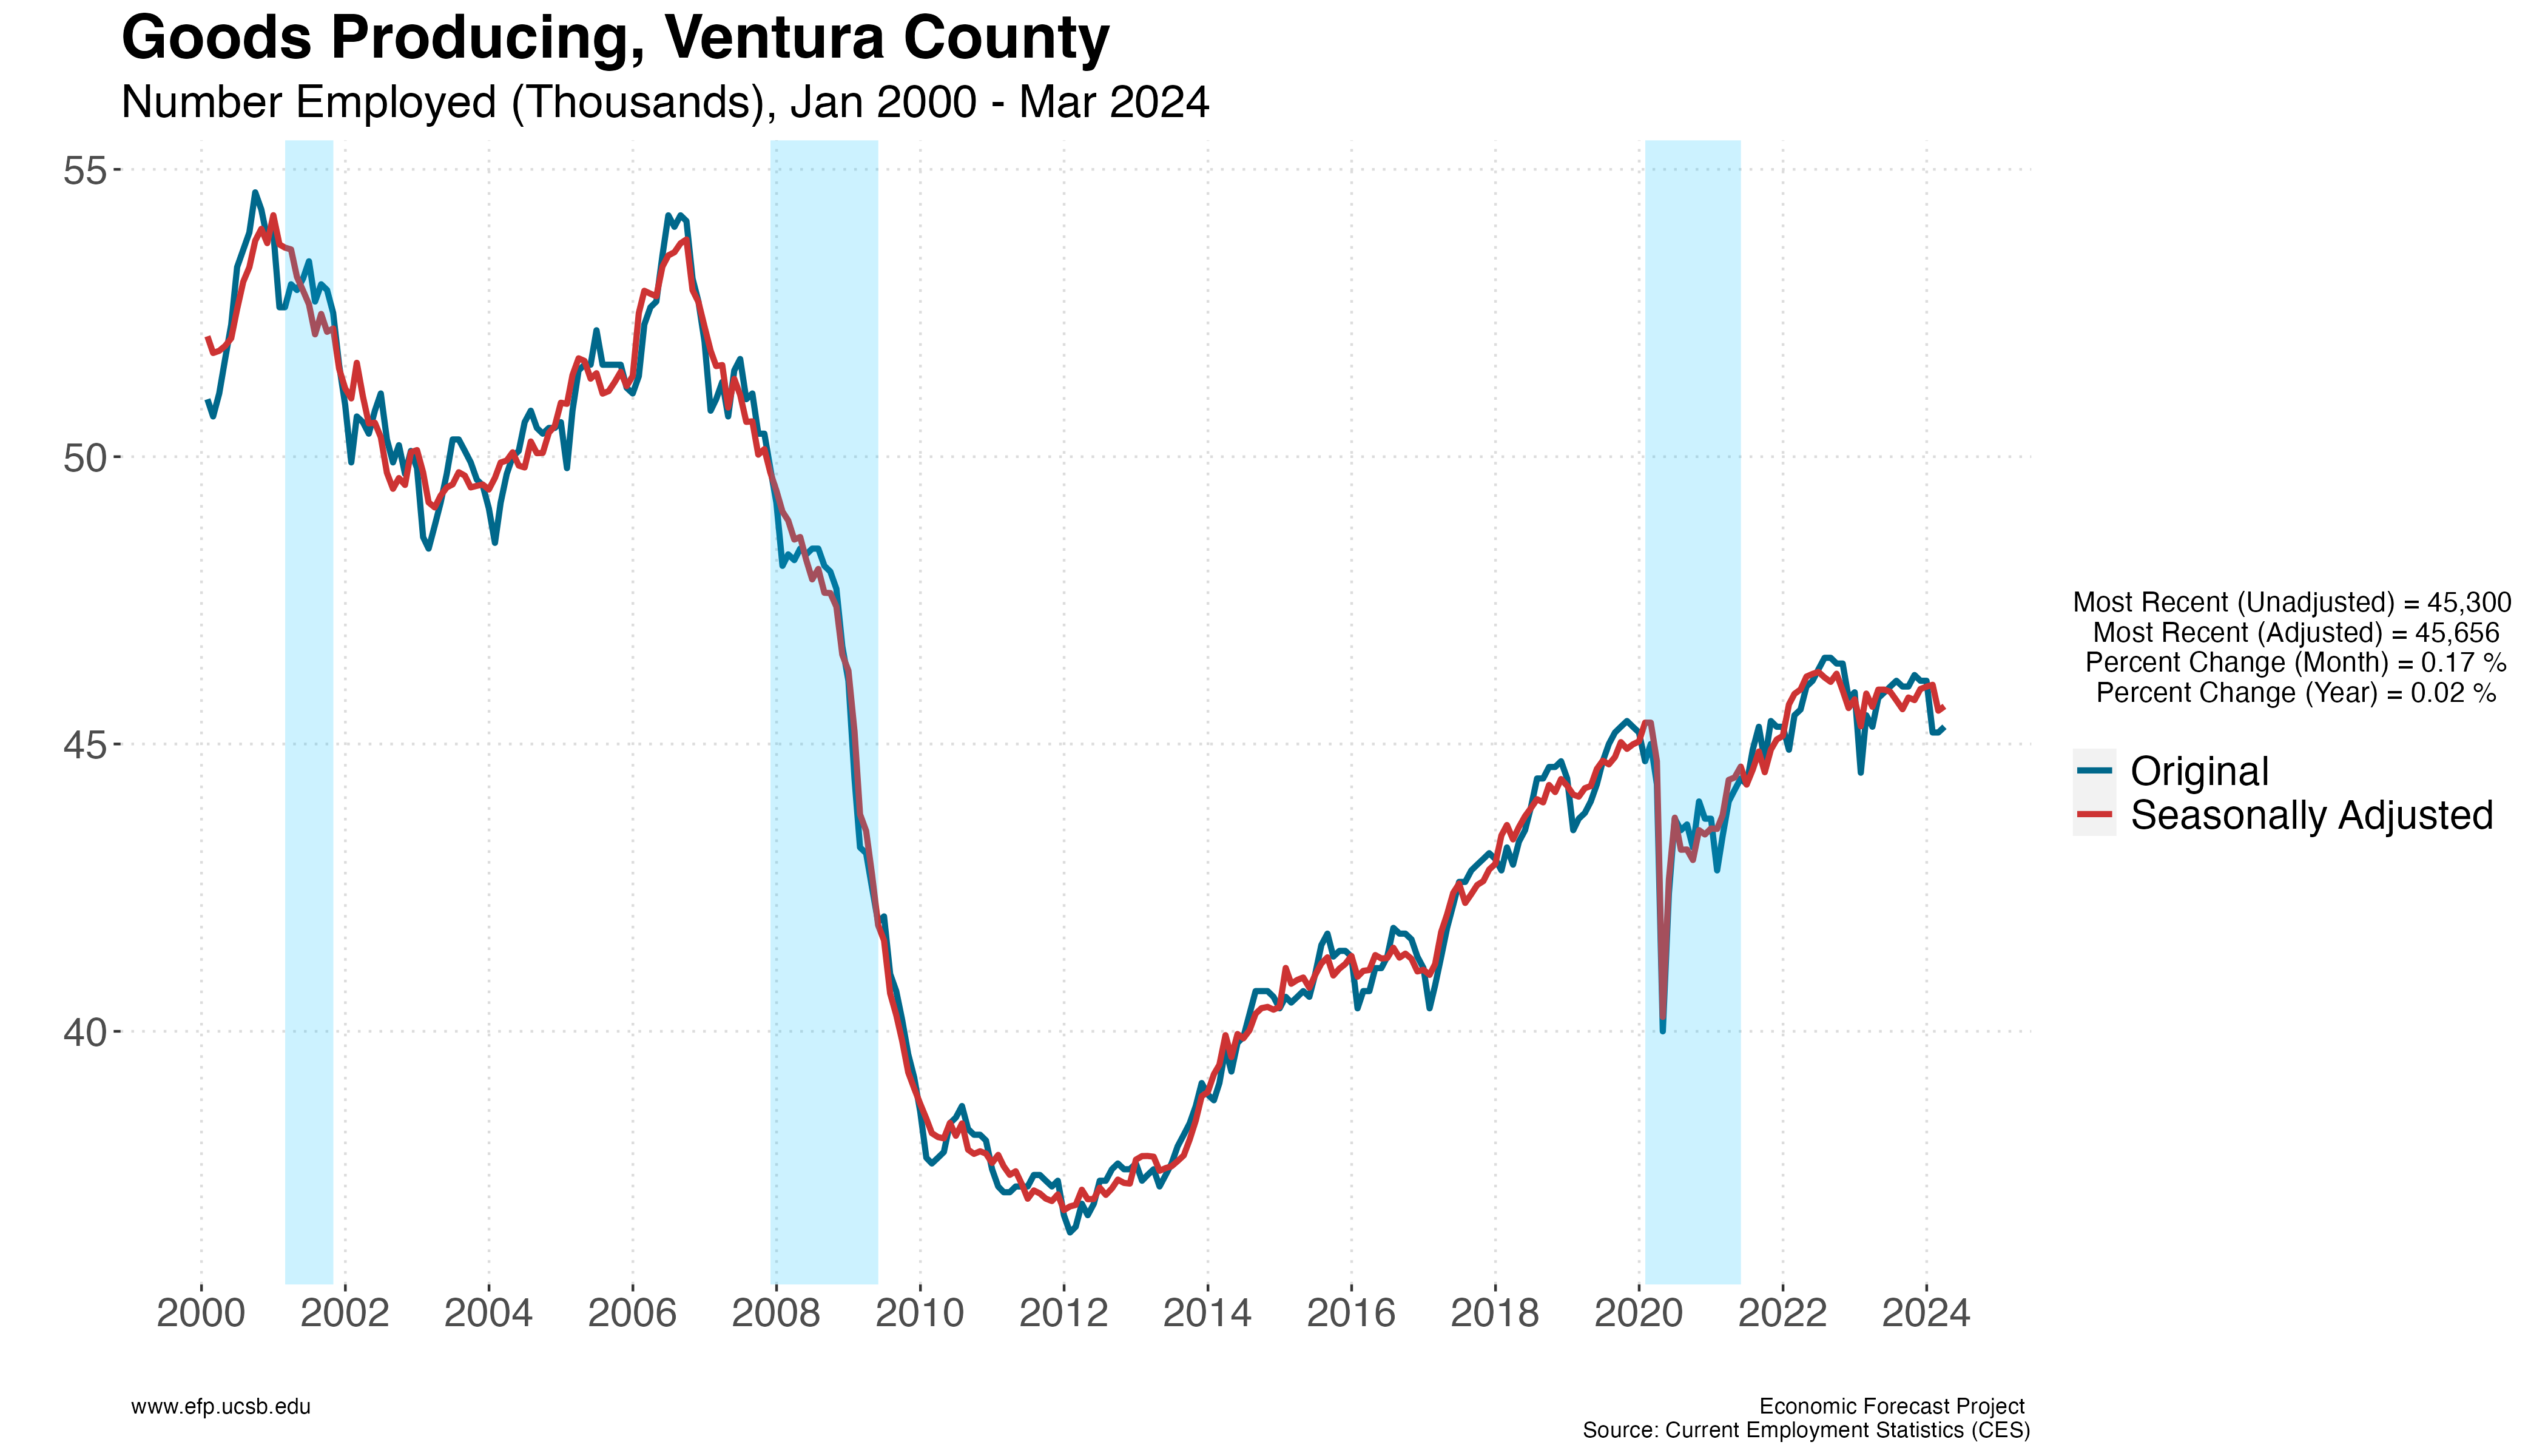
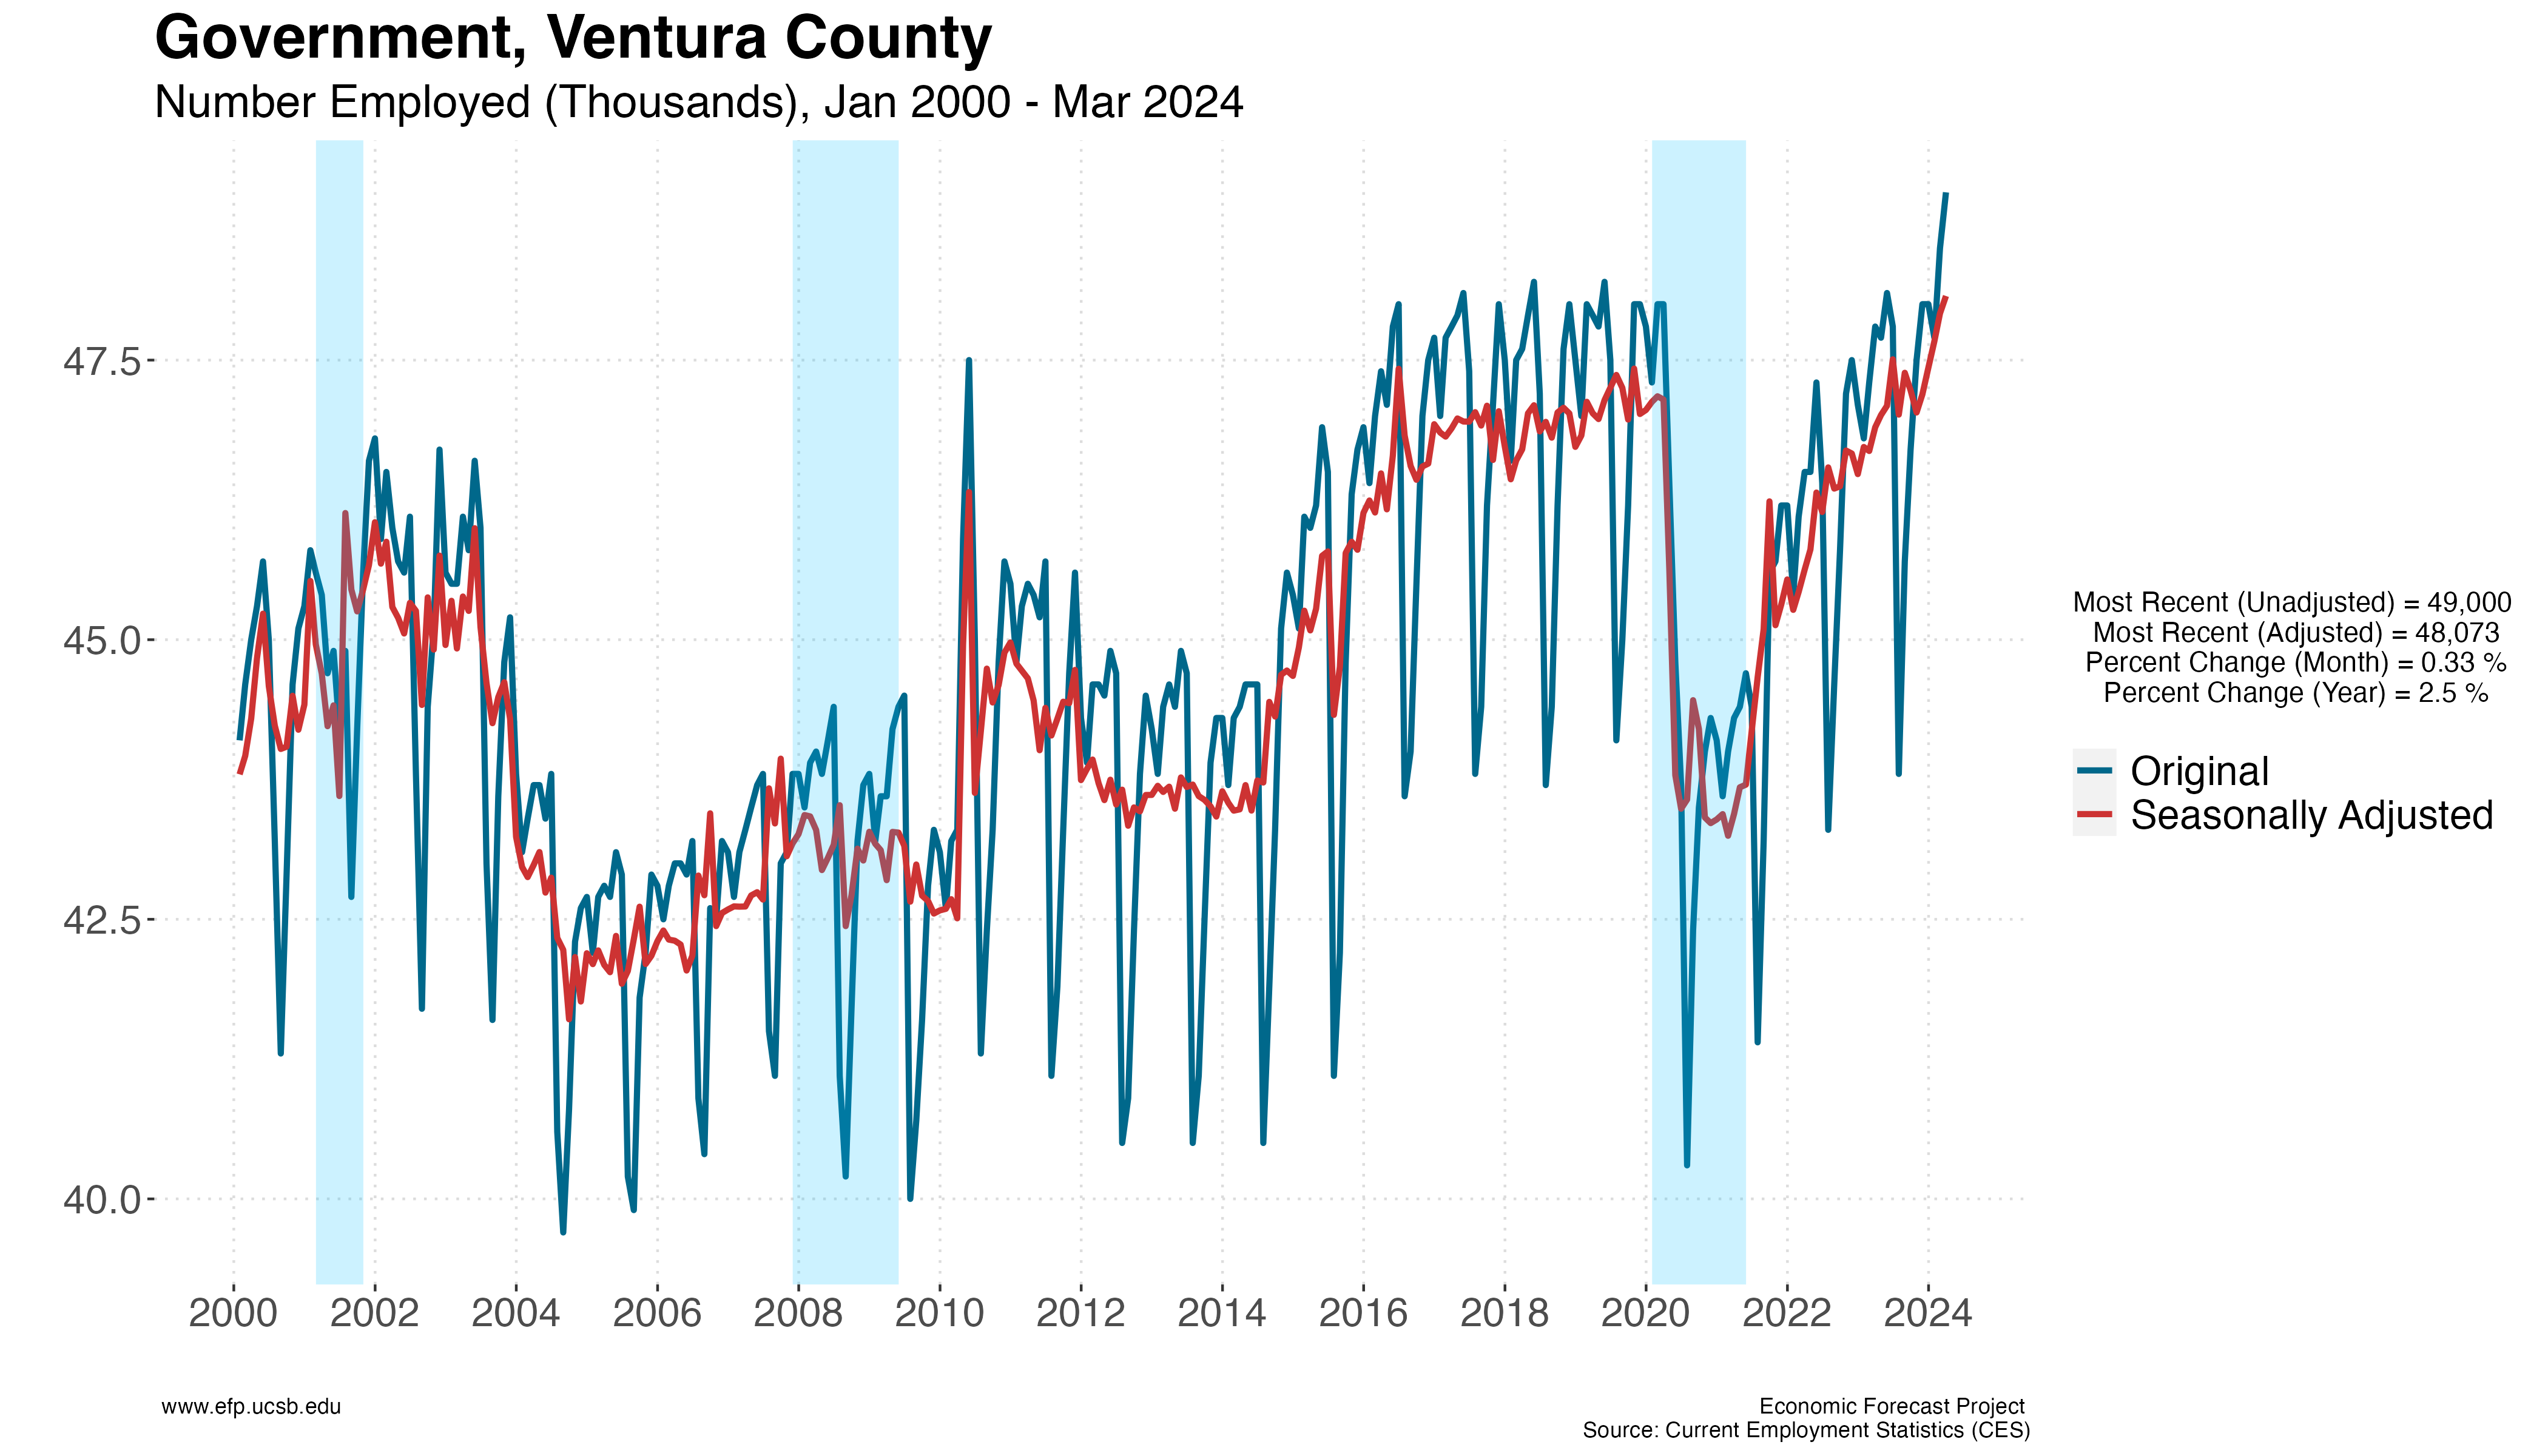
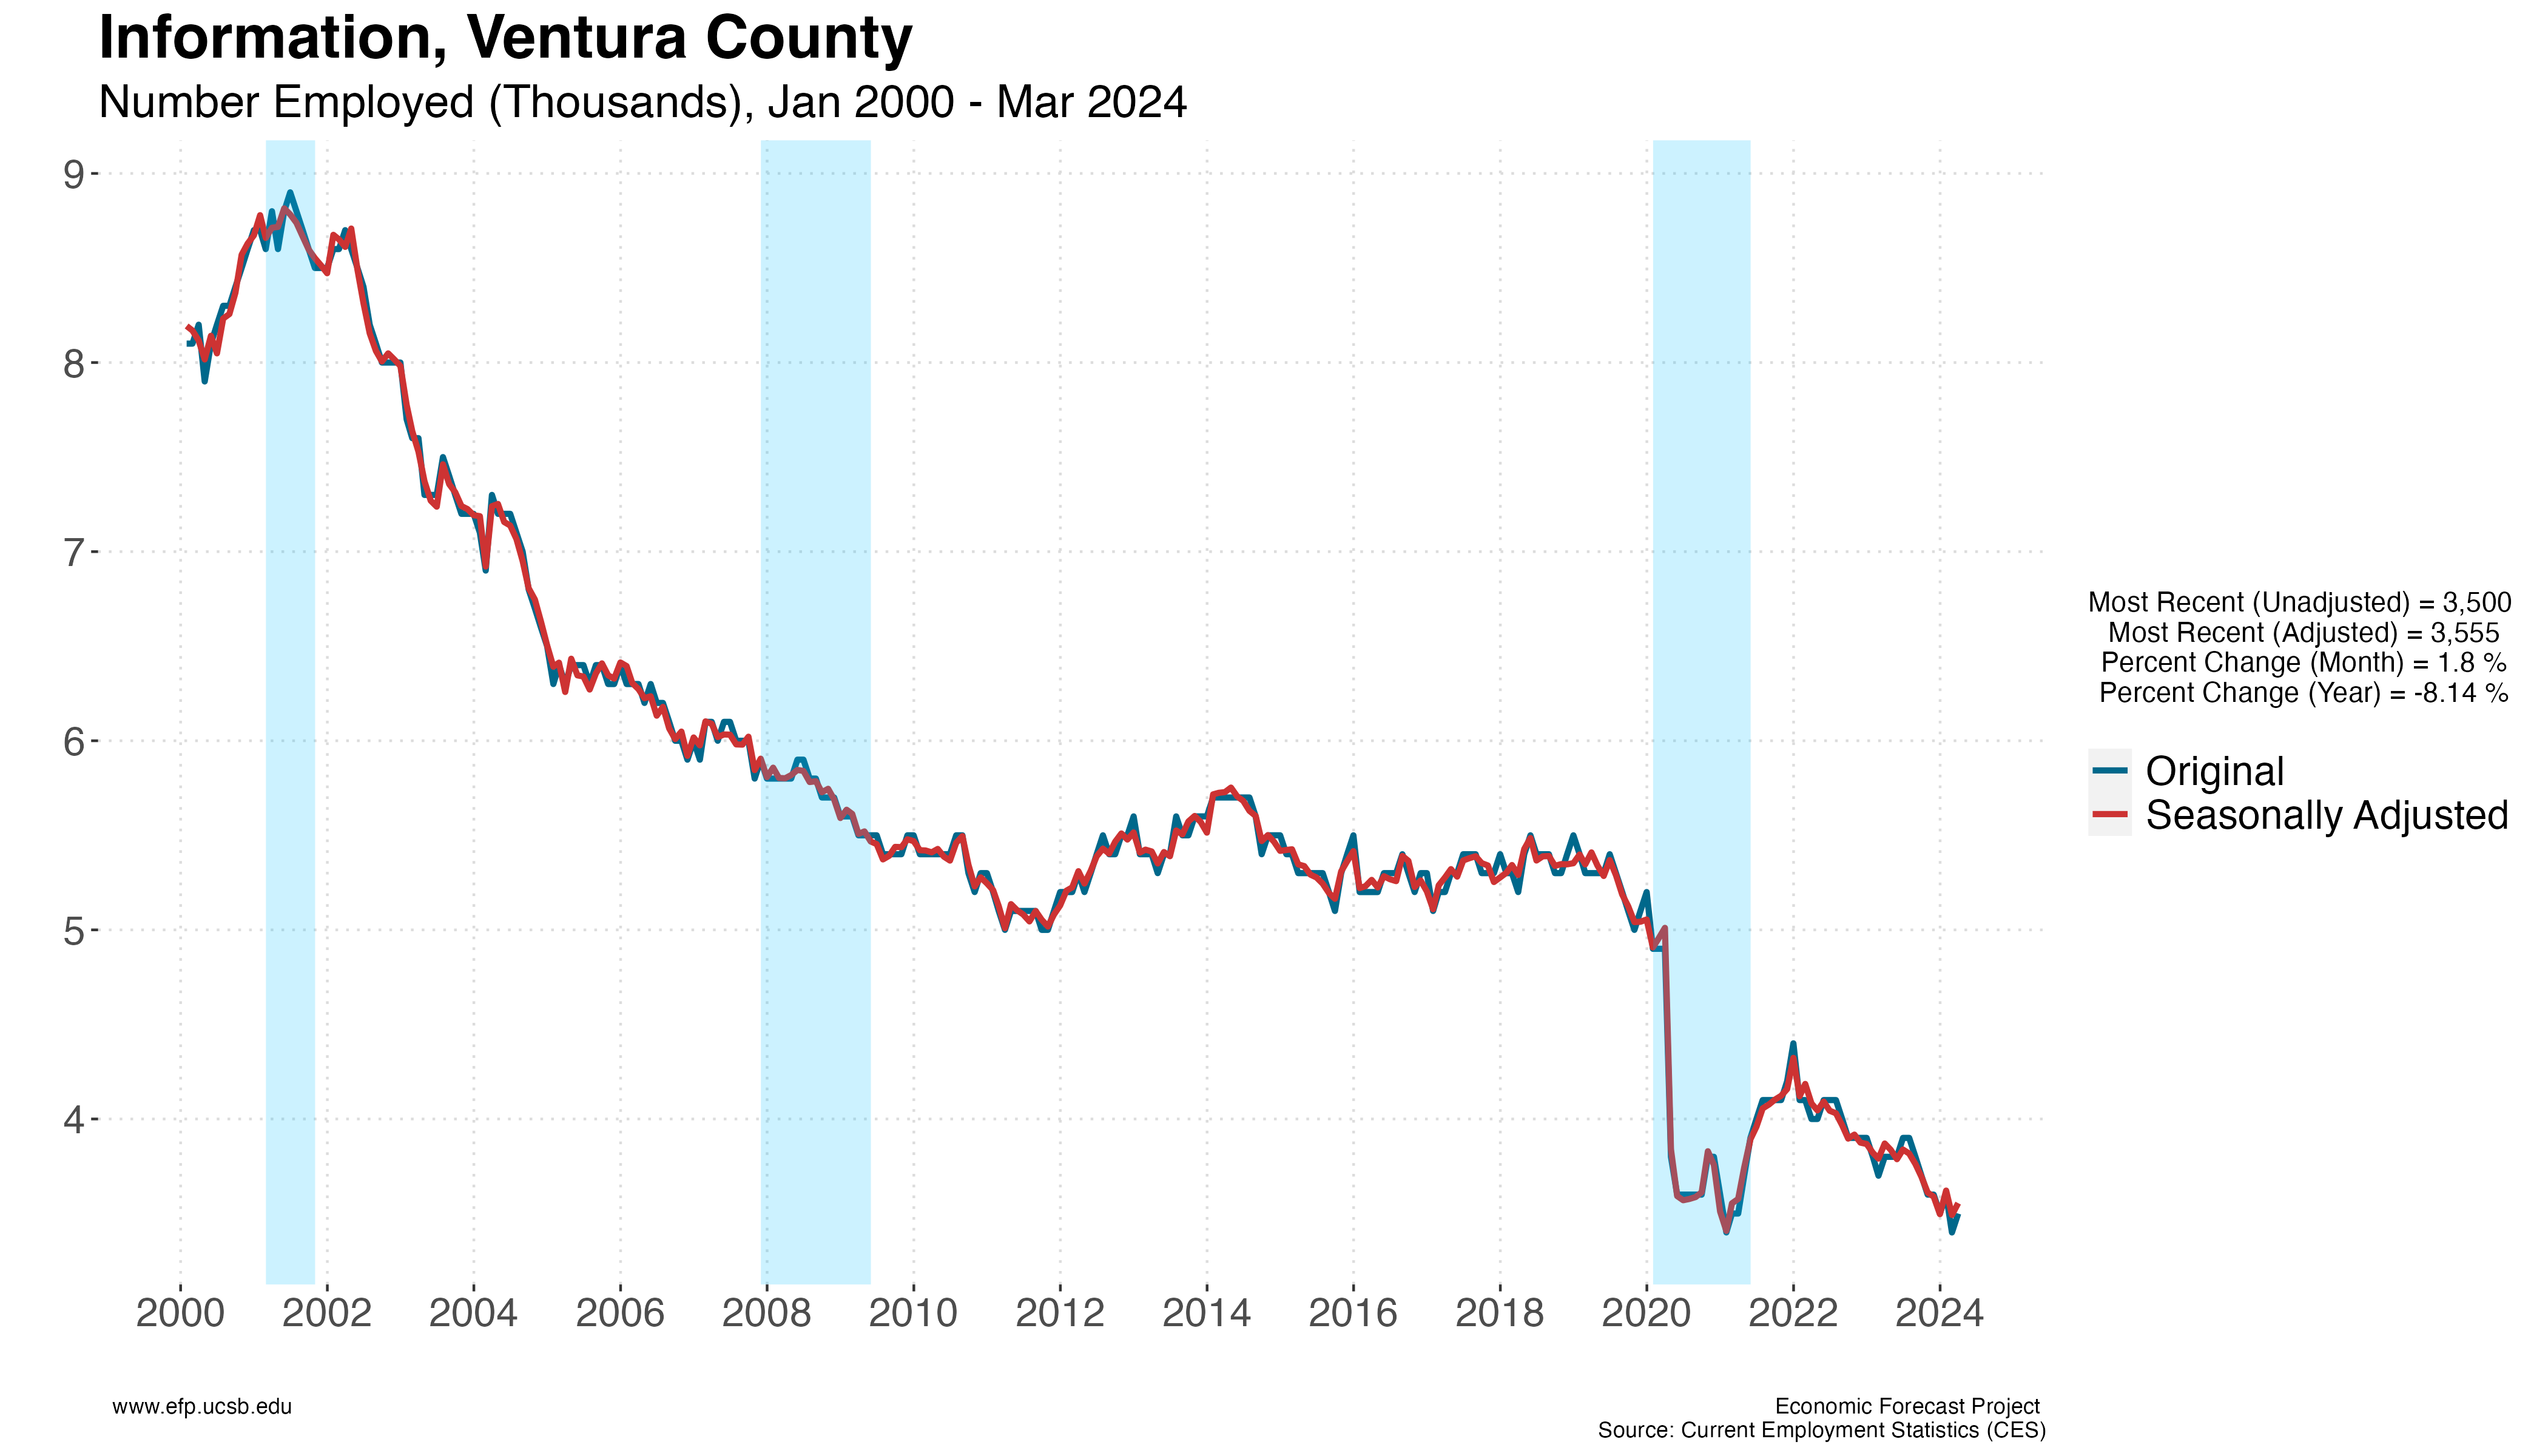
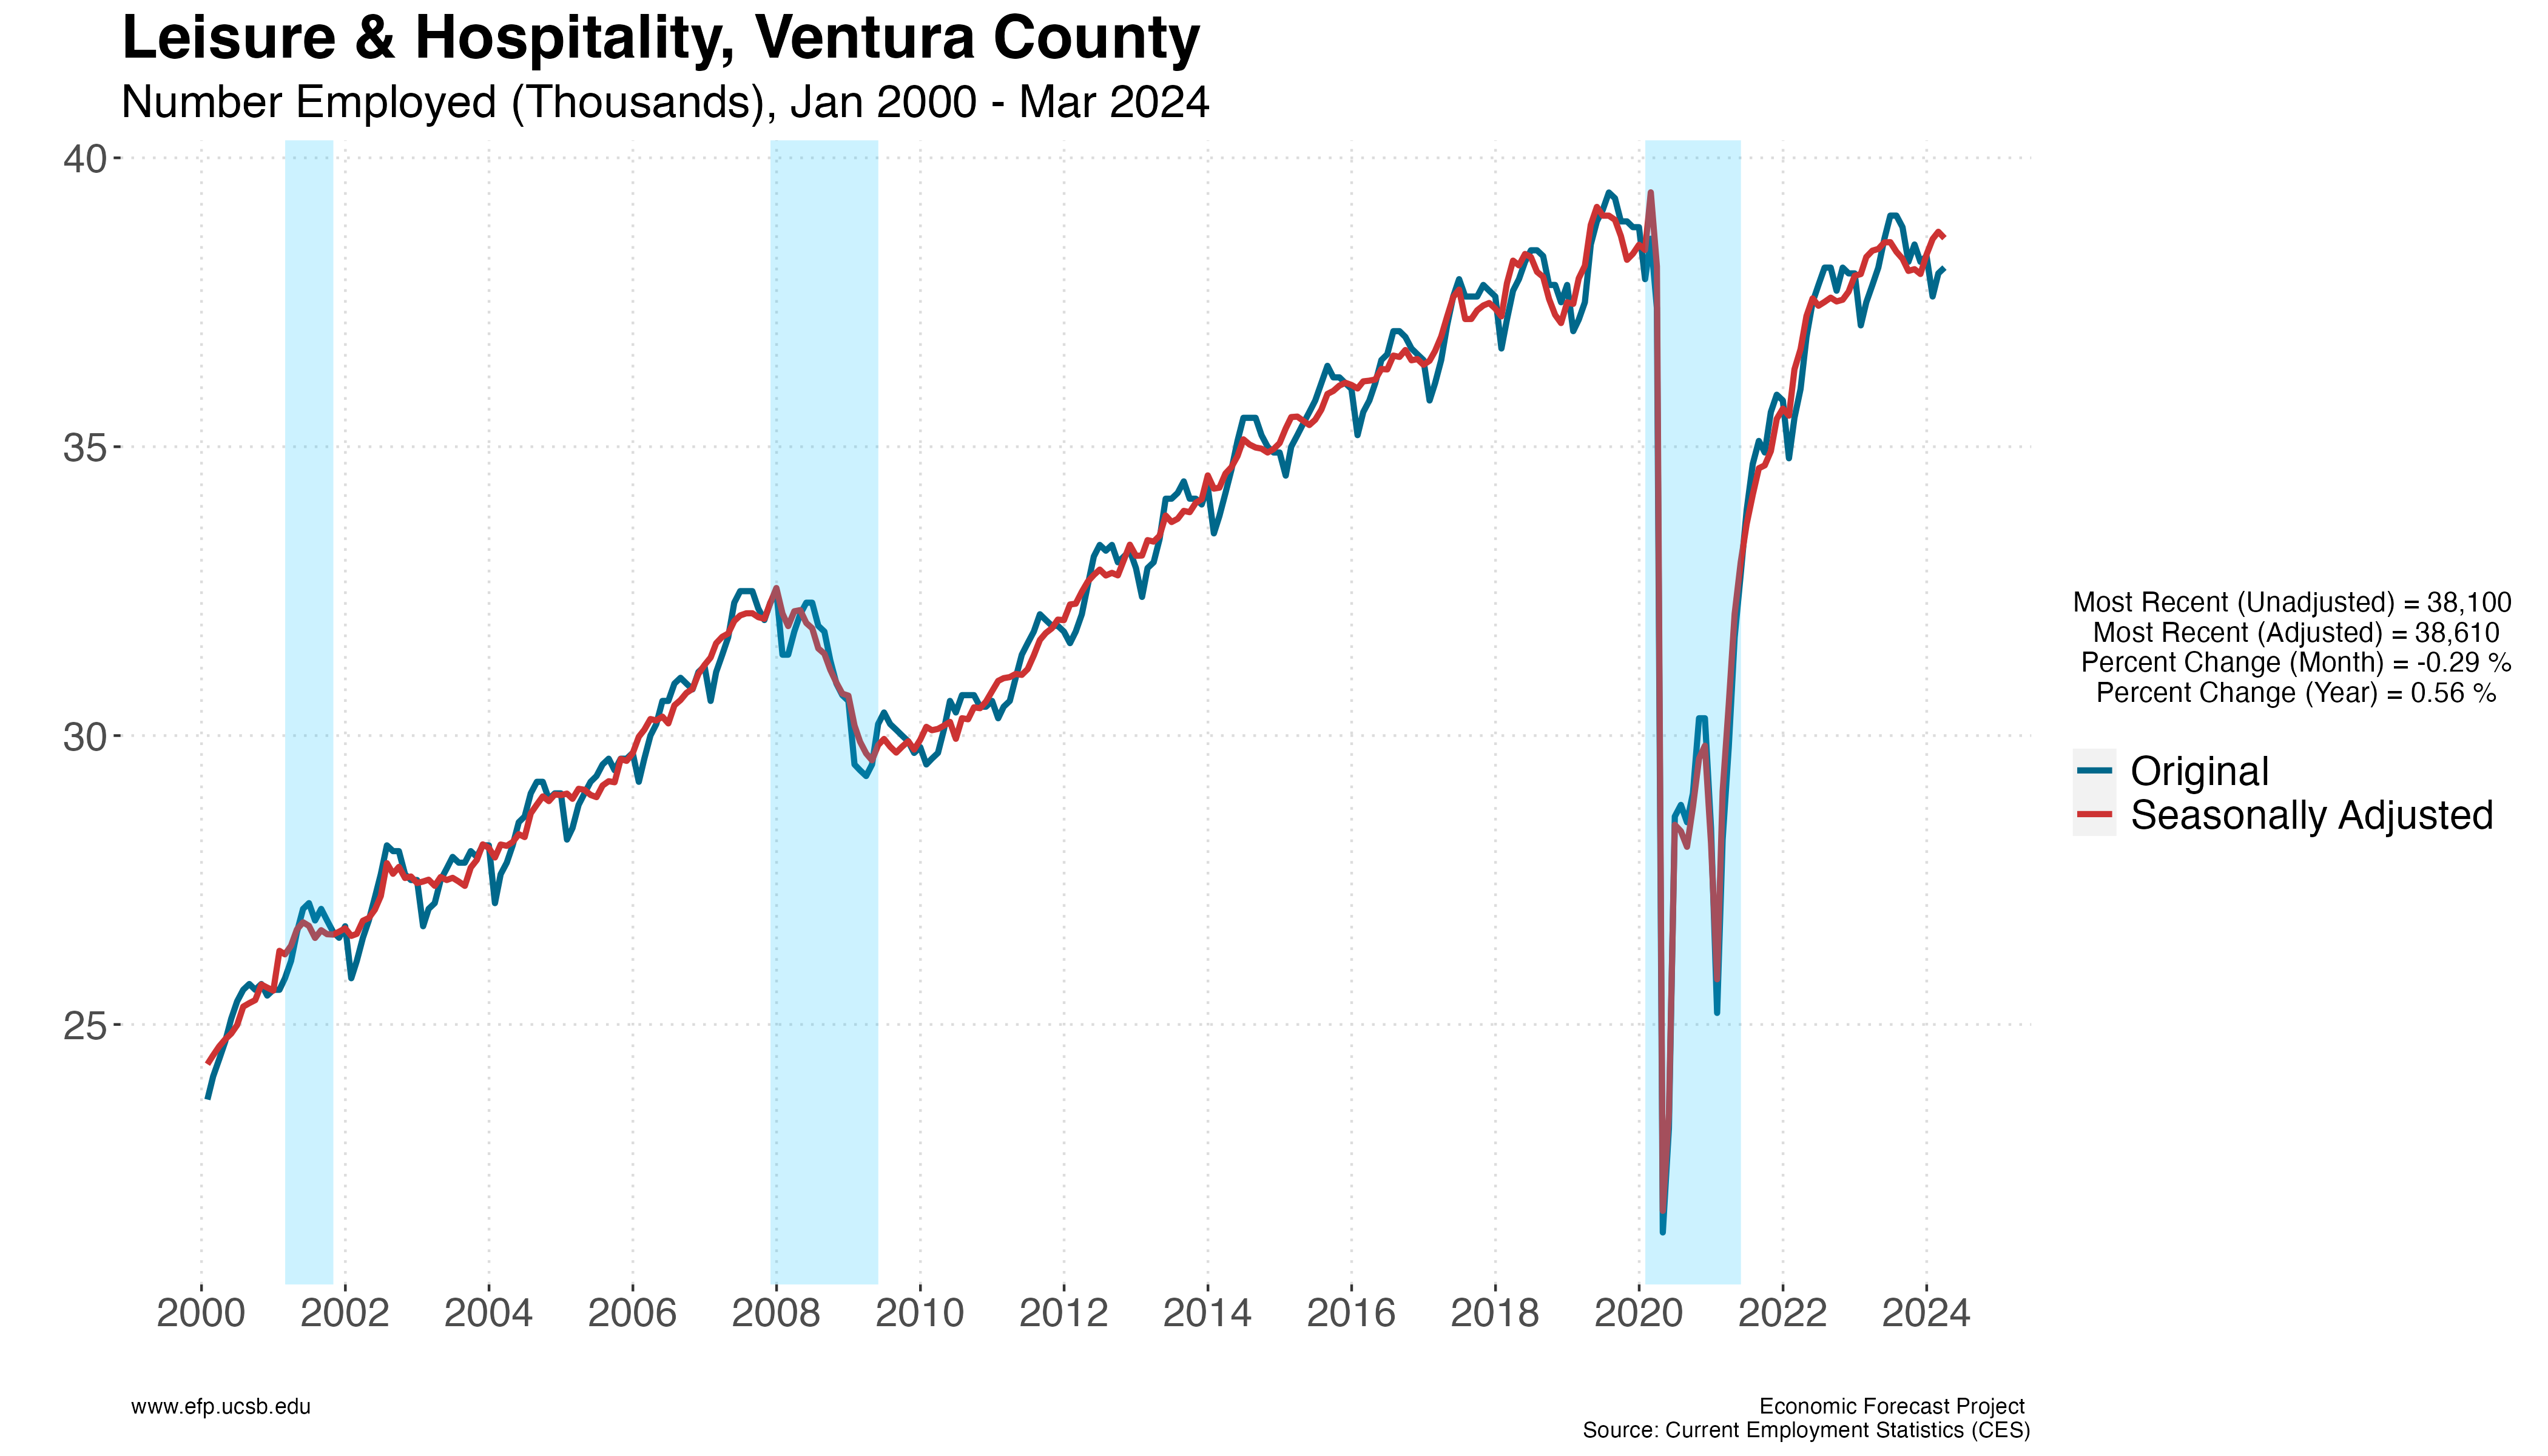
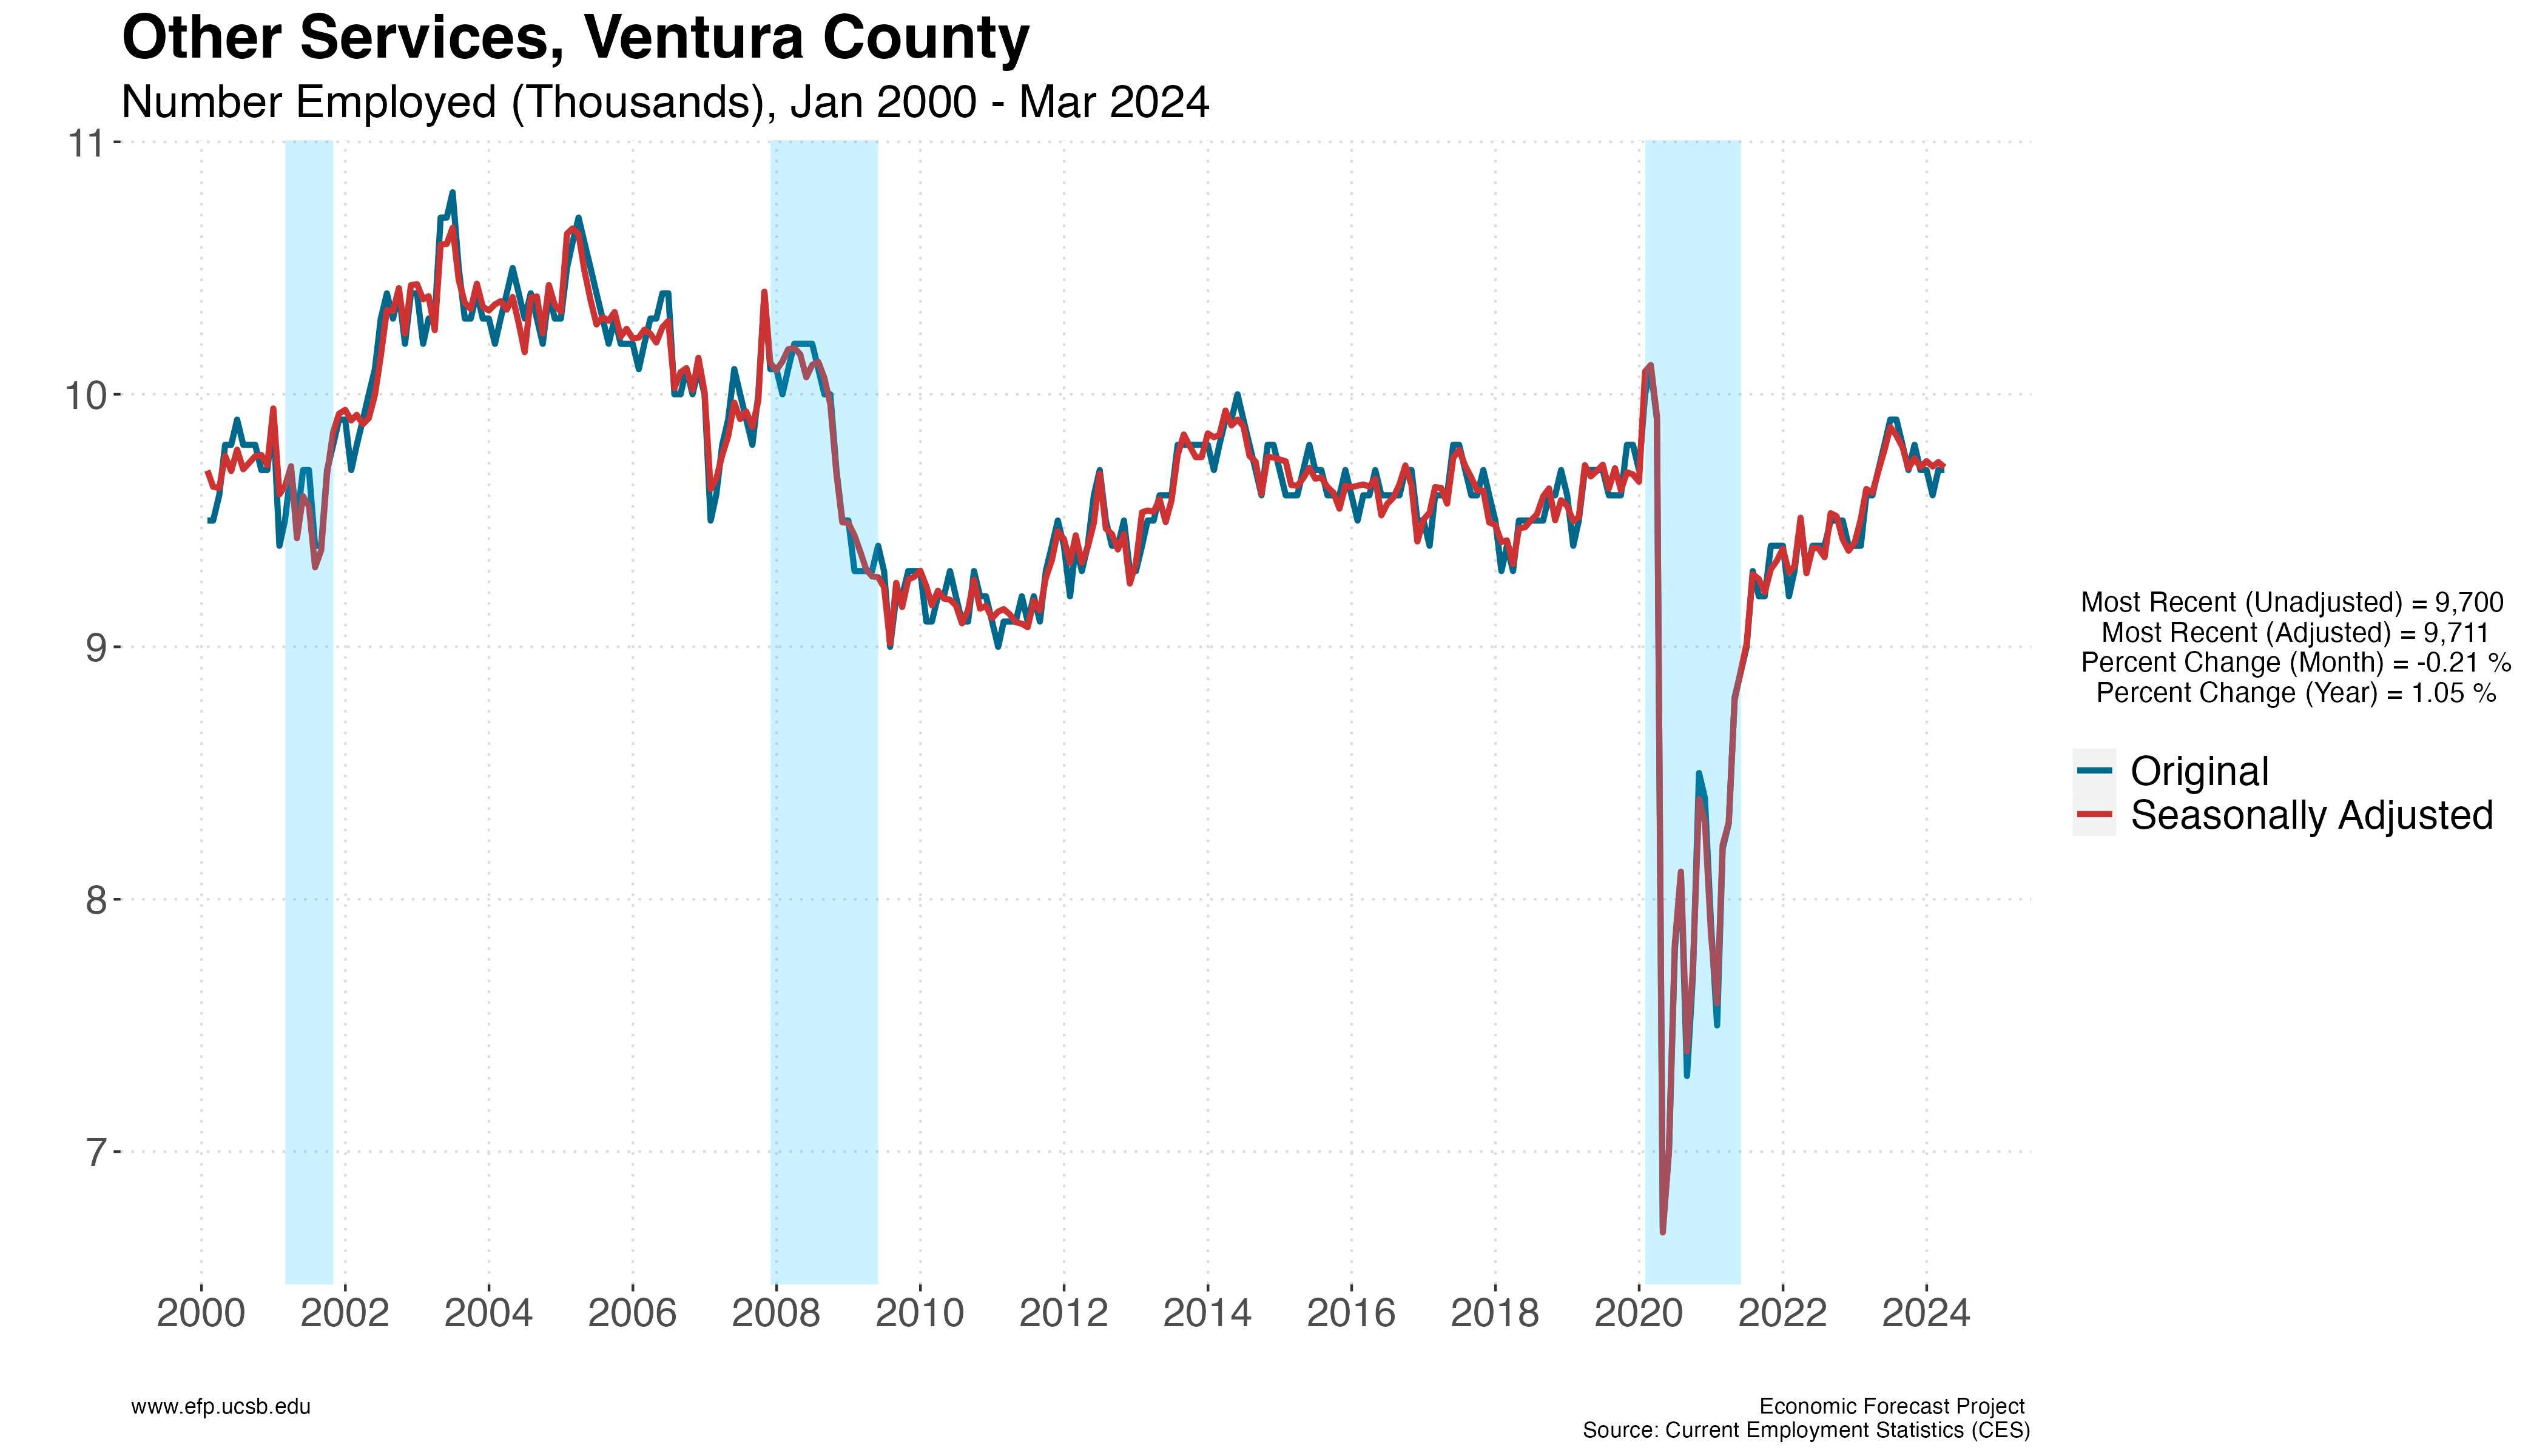
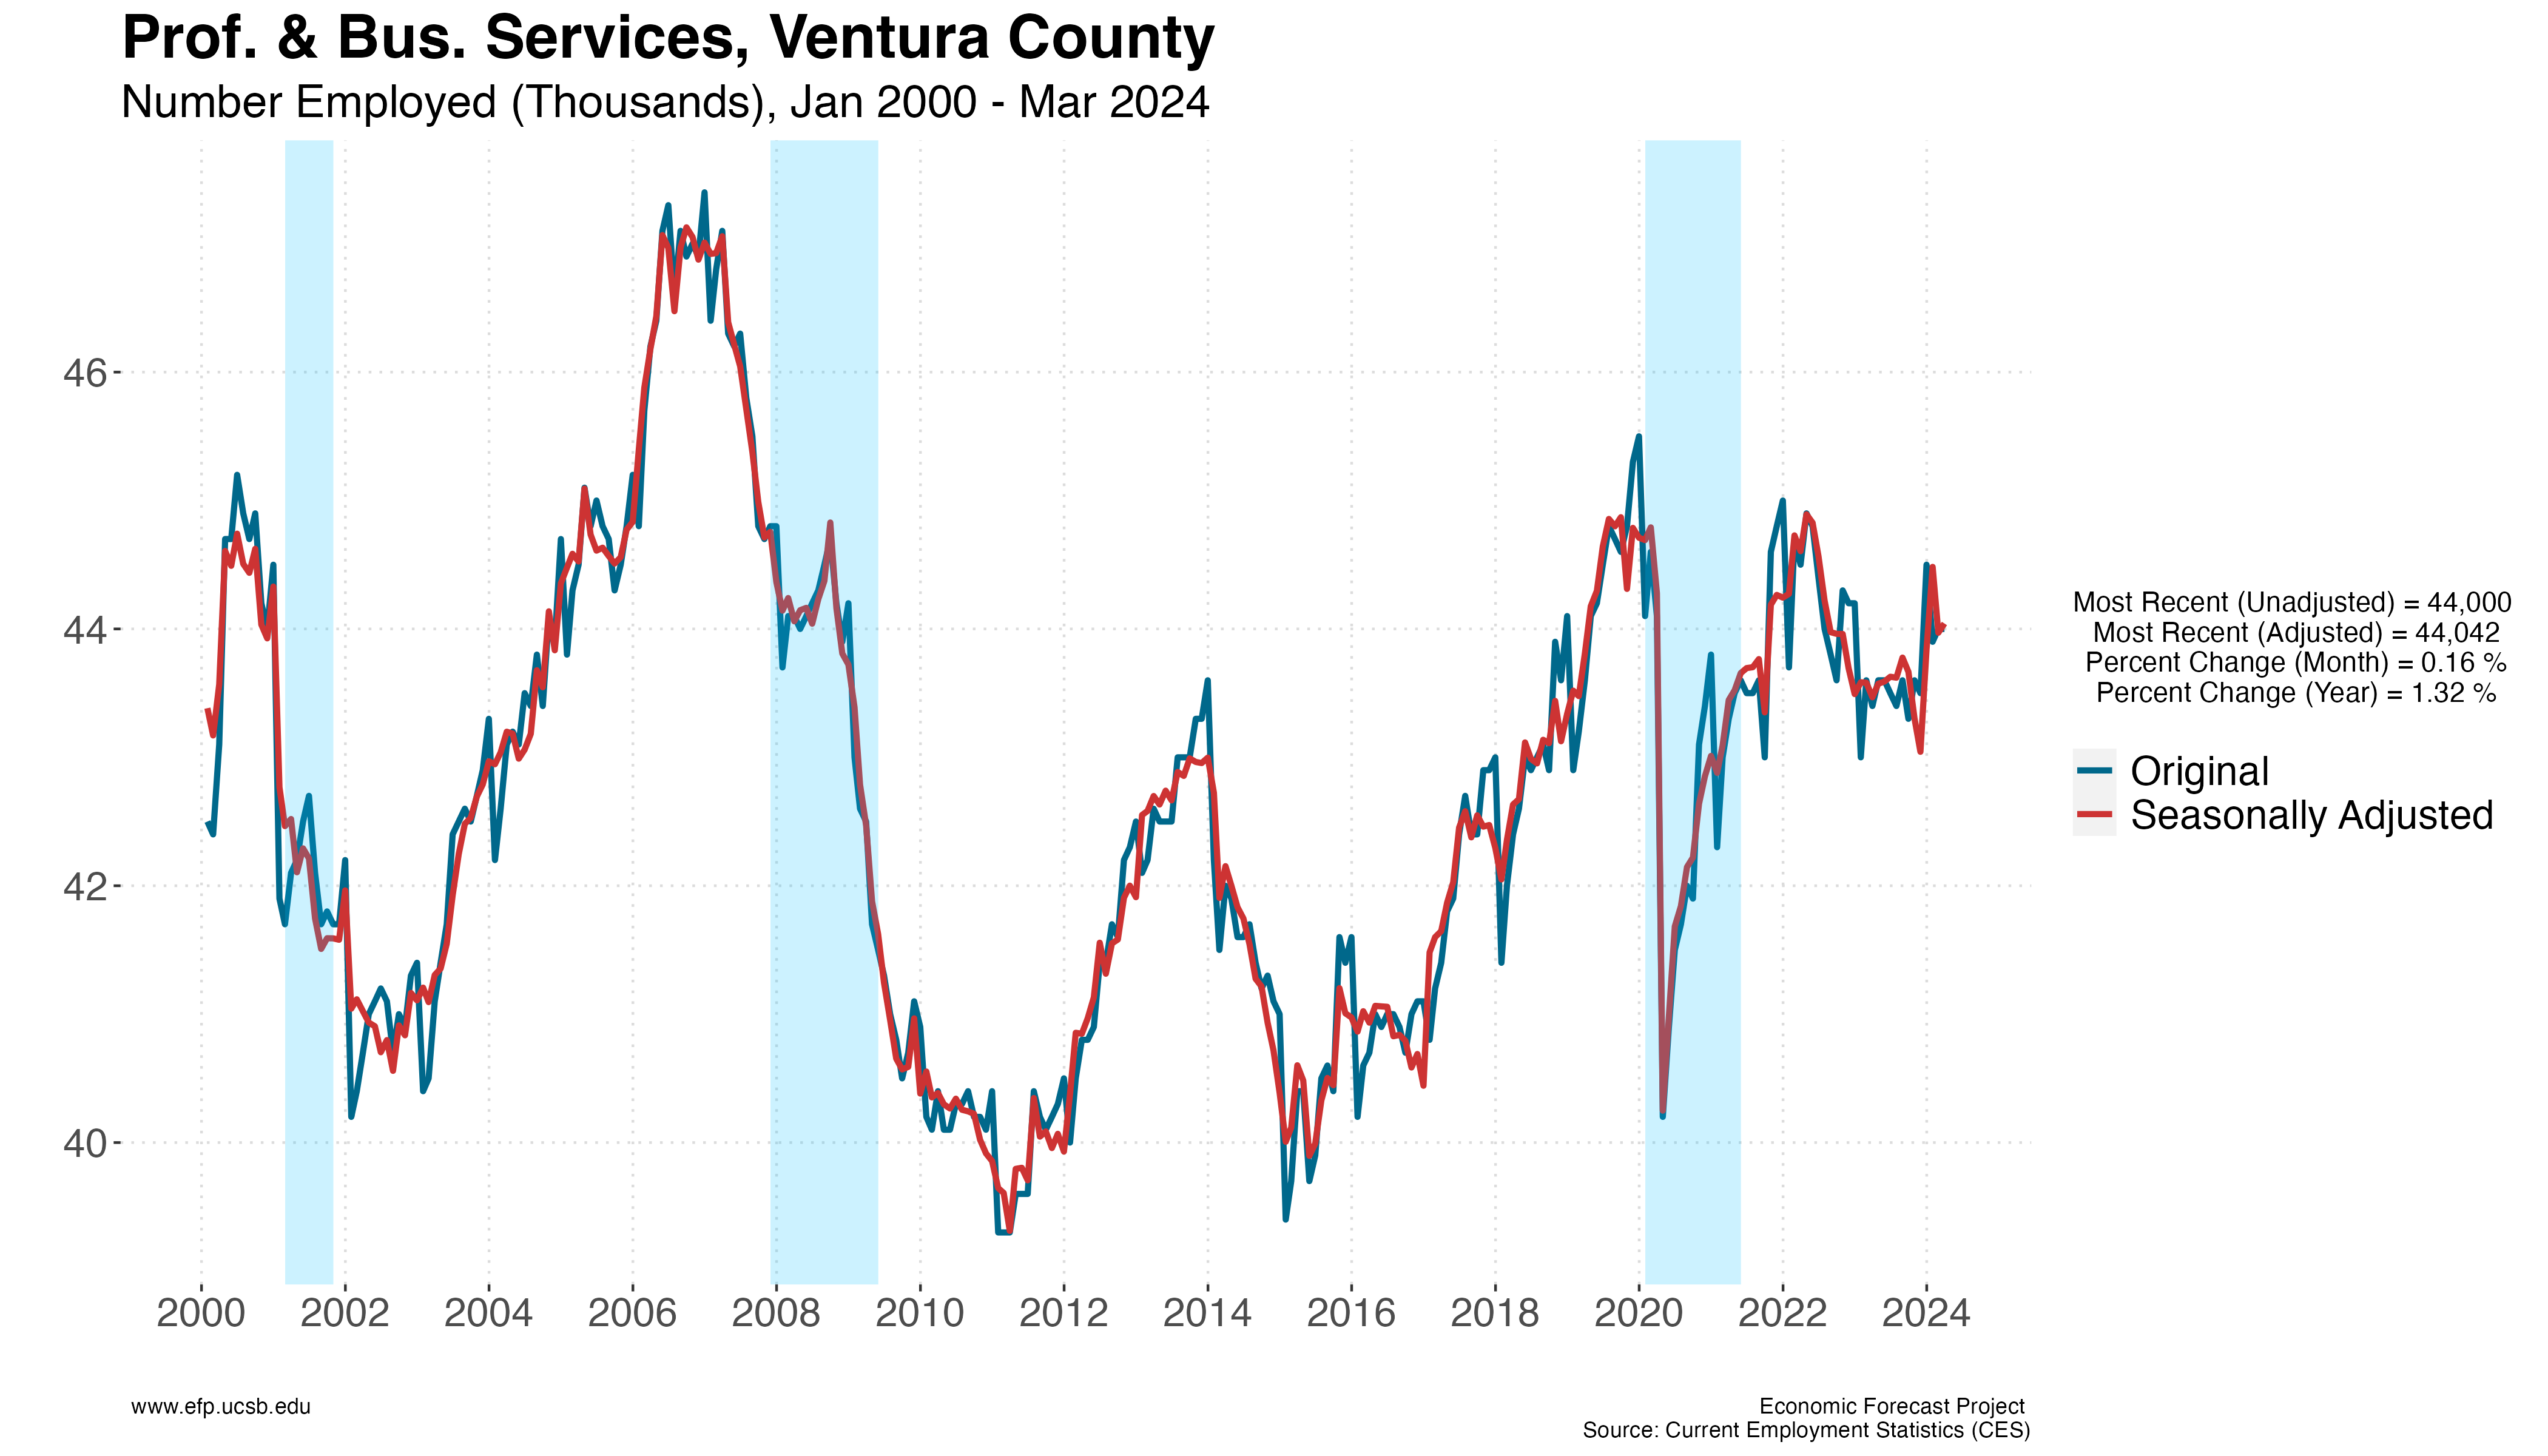
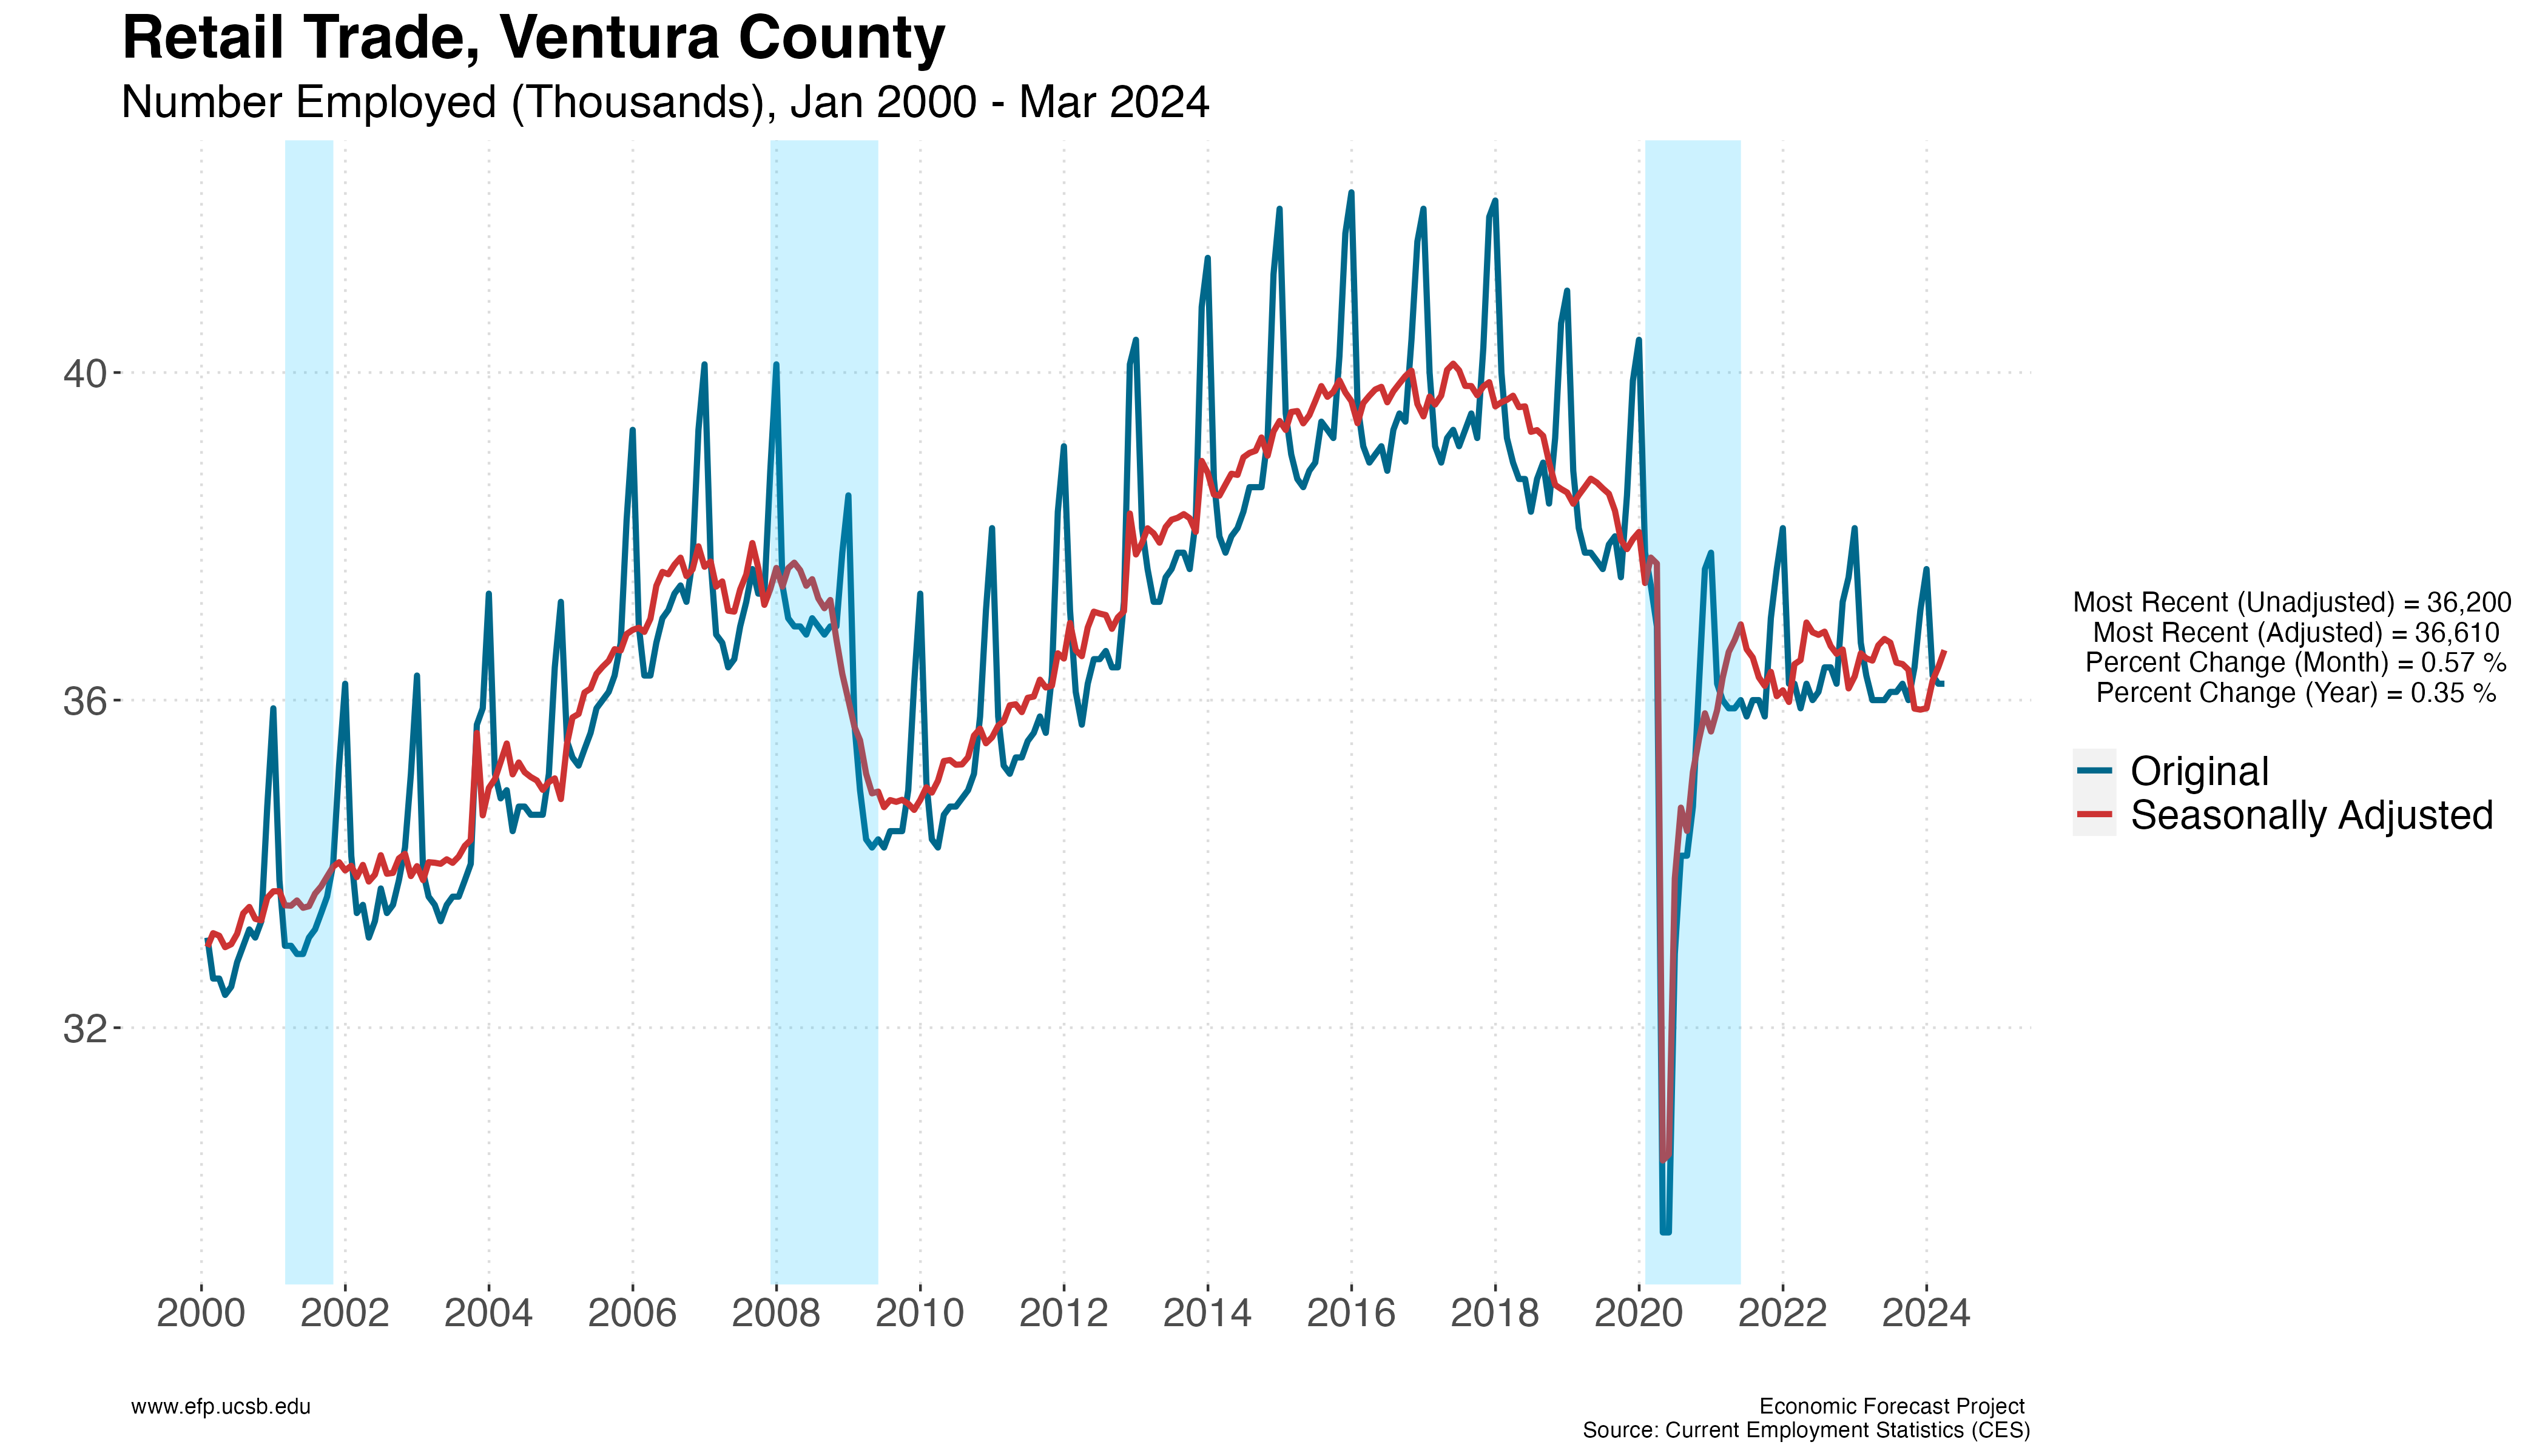
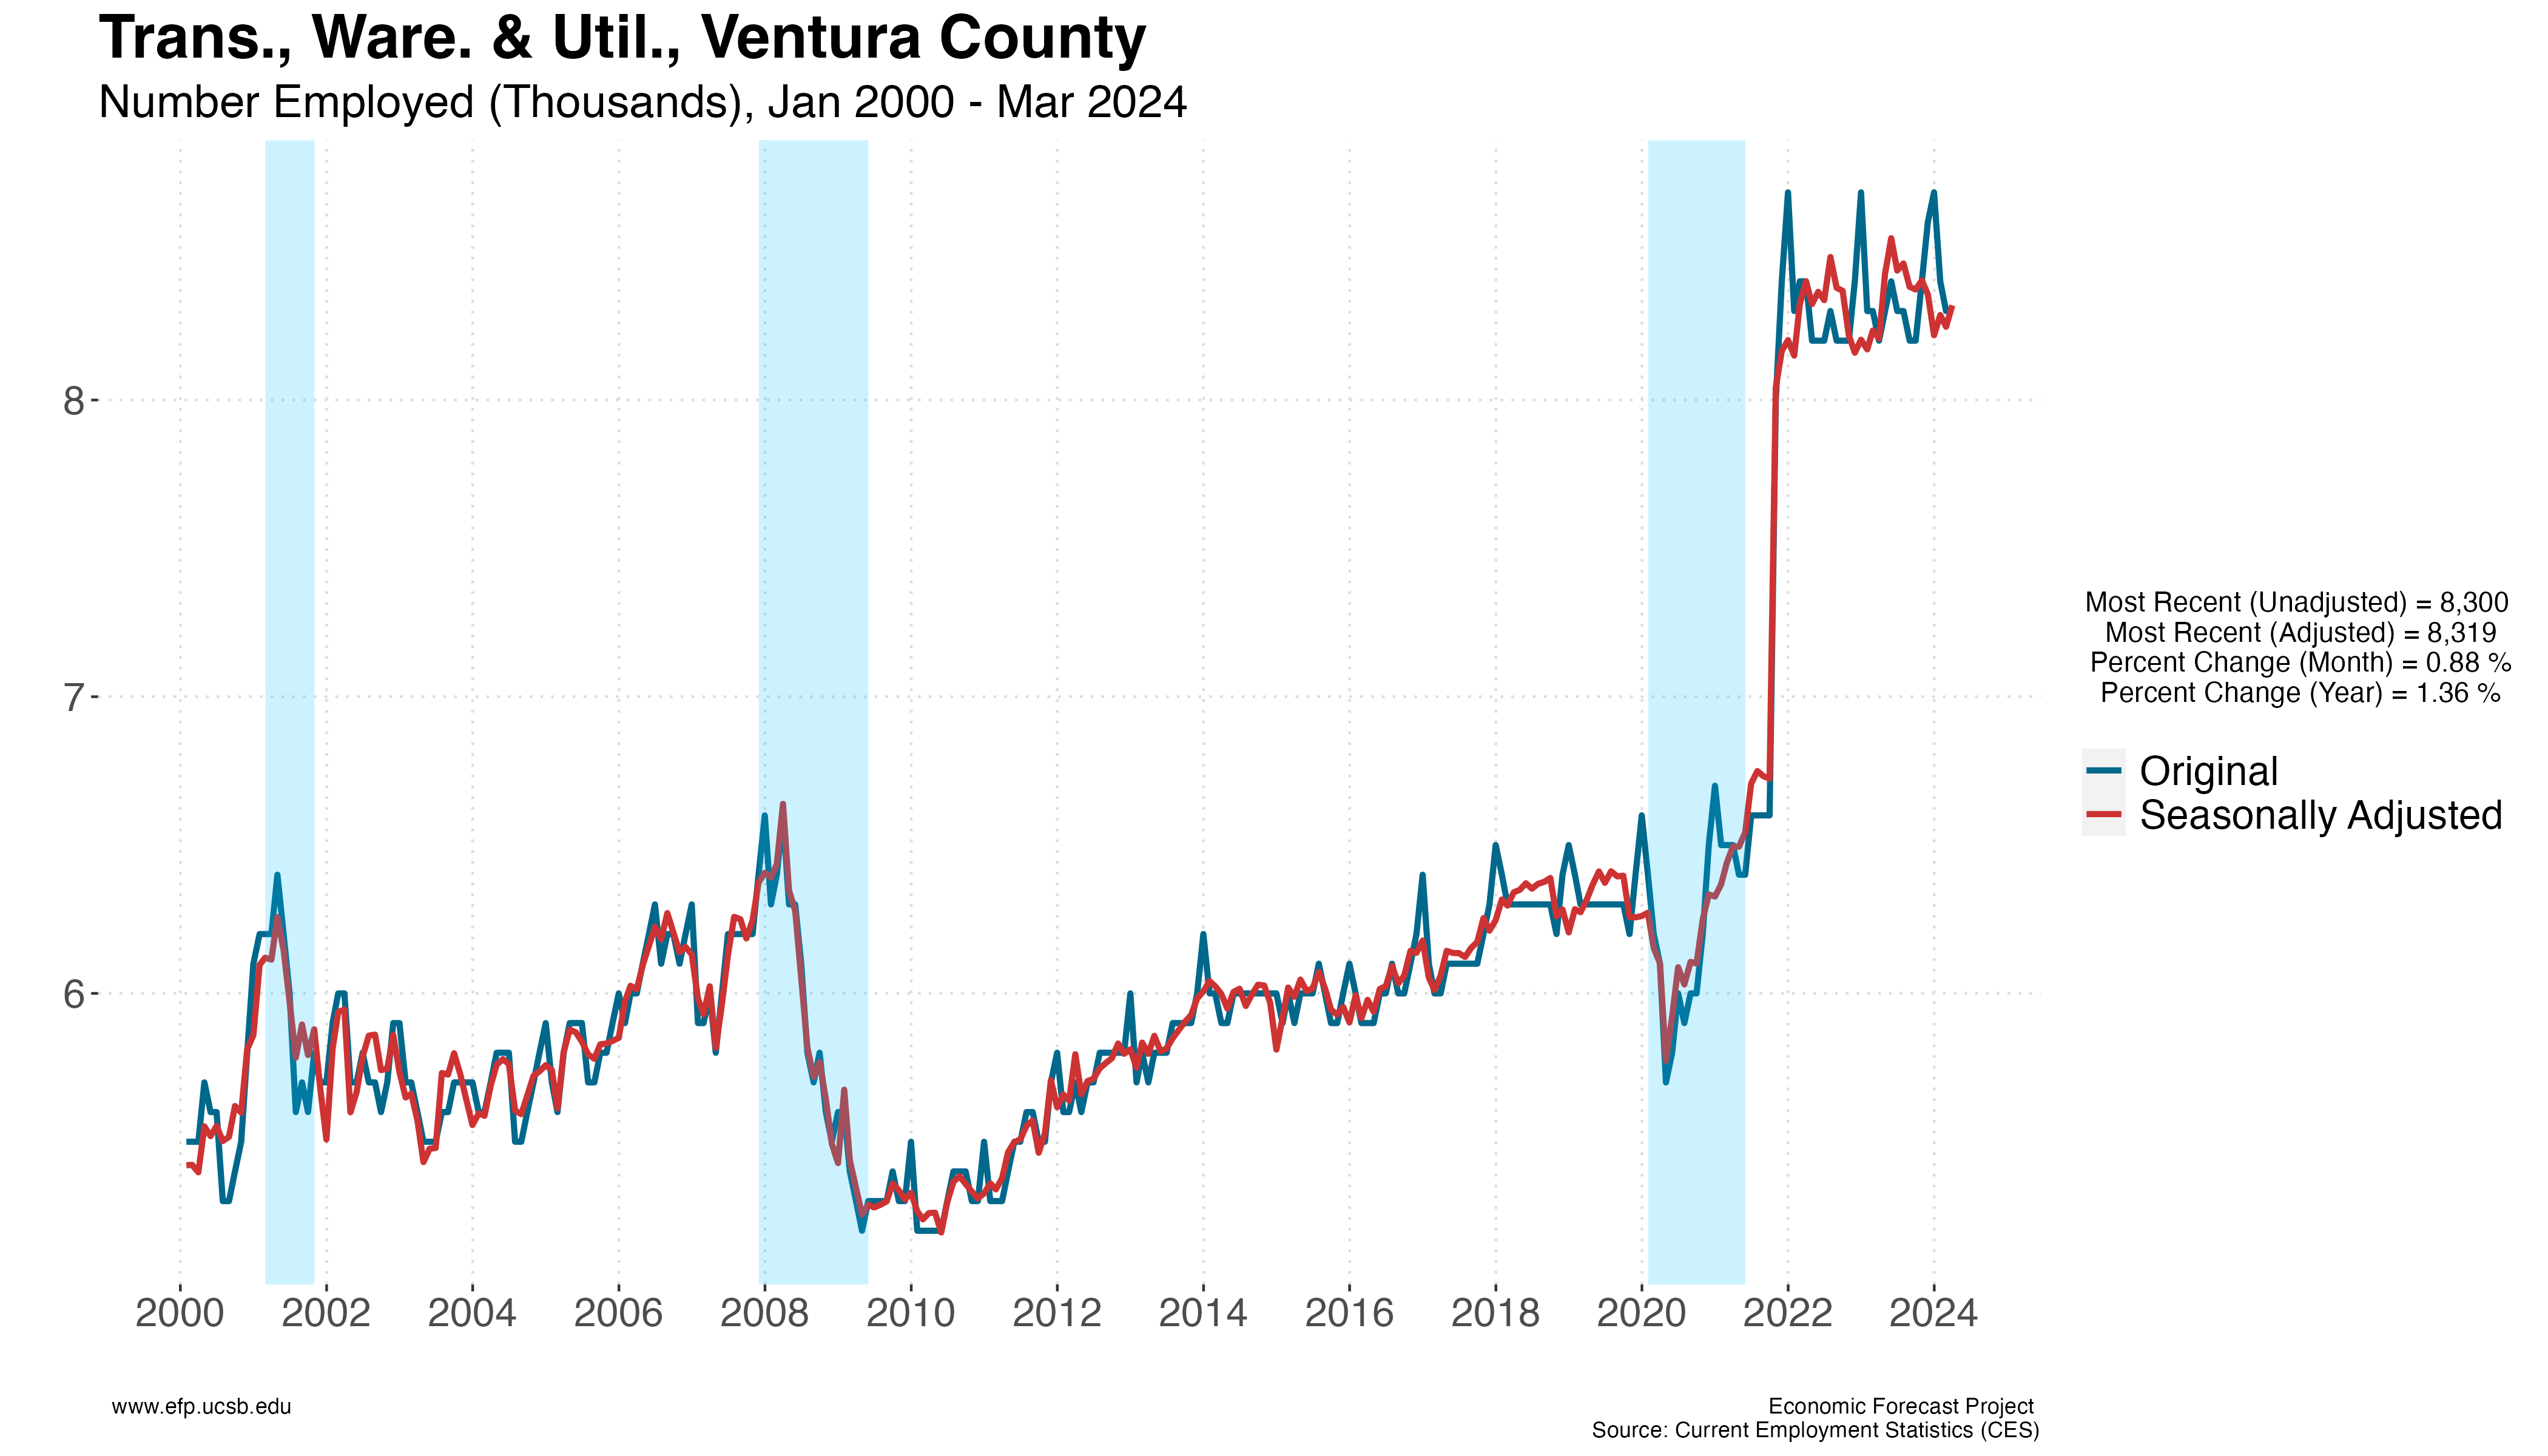
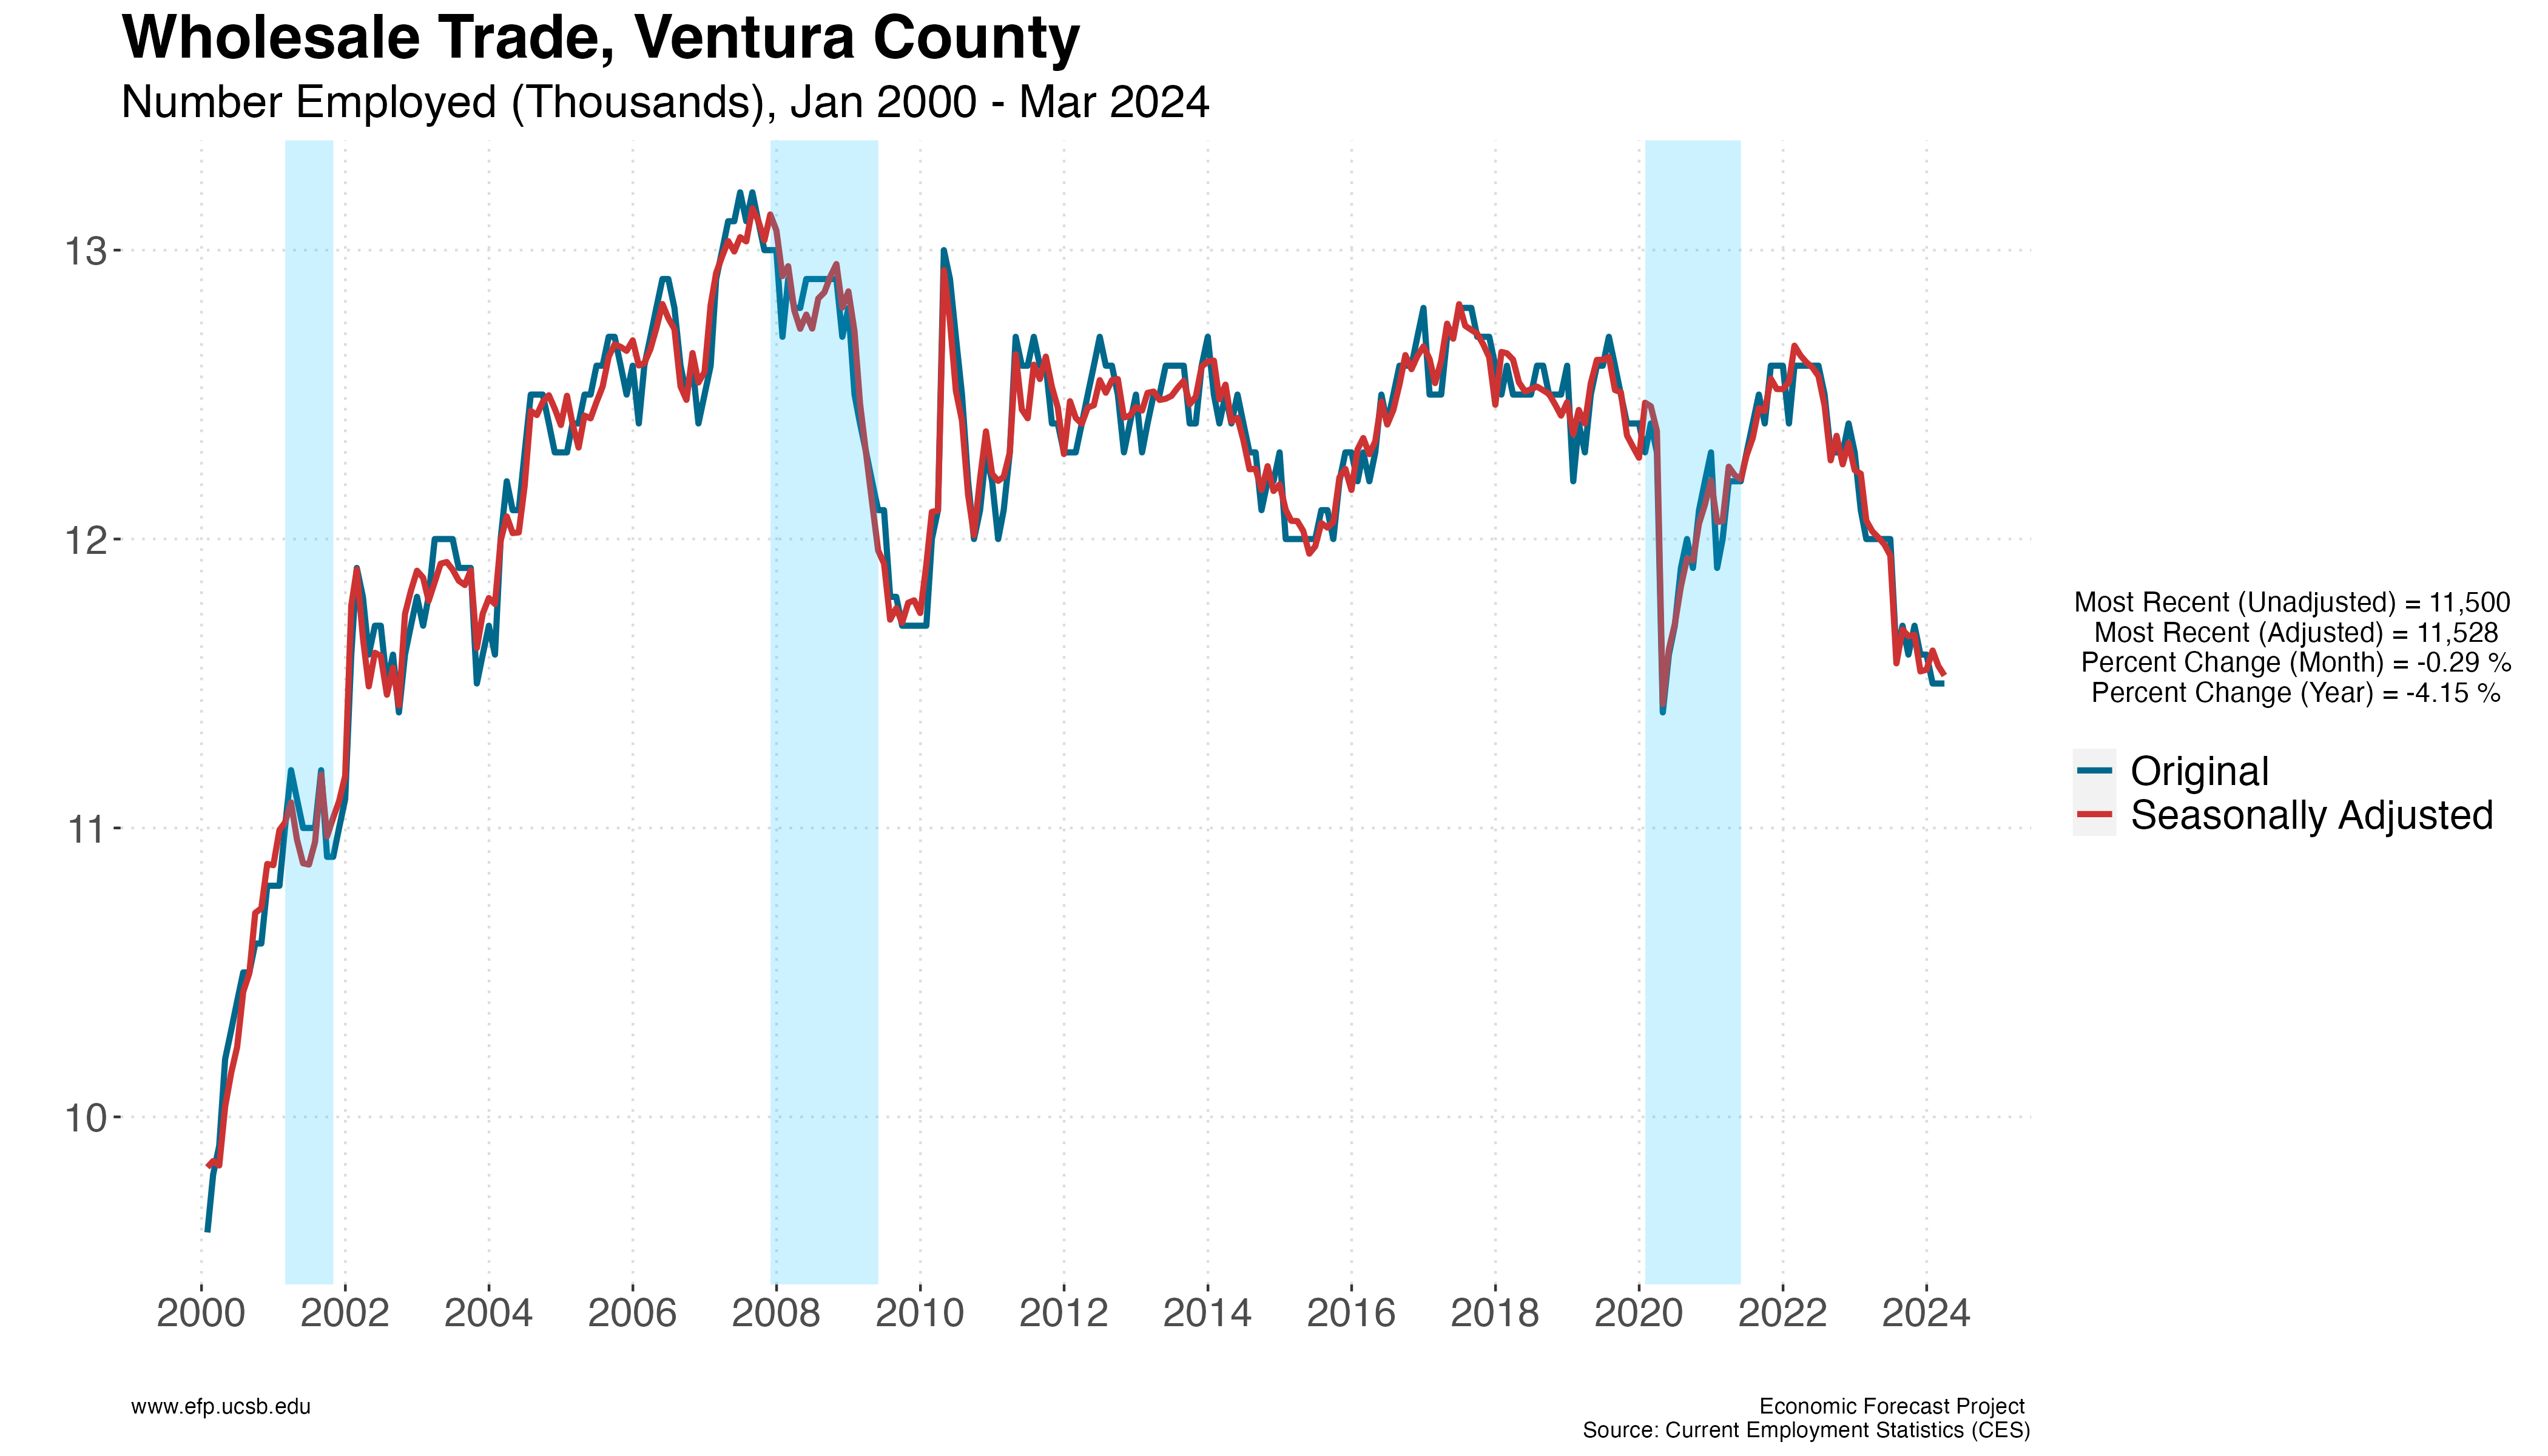
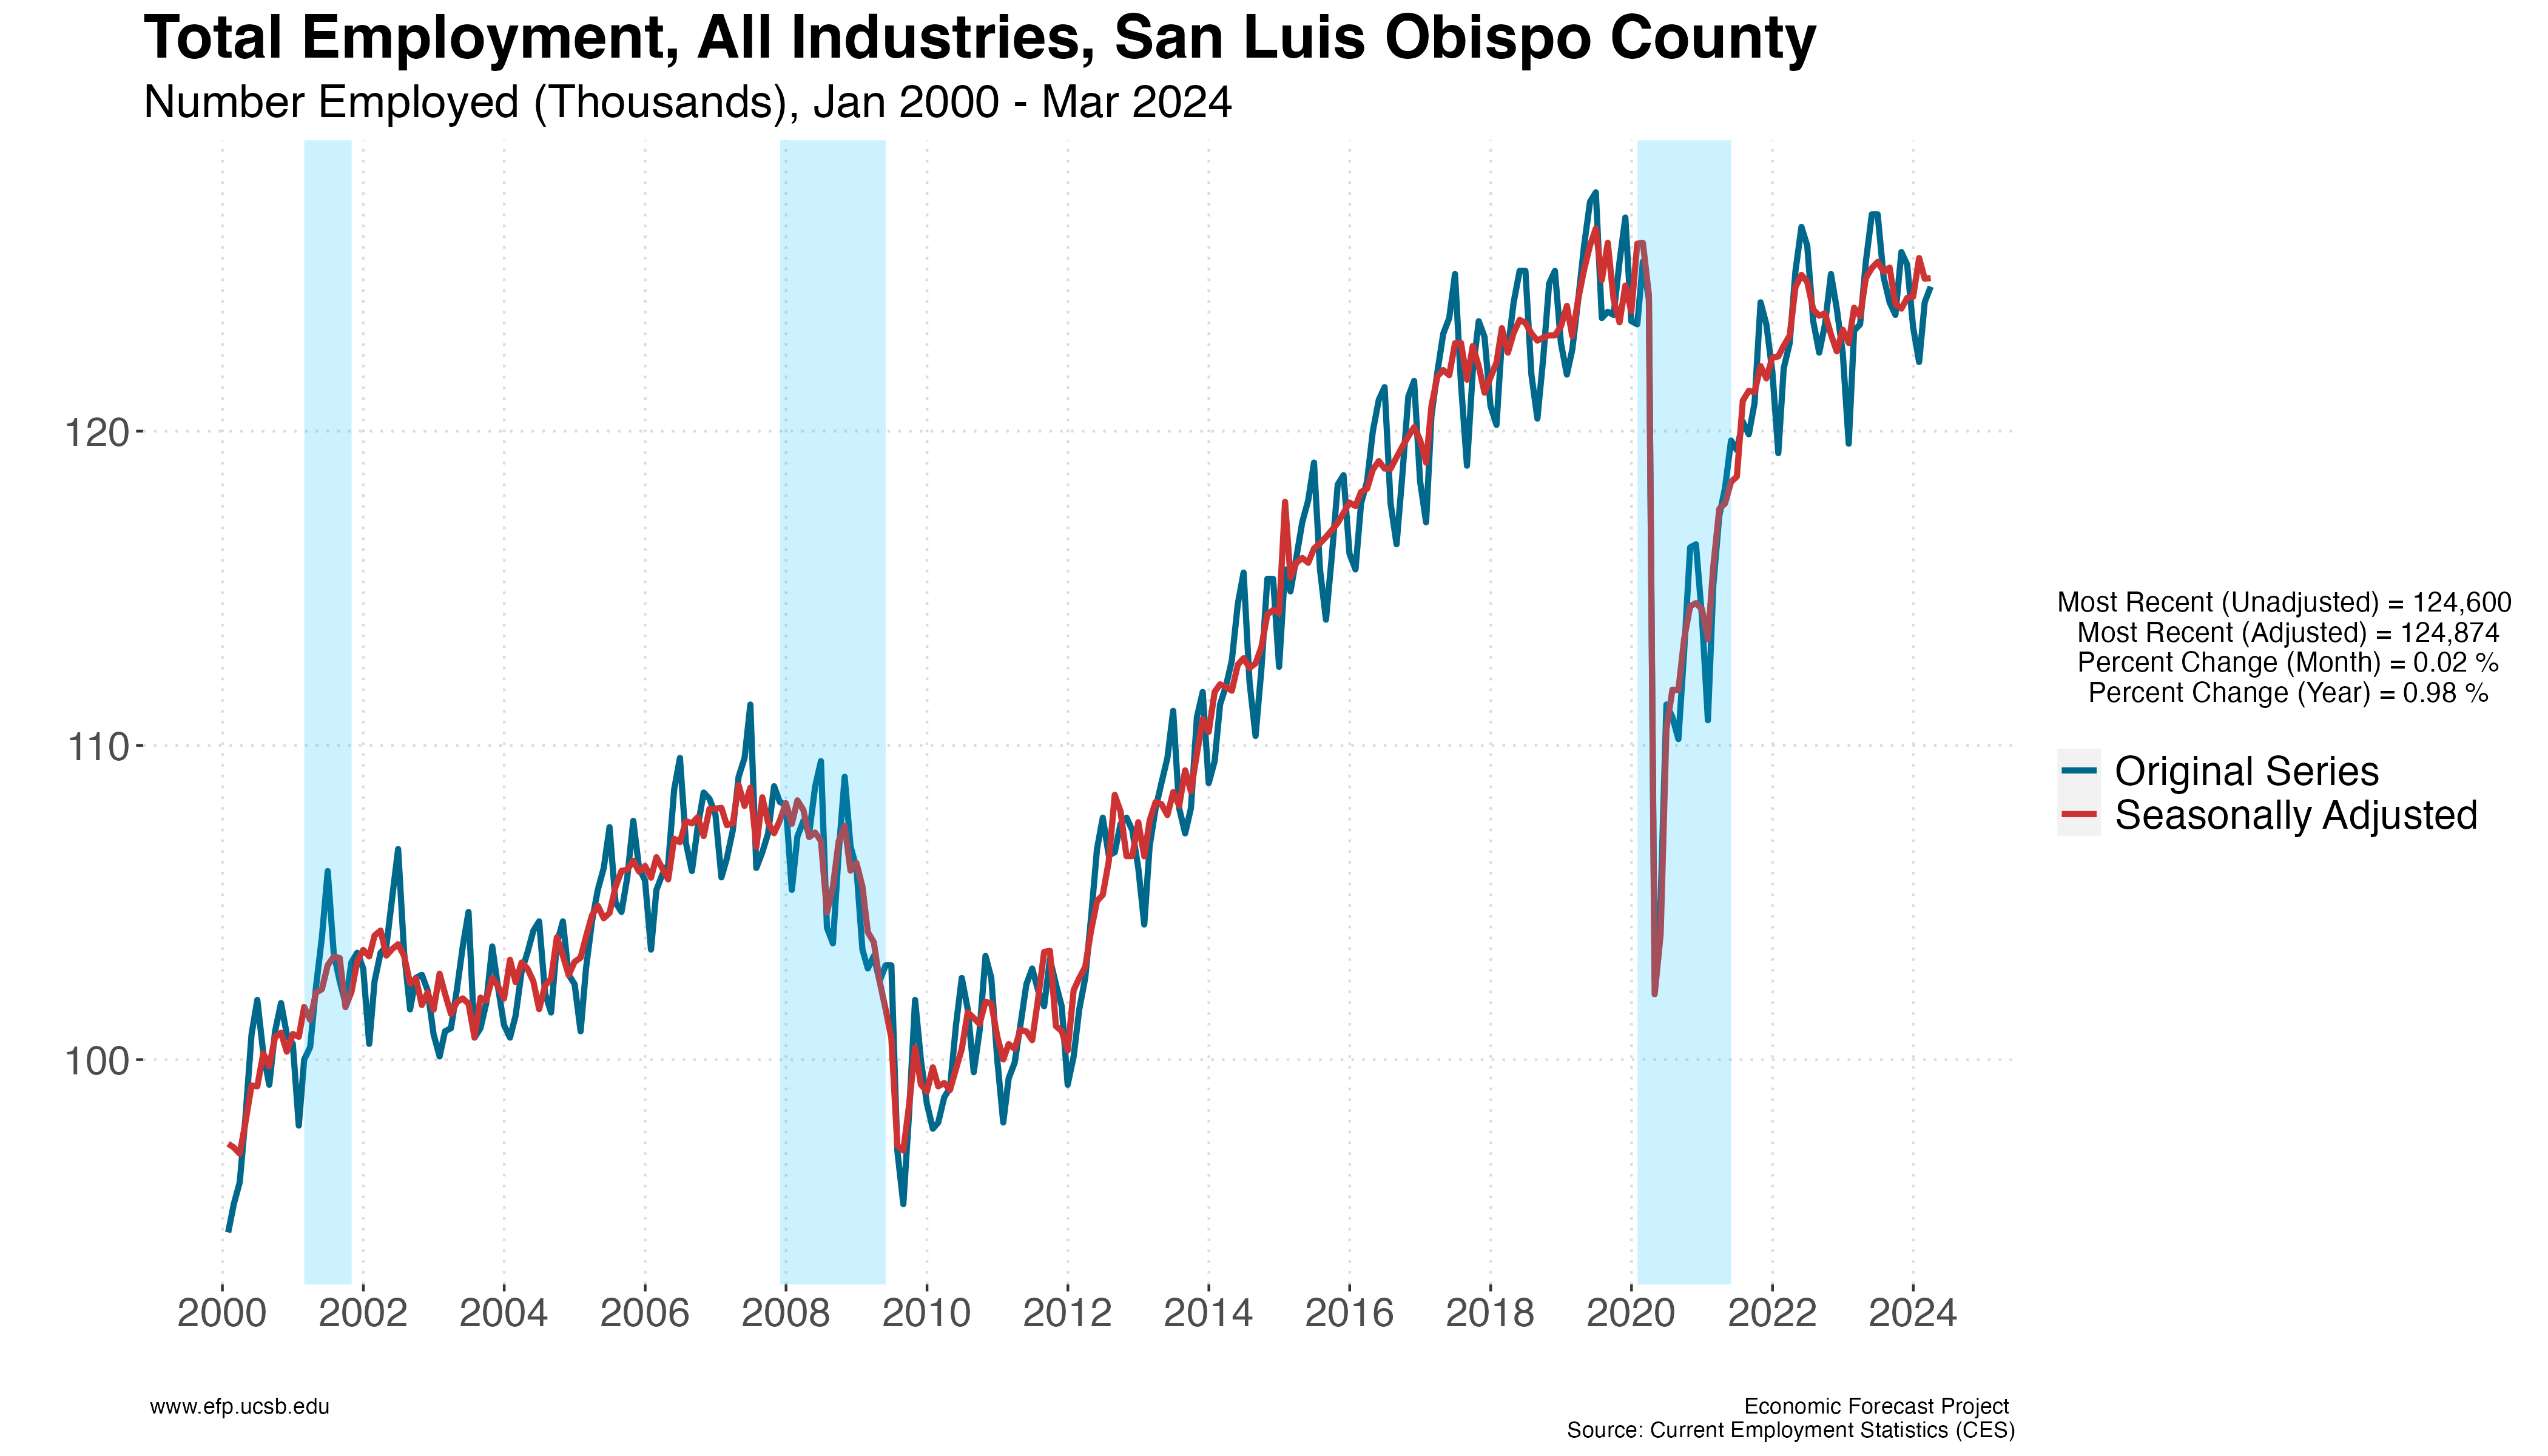
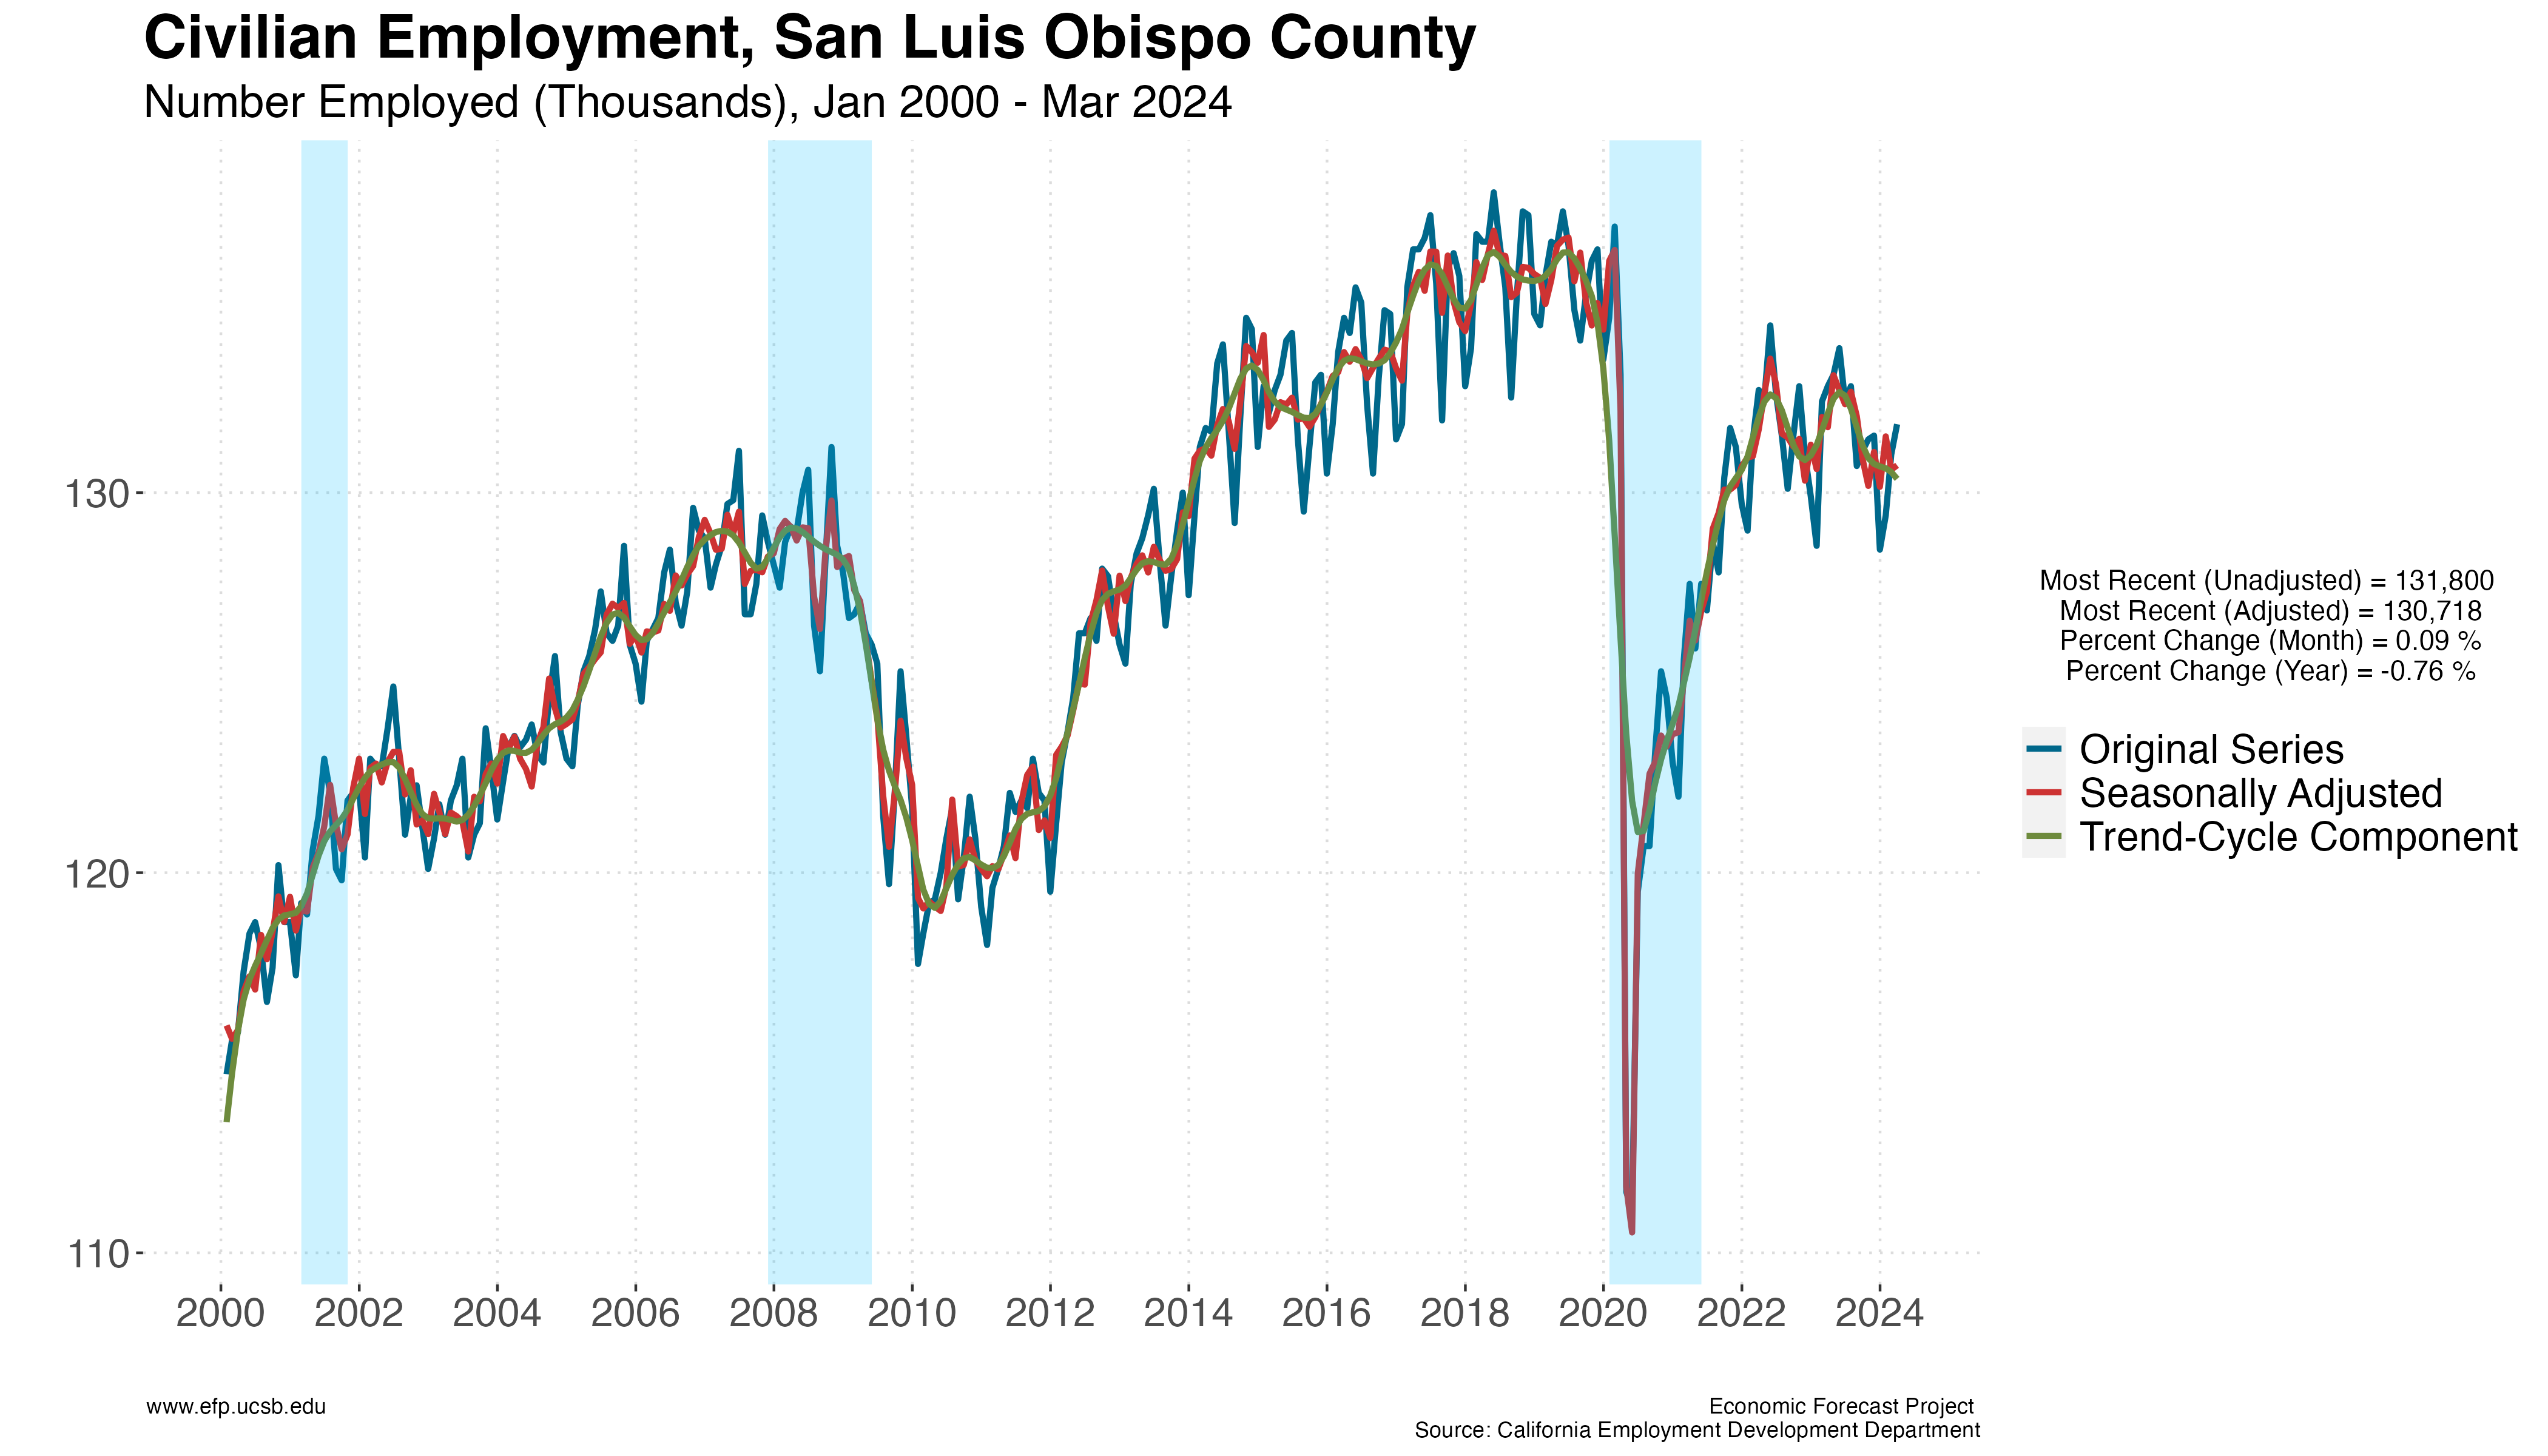
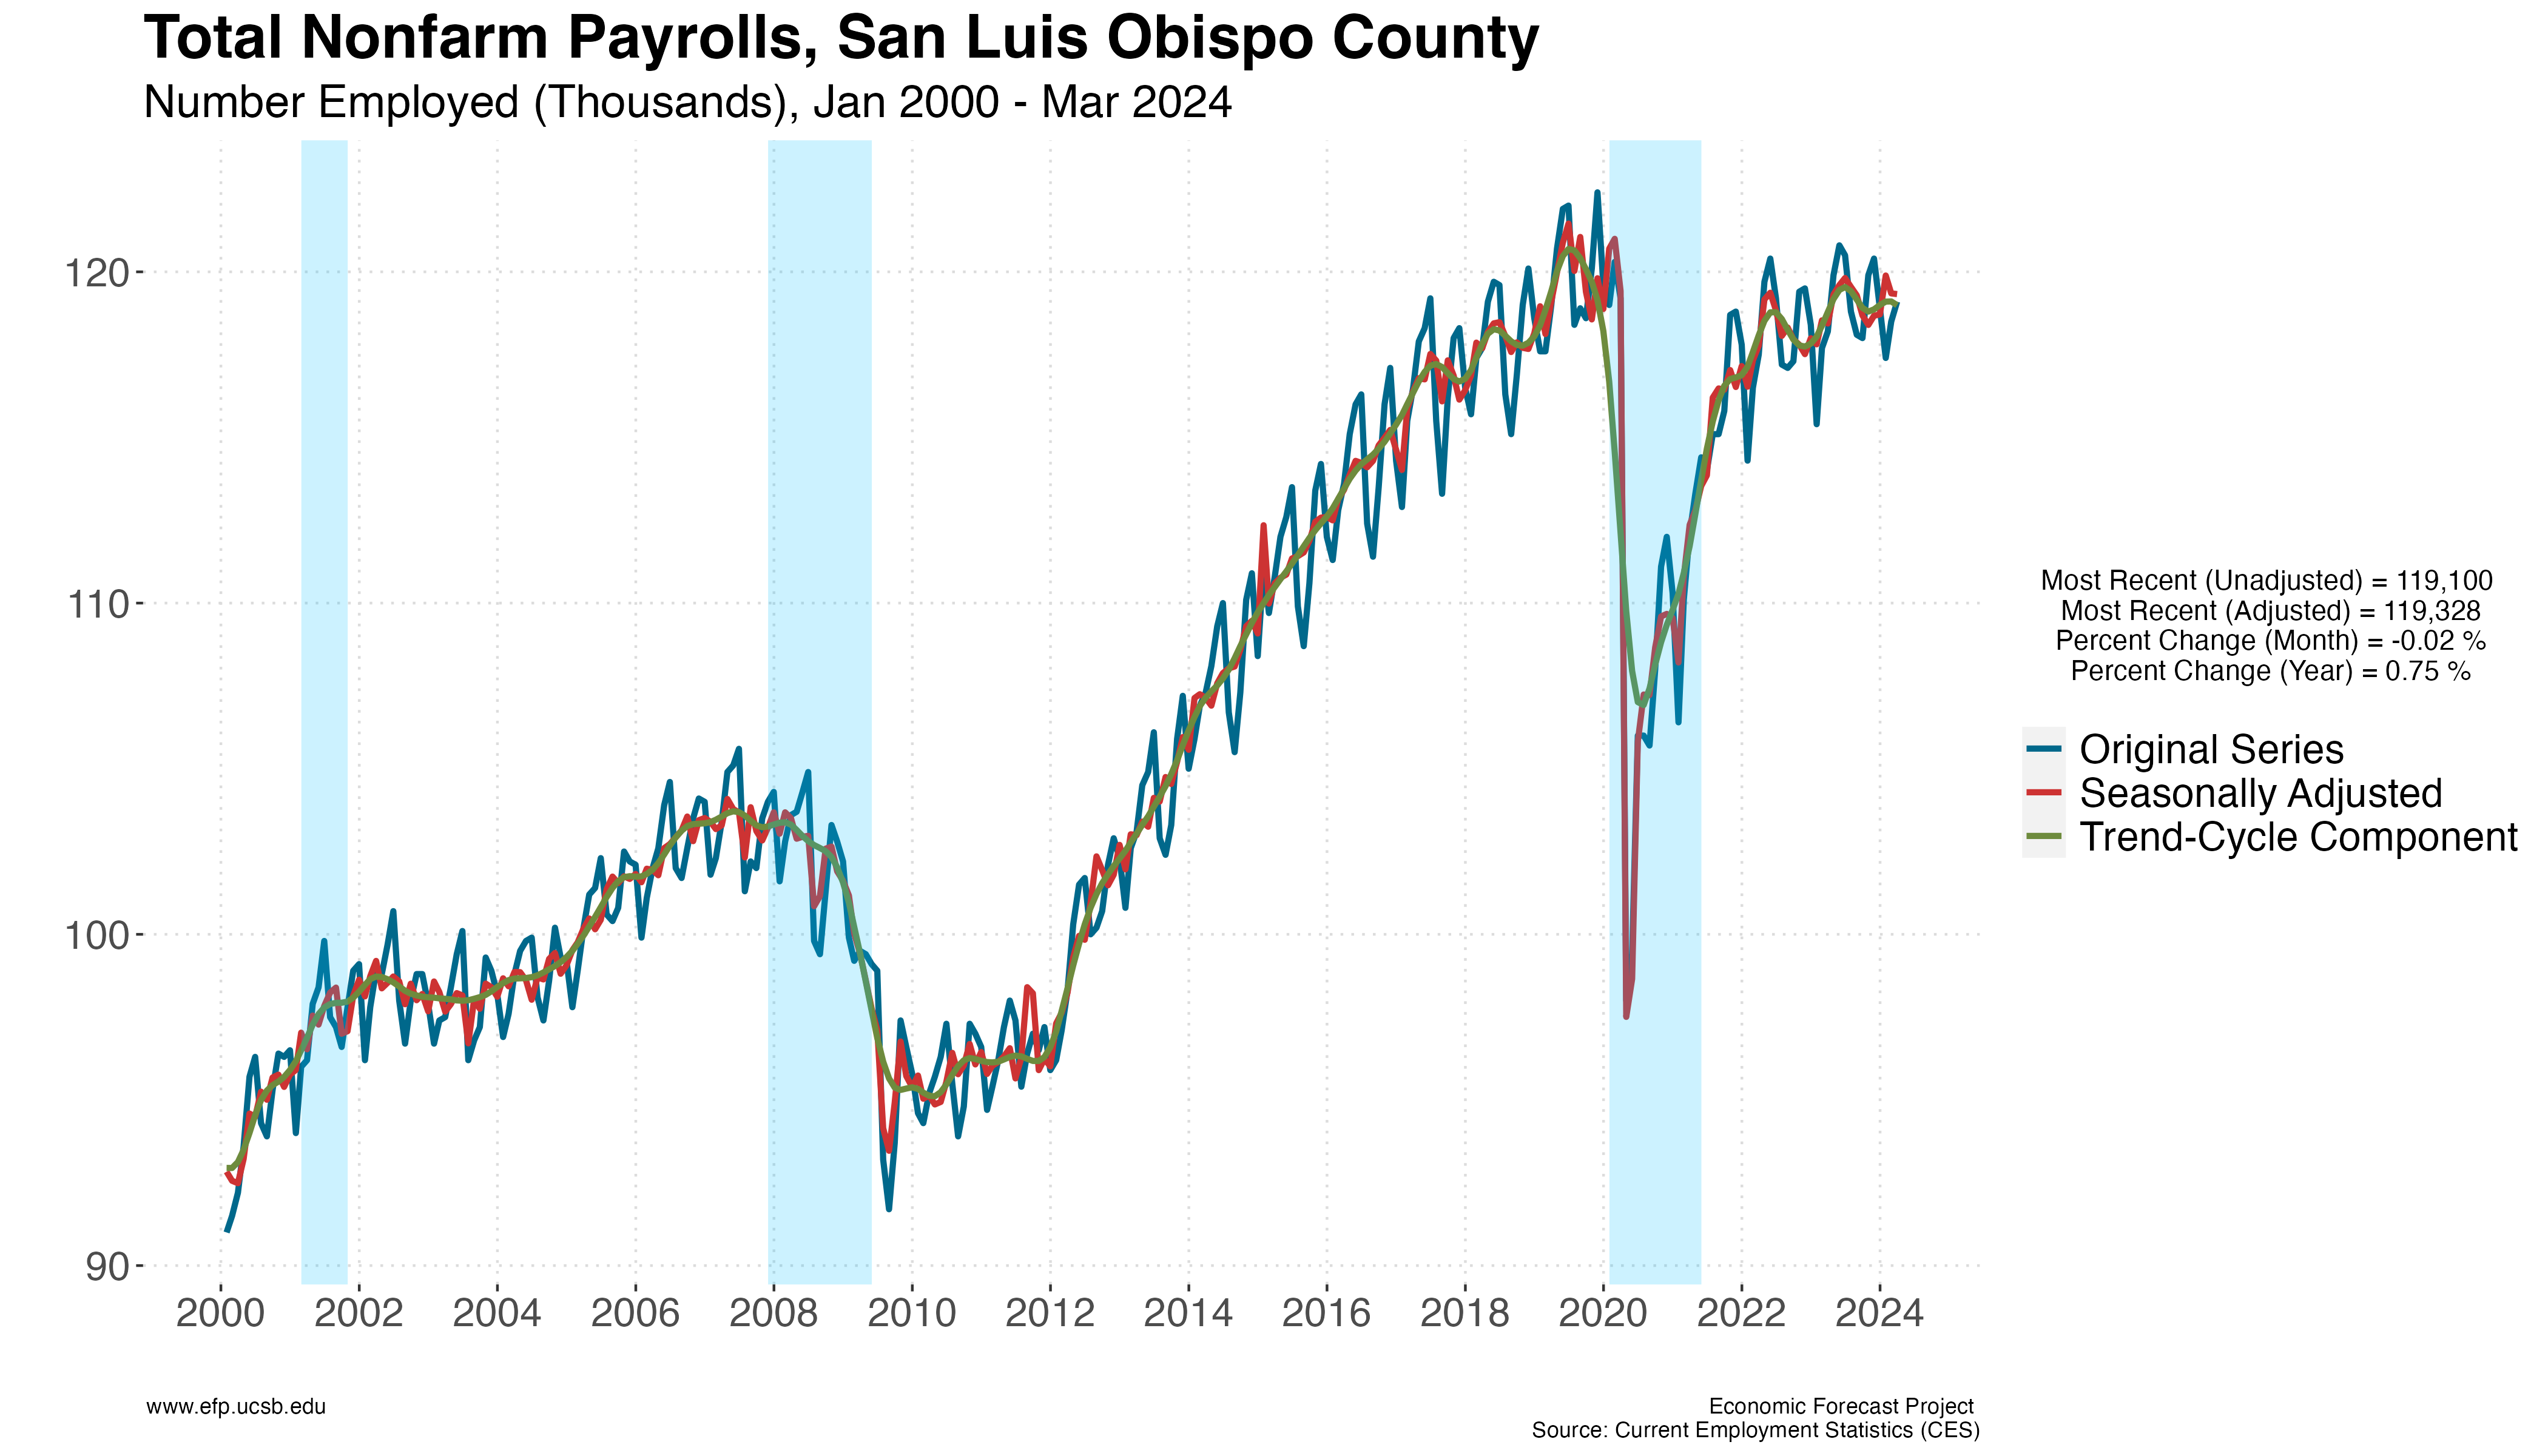
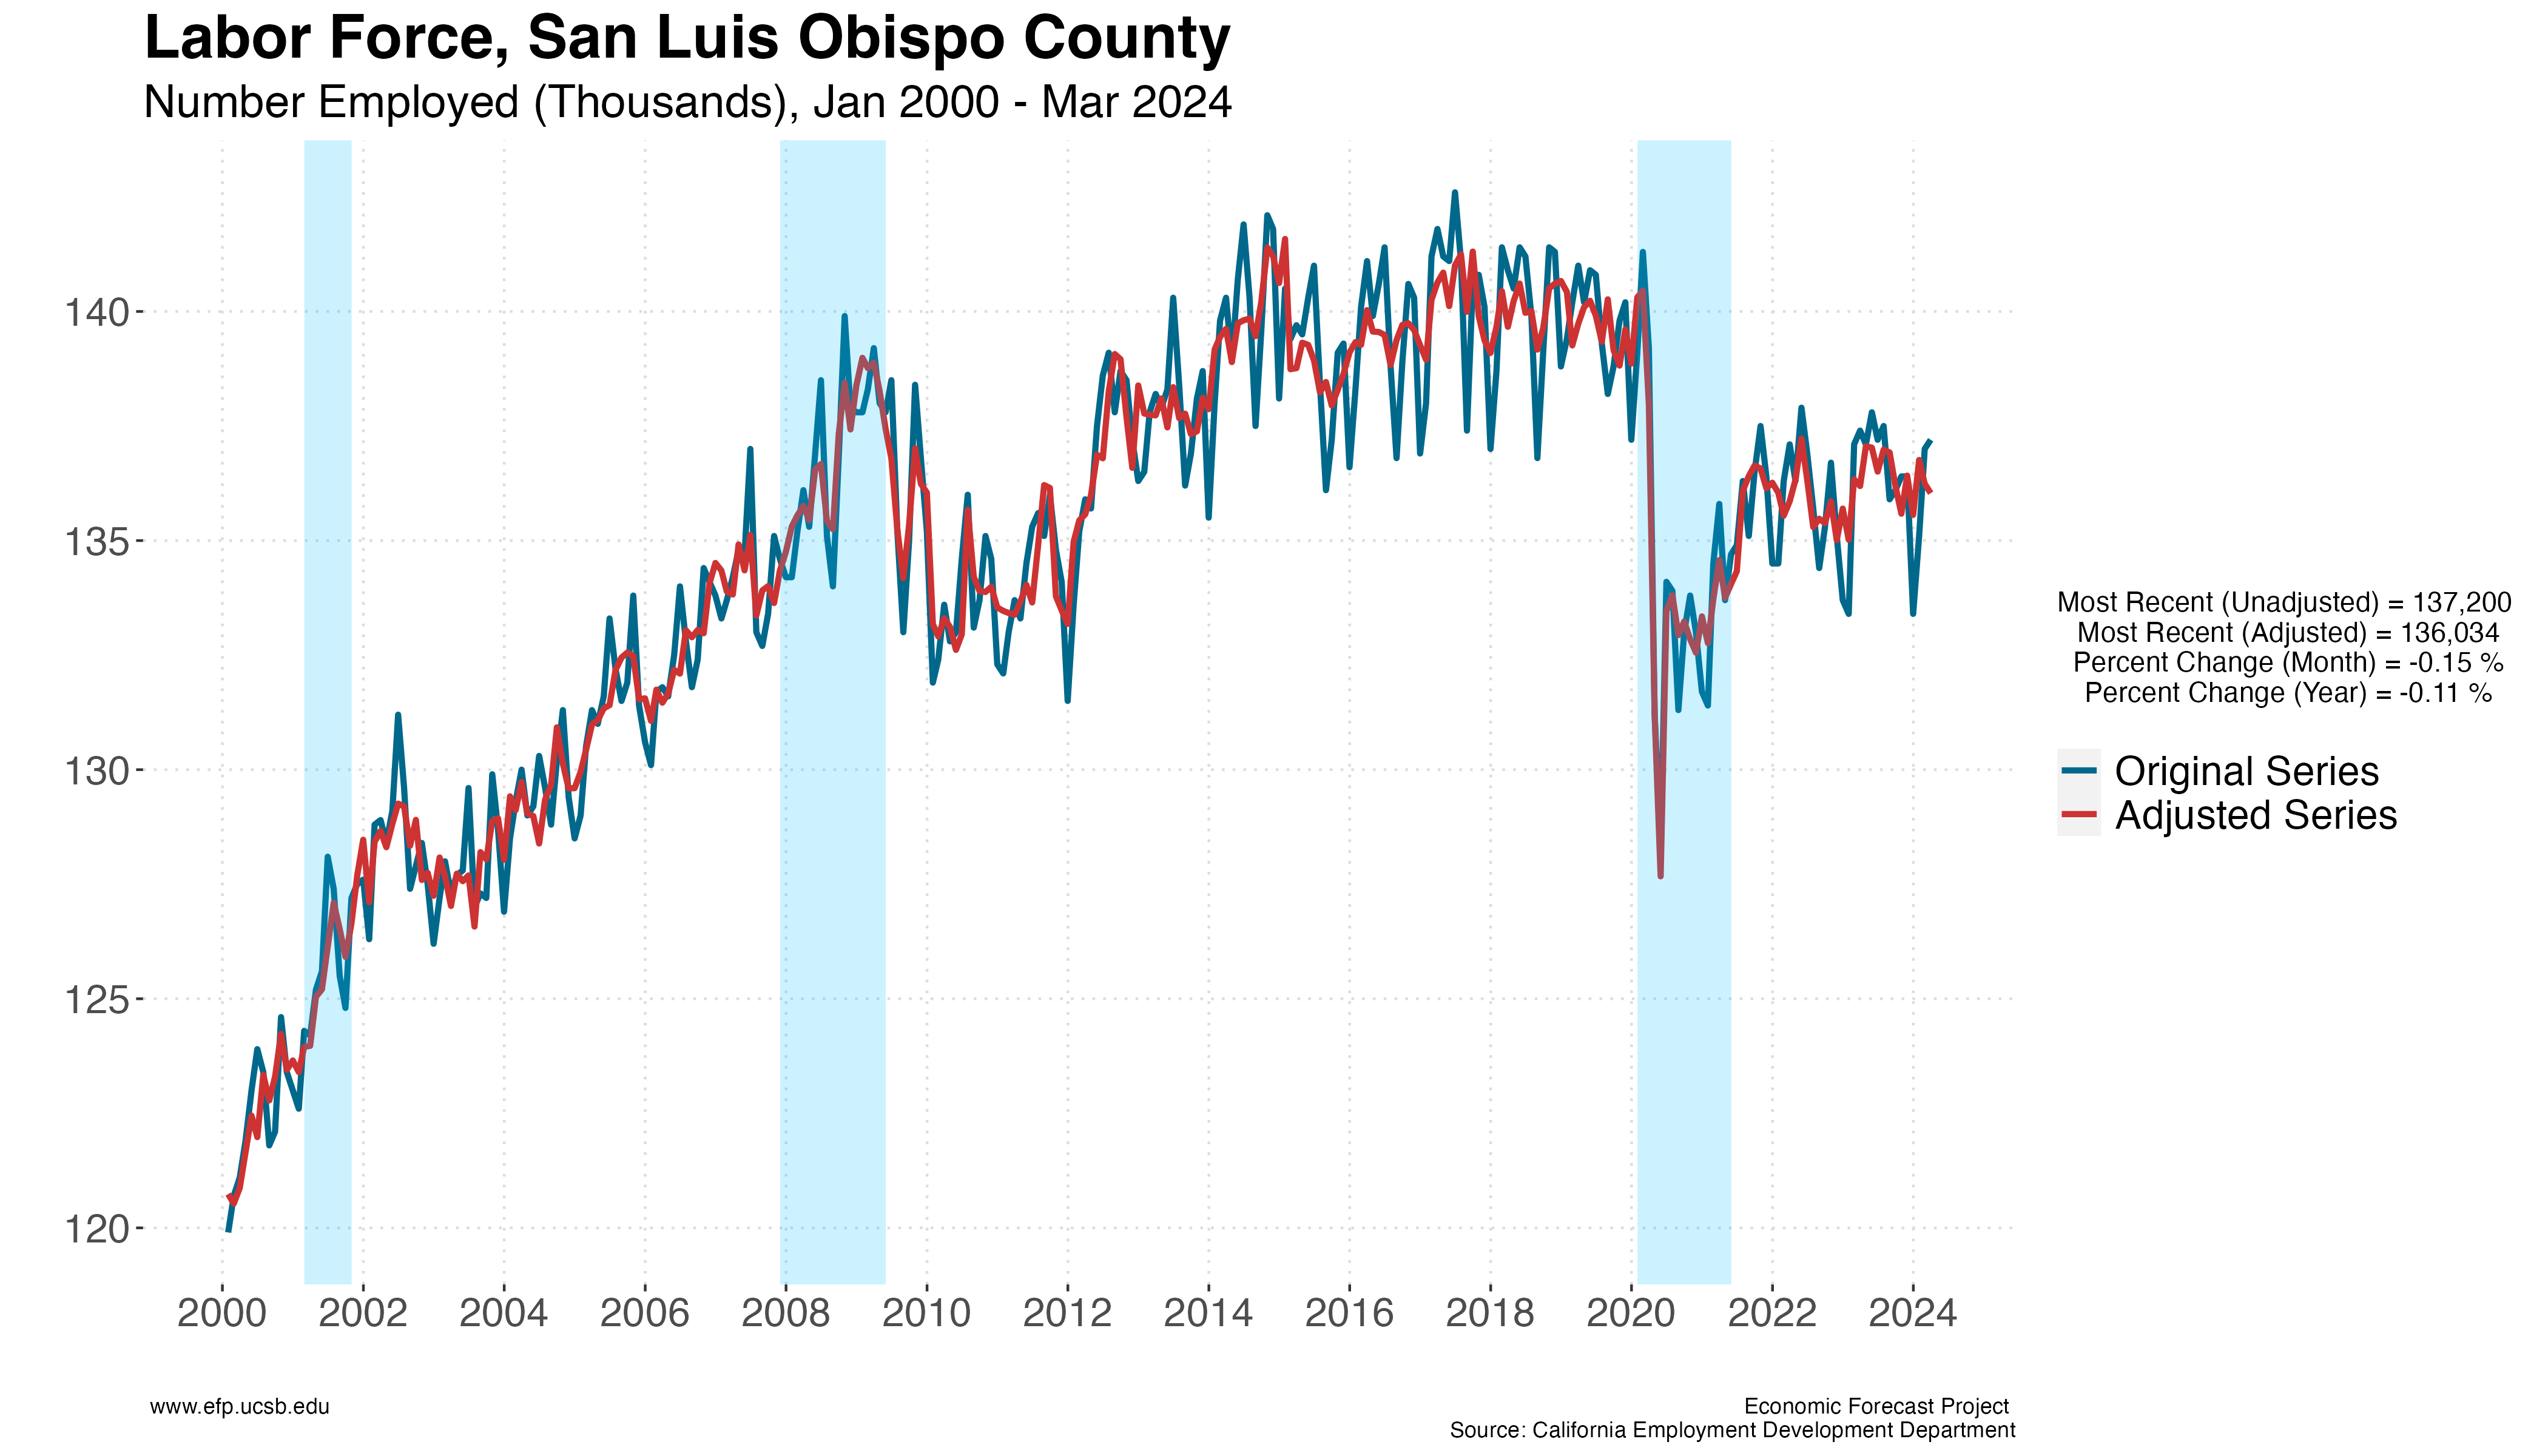
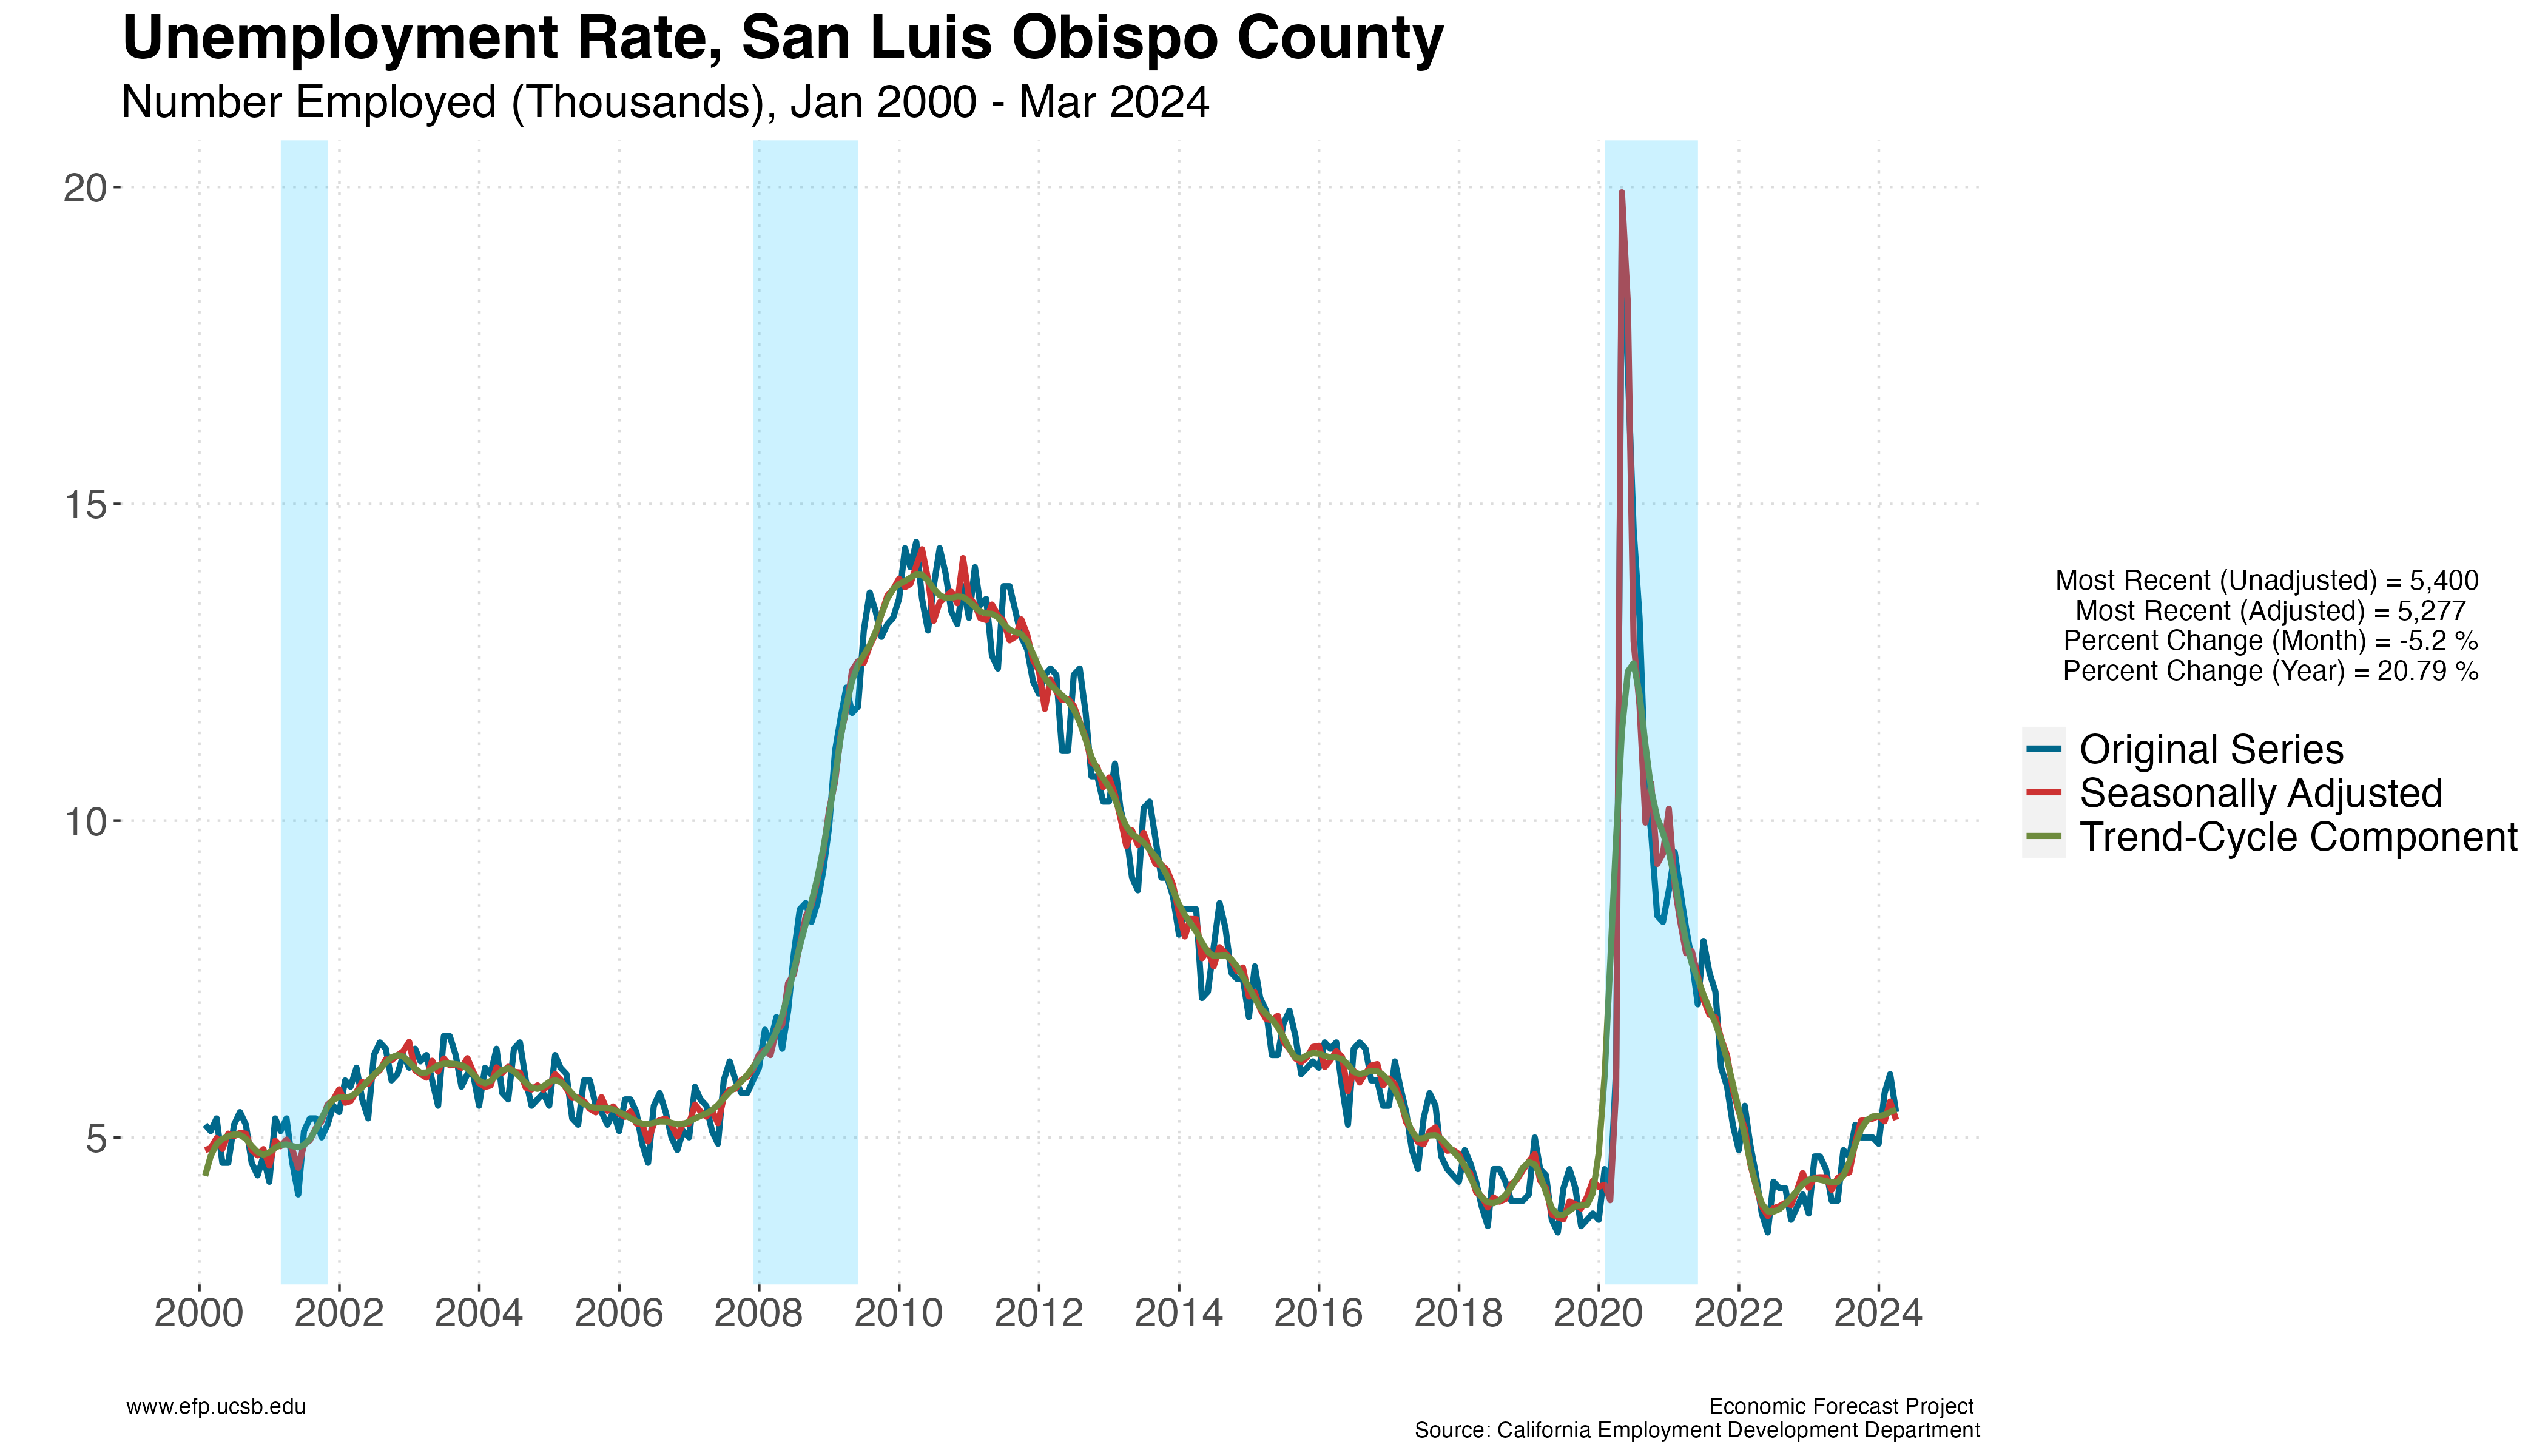
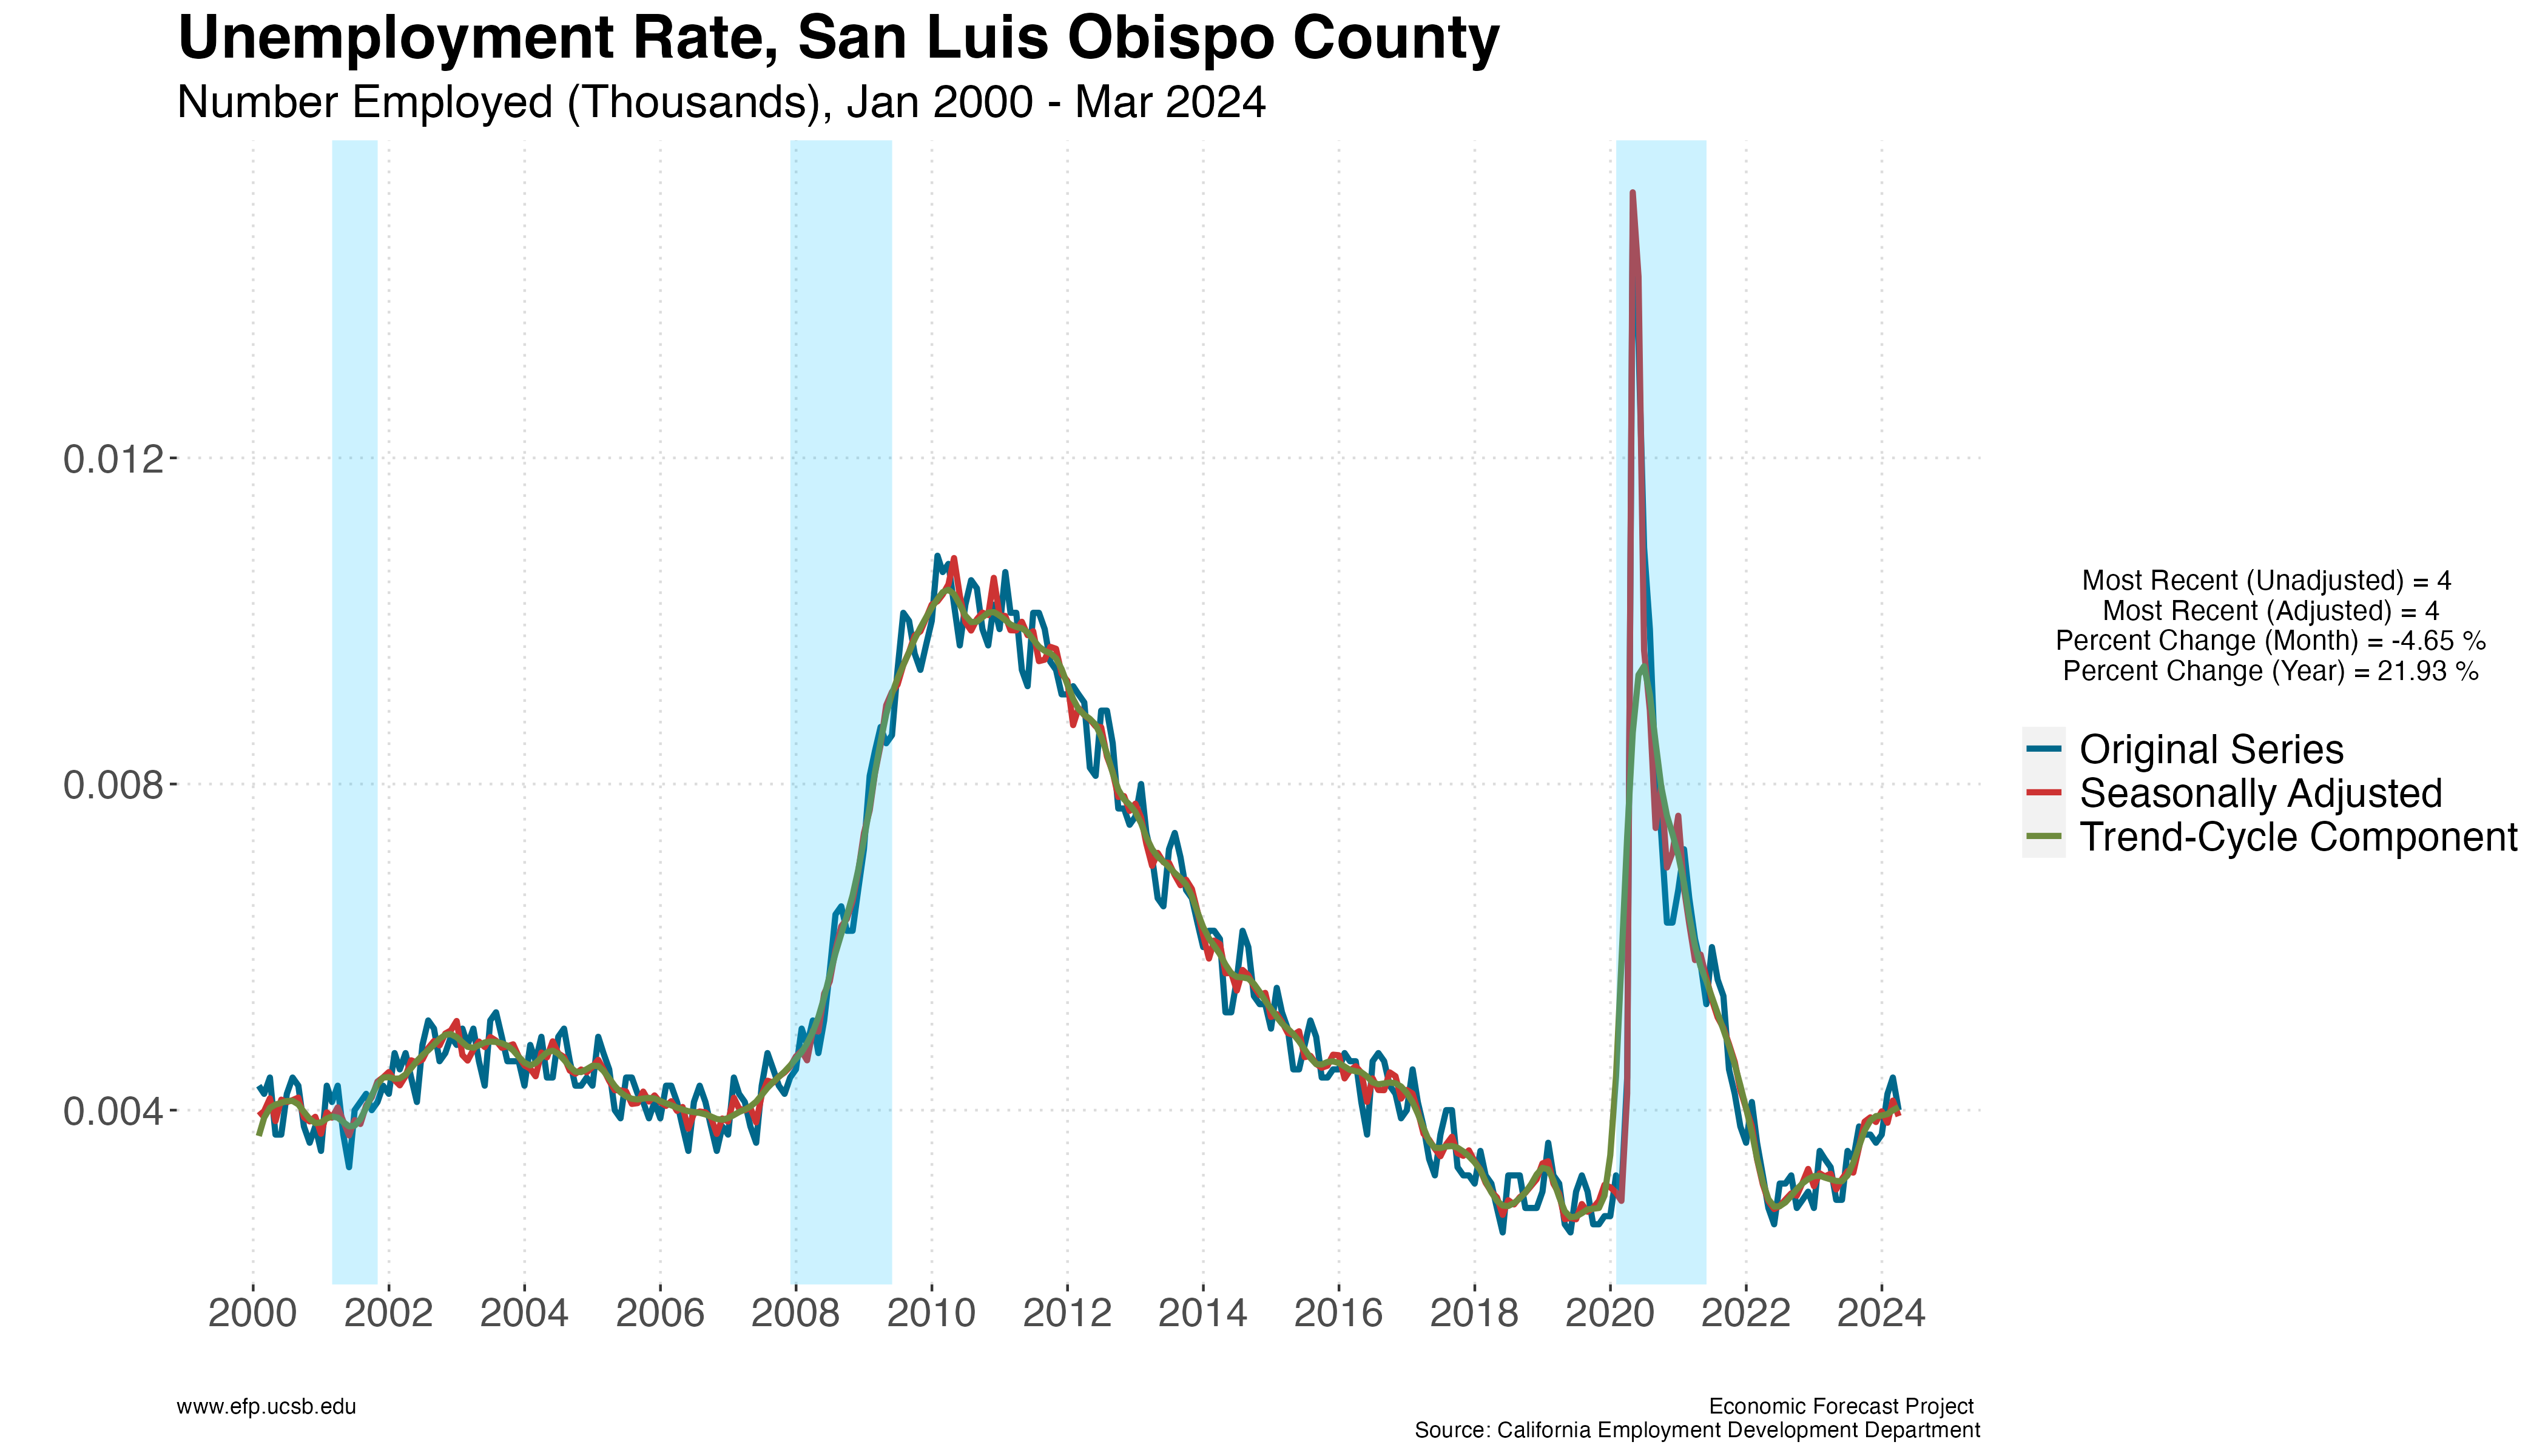
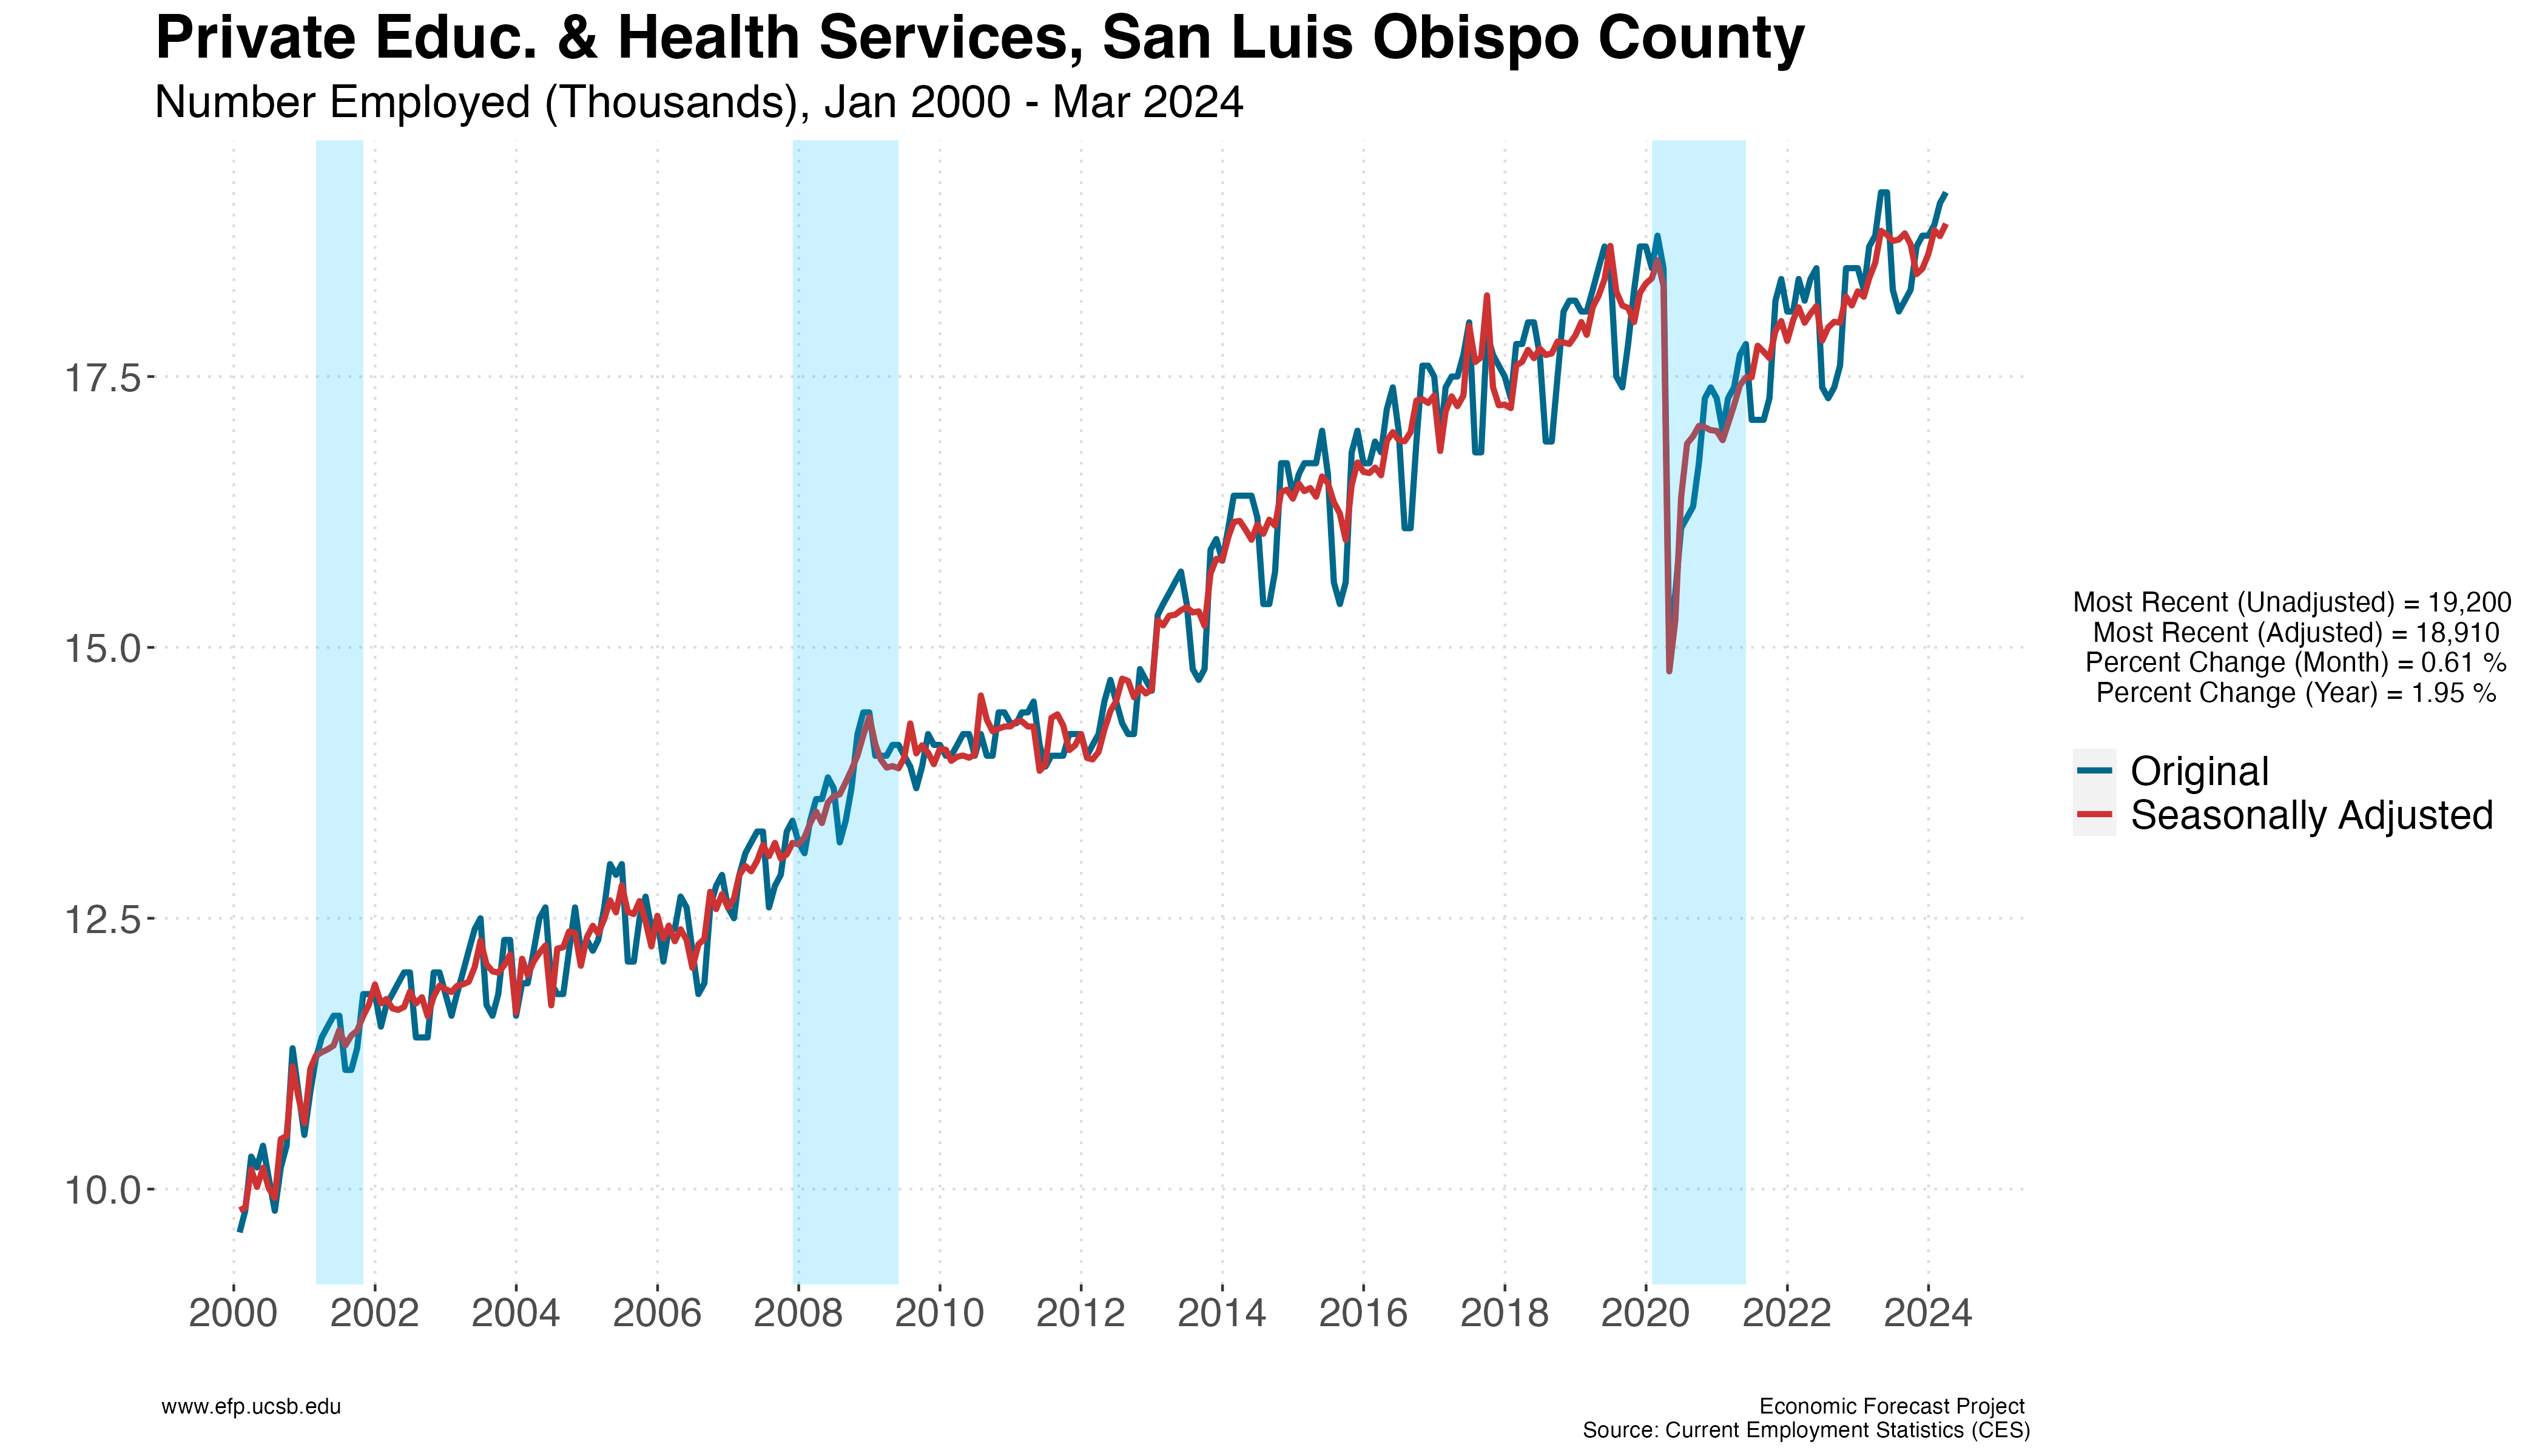
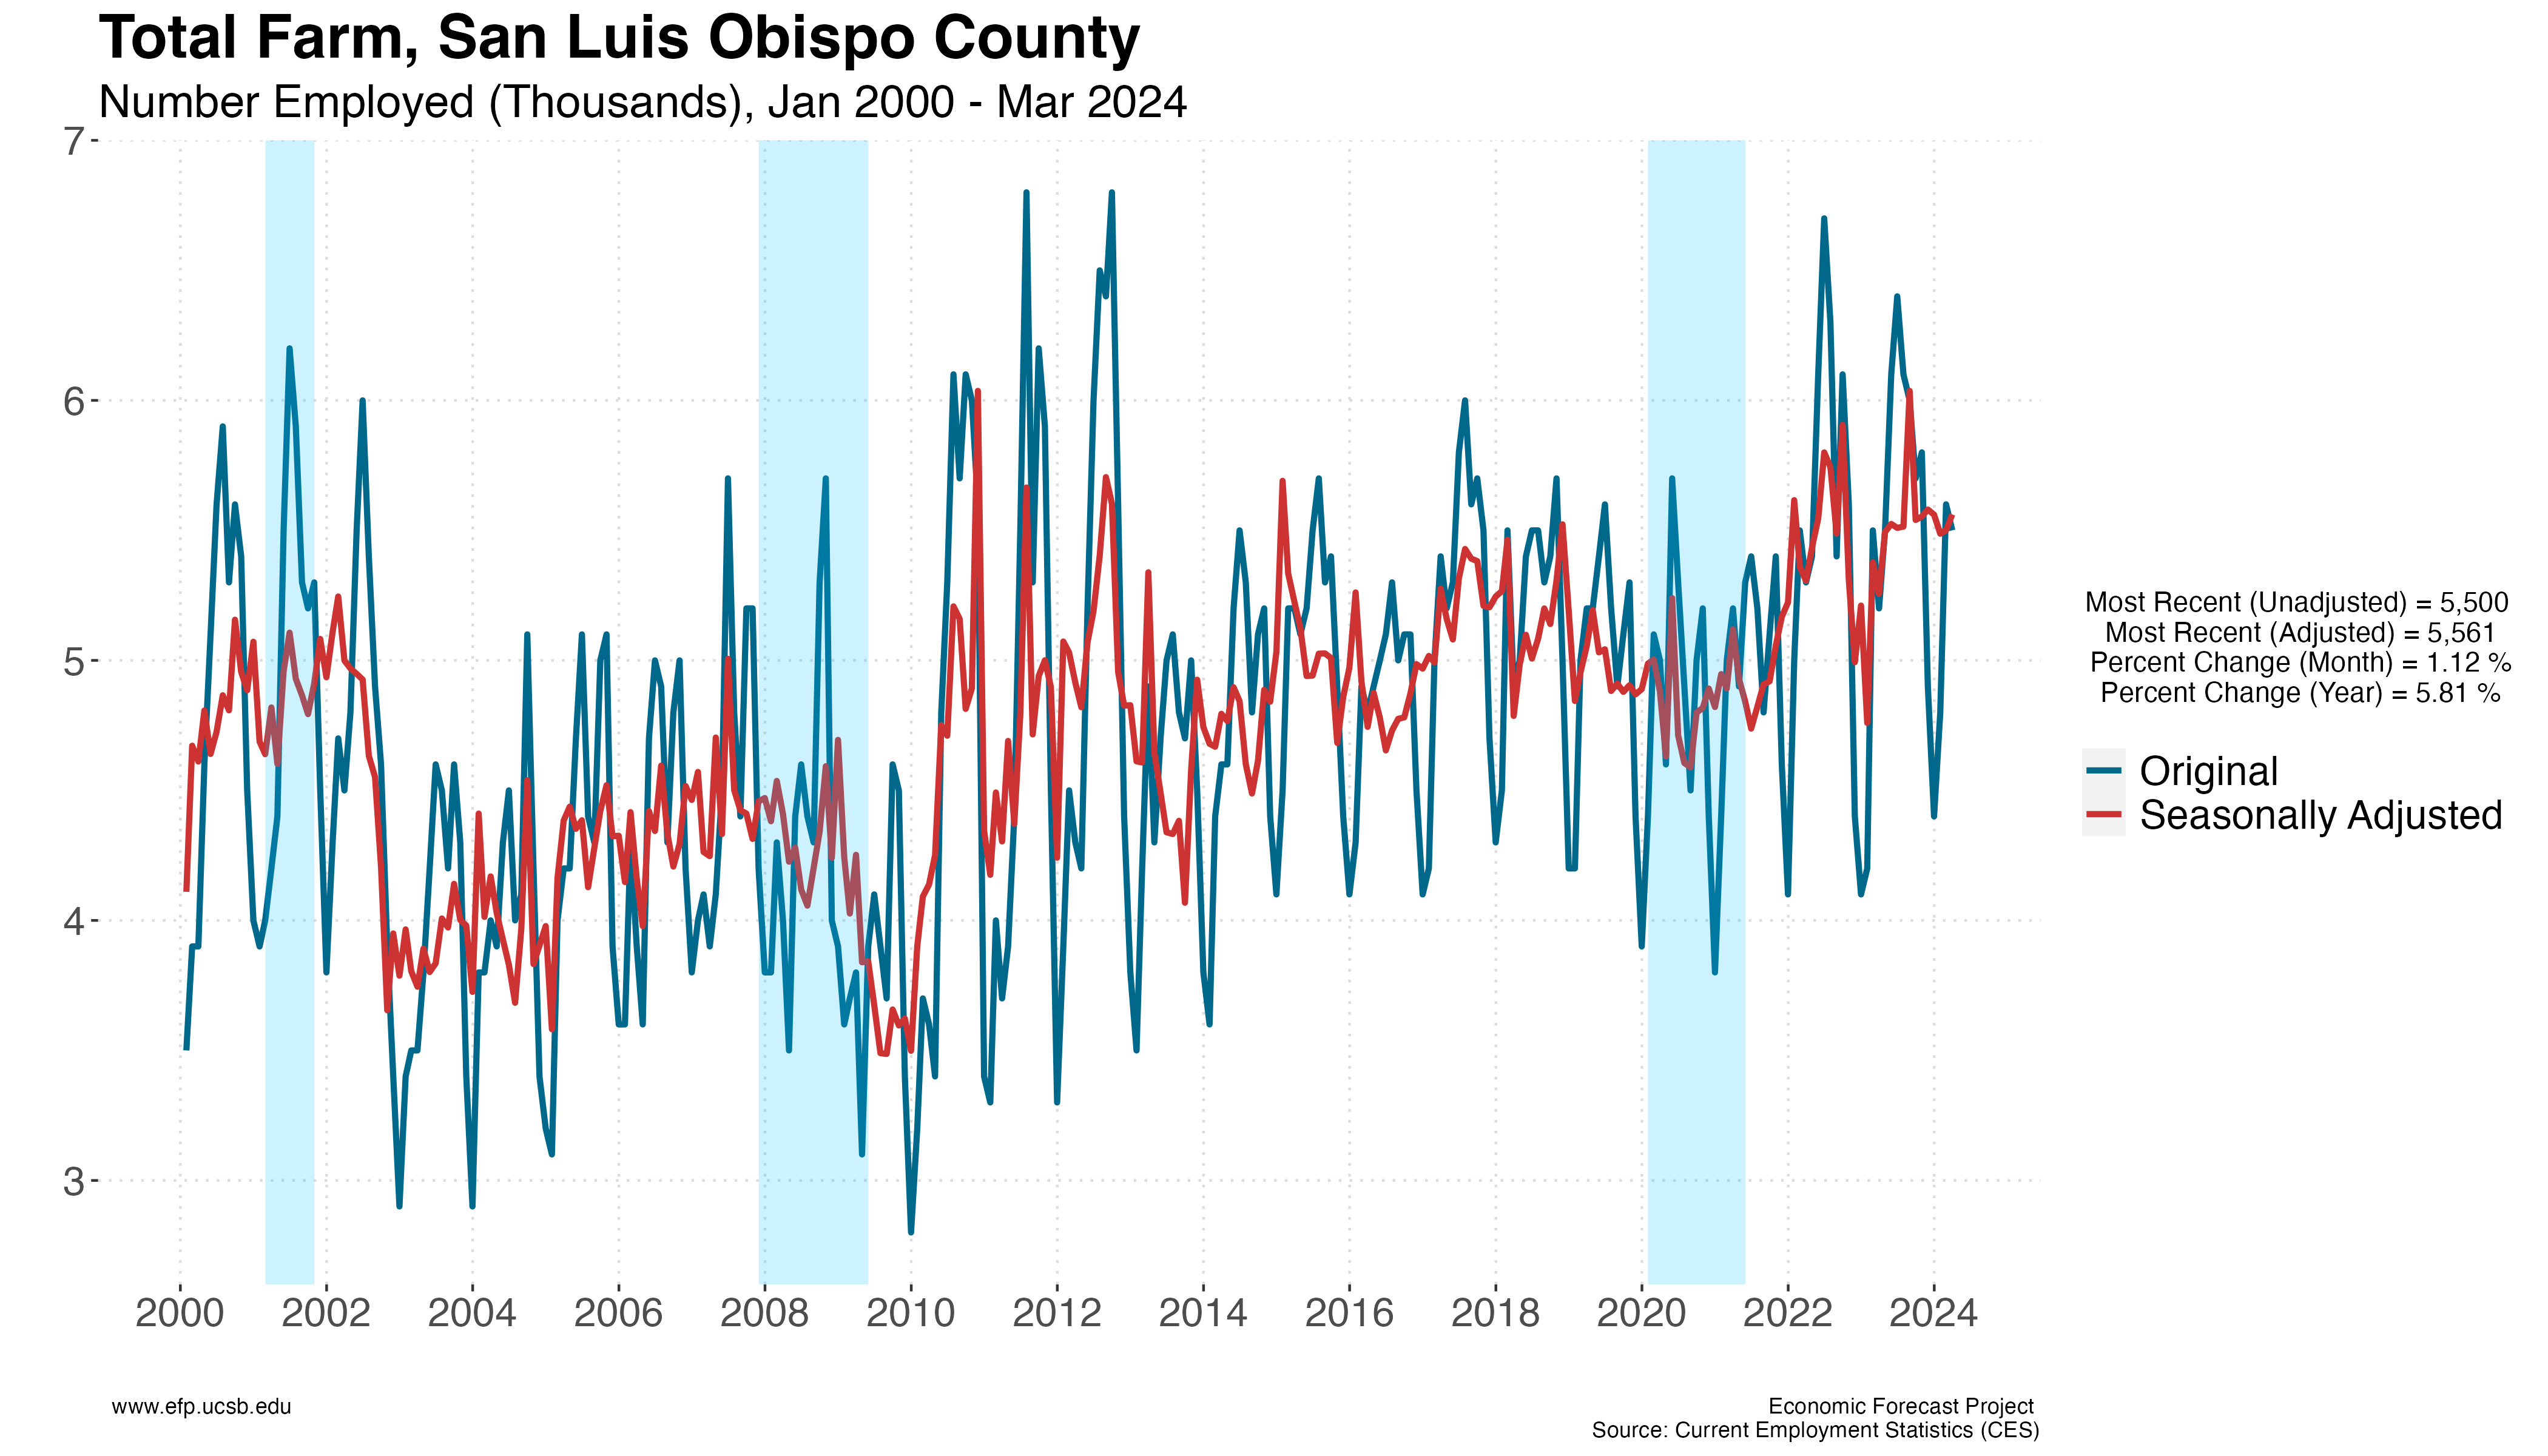
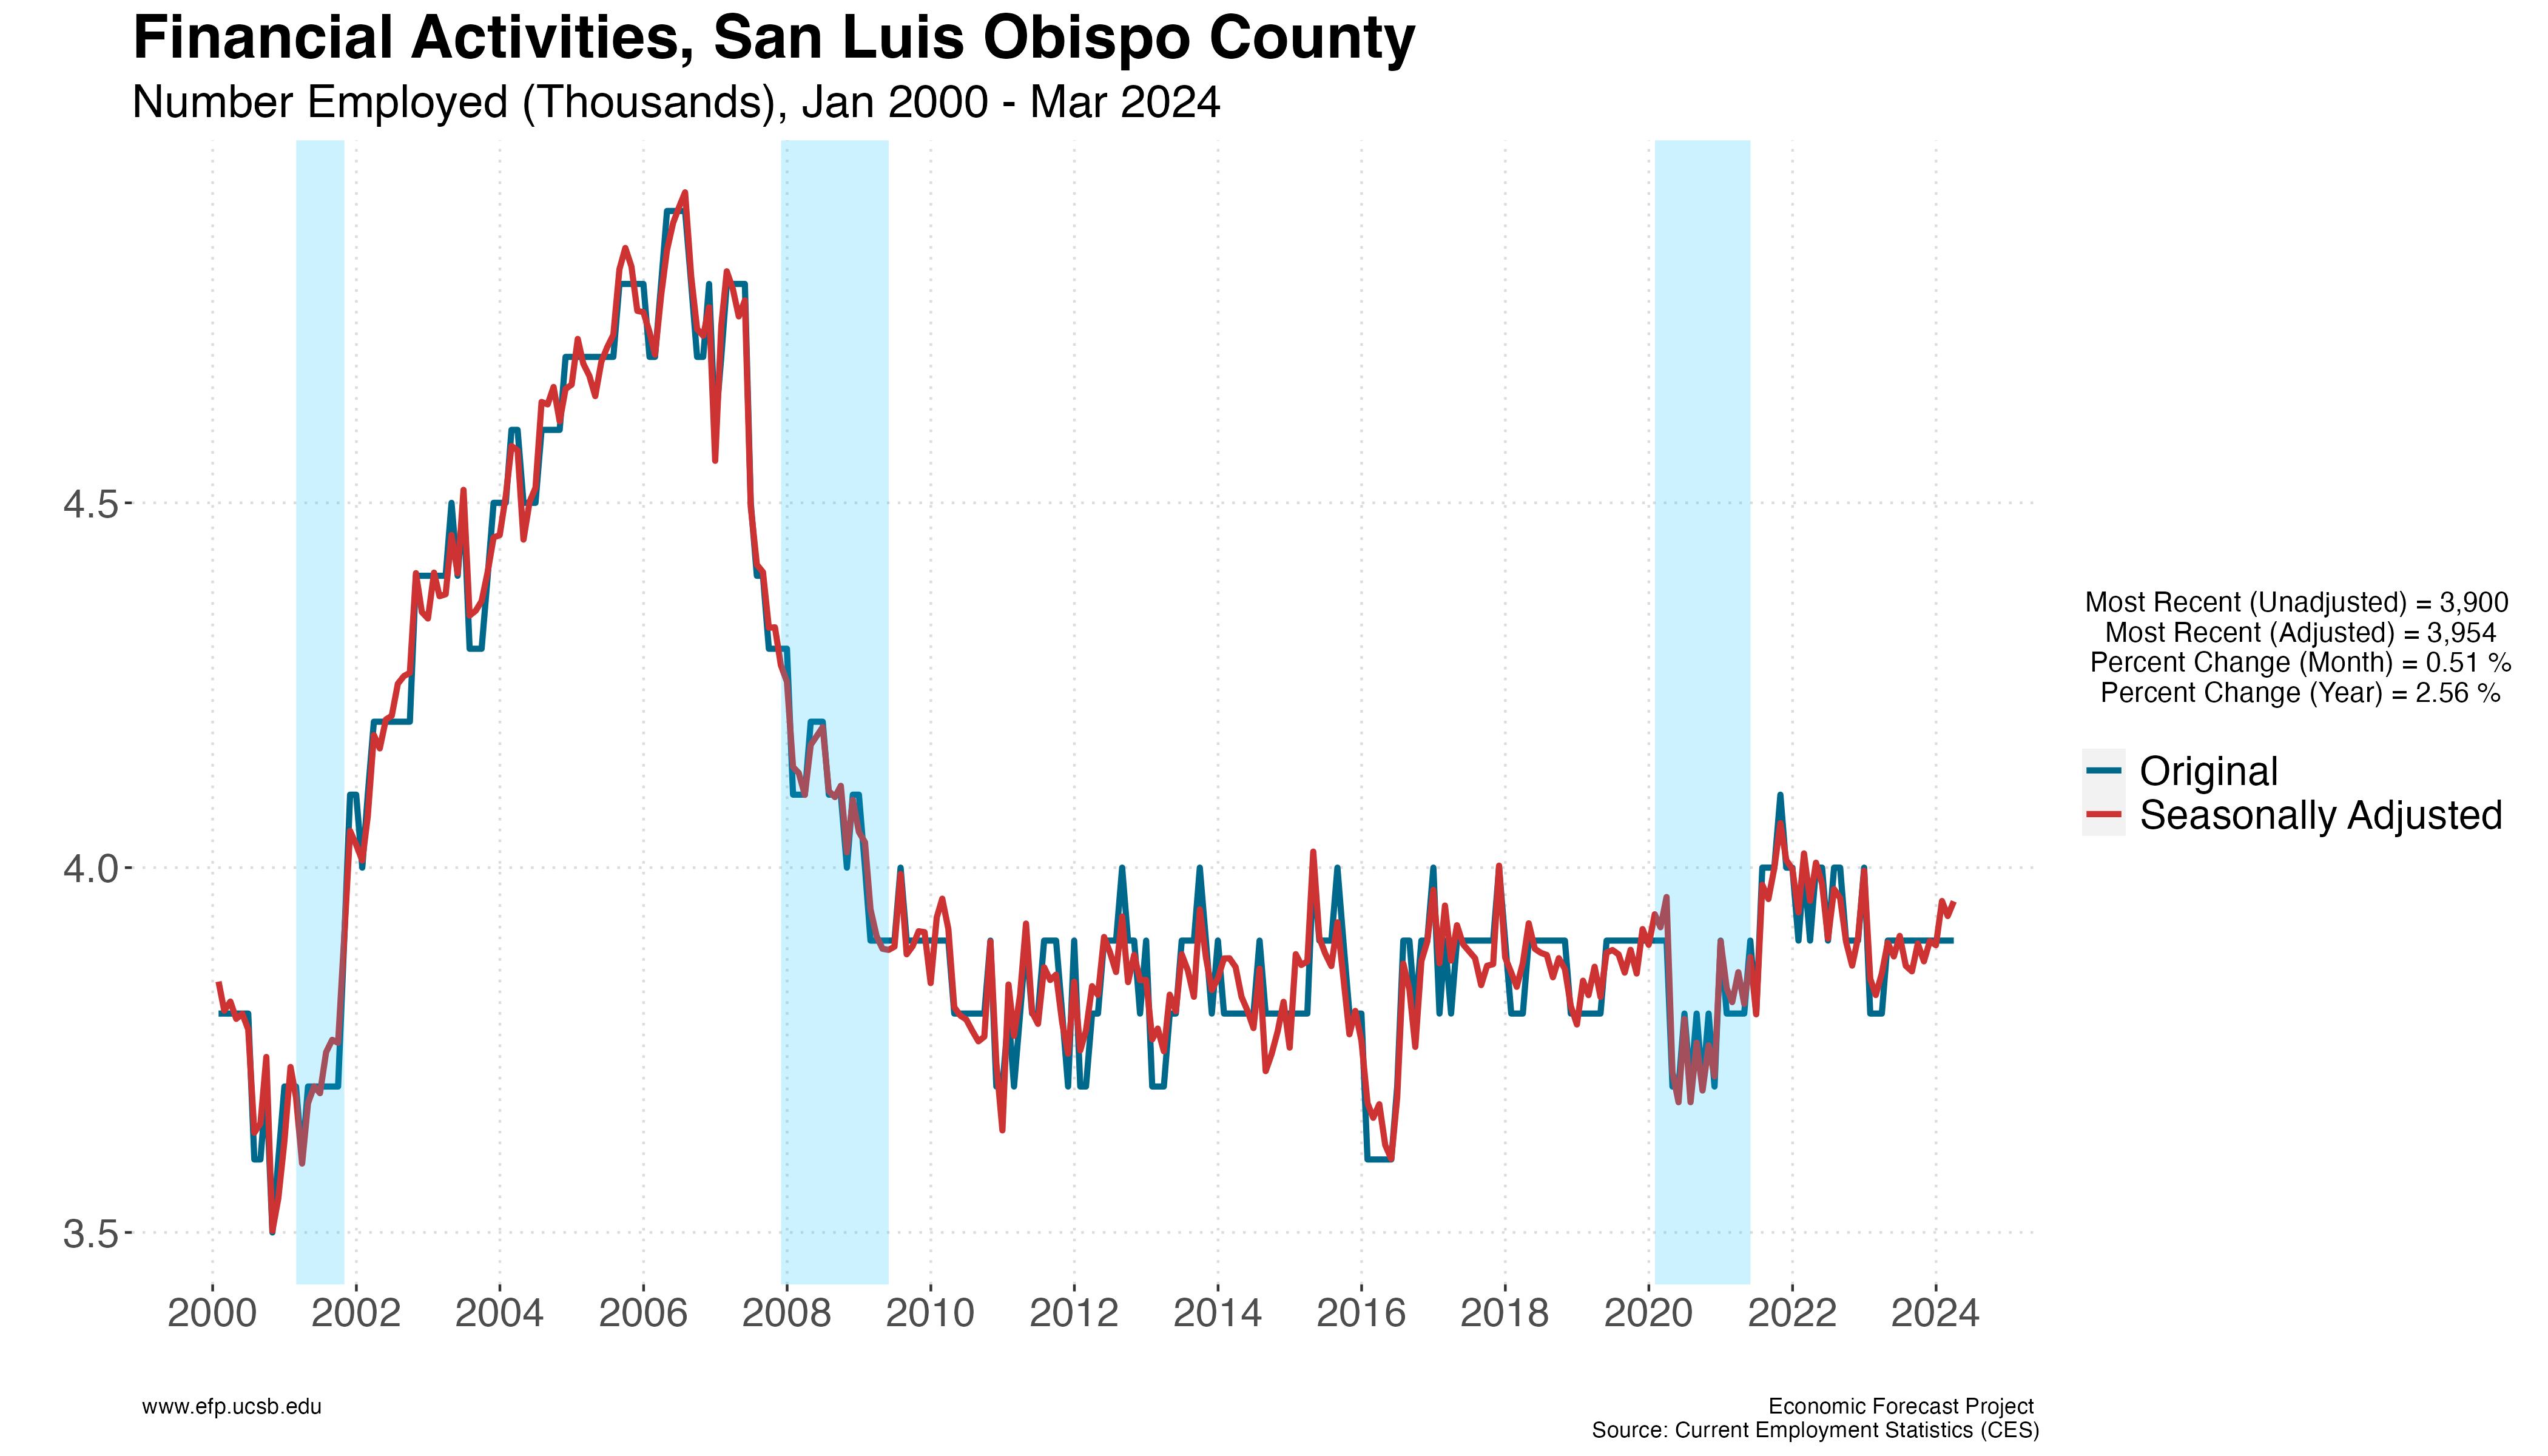
The data presented in this section come from the Bureau of Labor Statistics (BLS) and the Economic Development Department of California (EDD). One key theme we like to stress when looking at this data is the need for seasonal adjustments. The raw data published by the BLS and EDD are not adjusted for seasonality, making month-by-month comparisons of certain economic time series potentially misleading. Santa Barbara County is home to a large agricultural sector, a very seasonal industry. For example, spikes in unemployment at the end of harvesting season might, to some, suggest a negative economic indicator. This spike, however, could very much be less pronounced than in previous years, and should be seen more positively. Seasonally adjusting these time series accomplishes this. It removes these transitory fluctuations so that appropriate, pragmatic conclusions can be made when looking at the data.

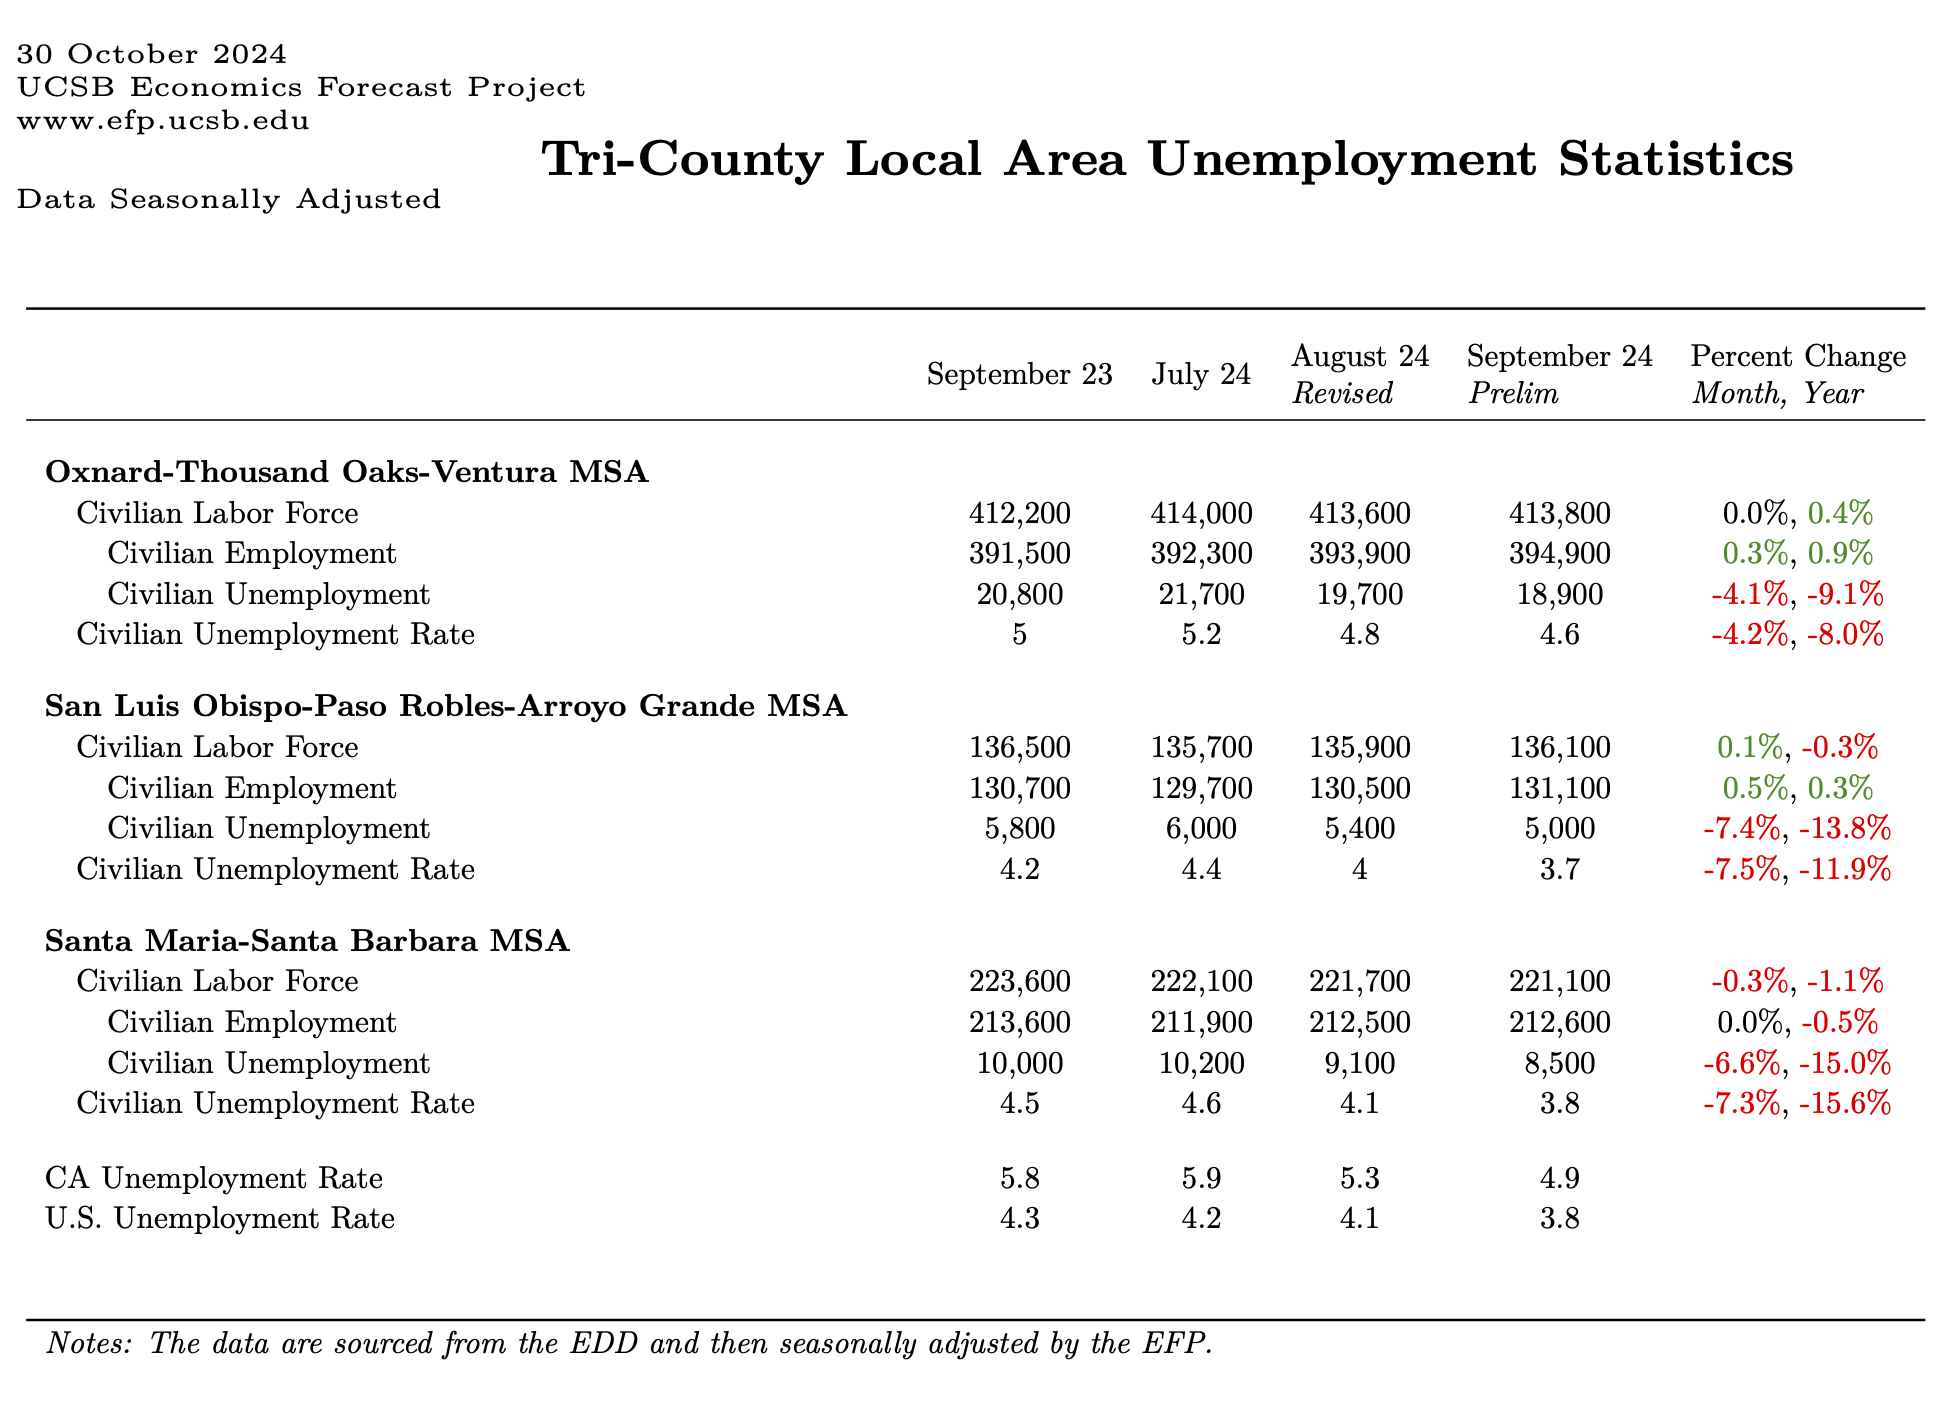
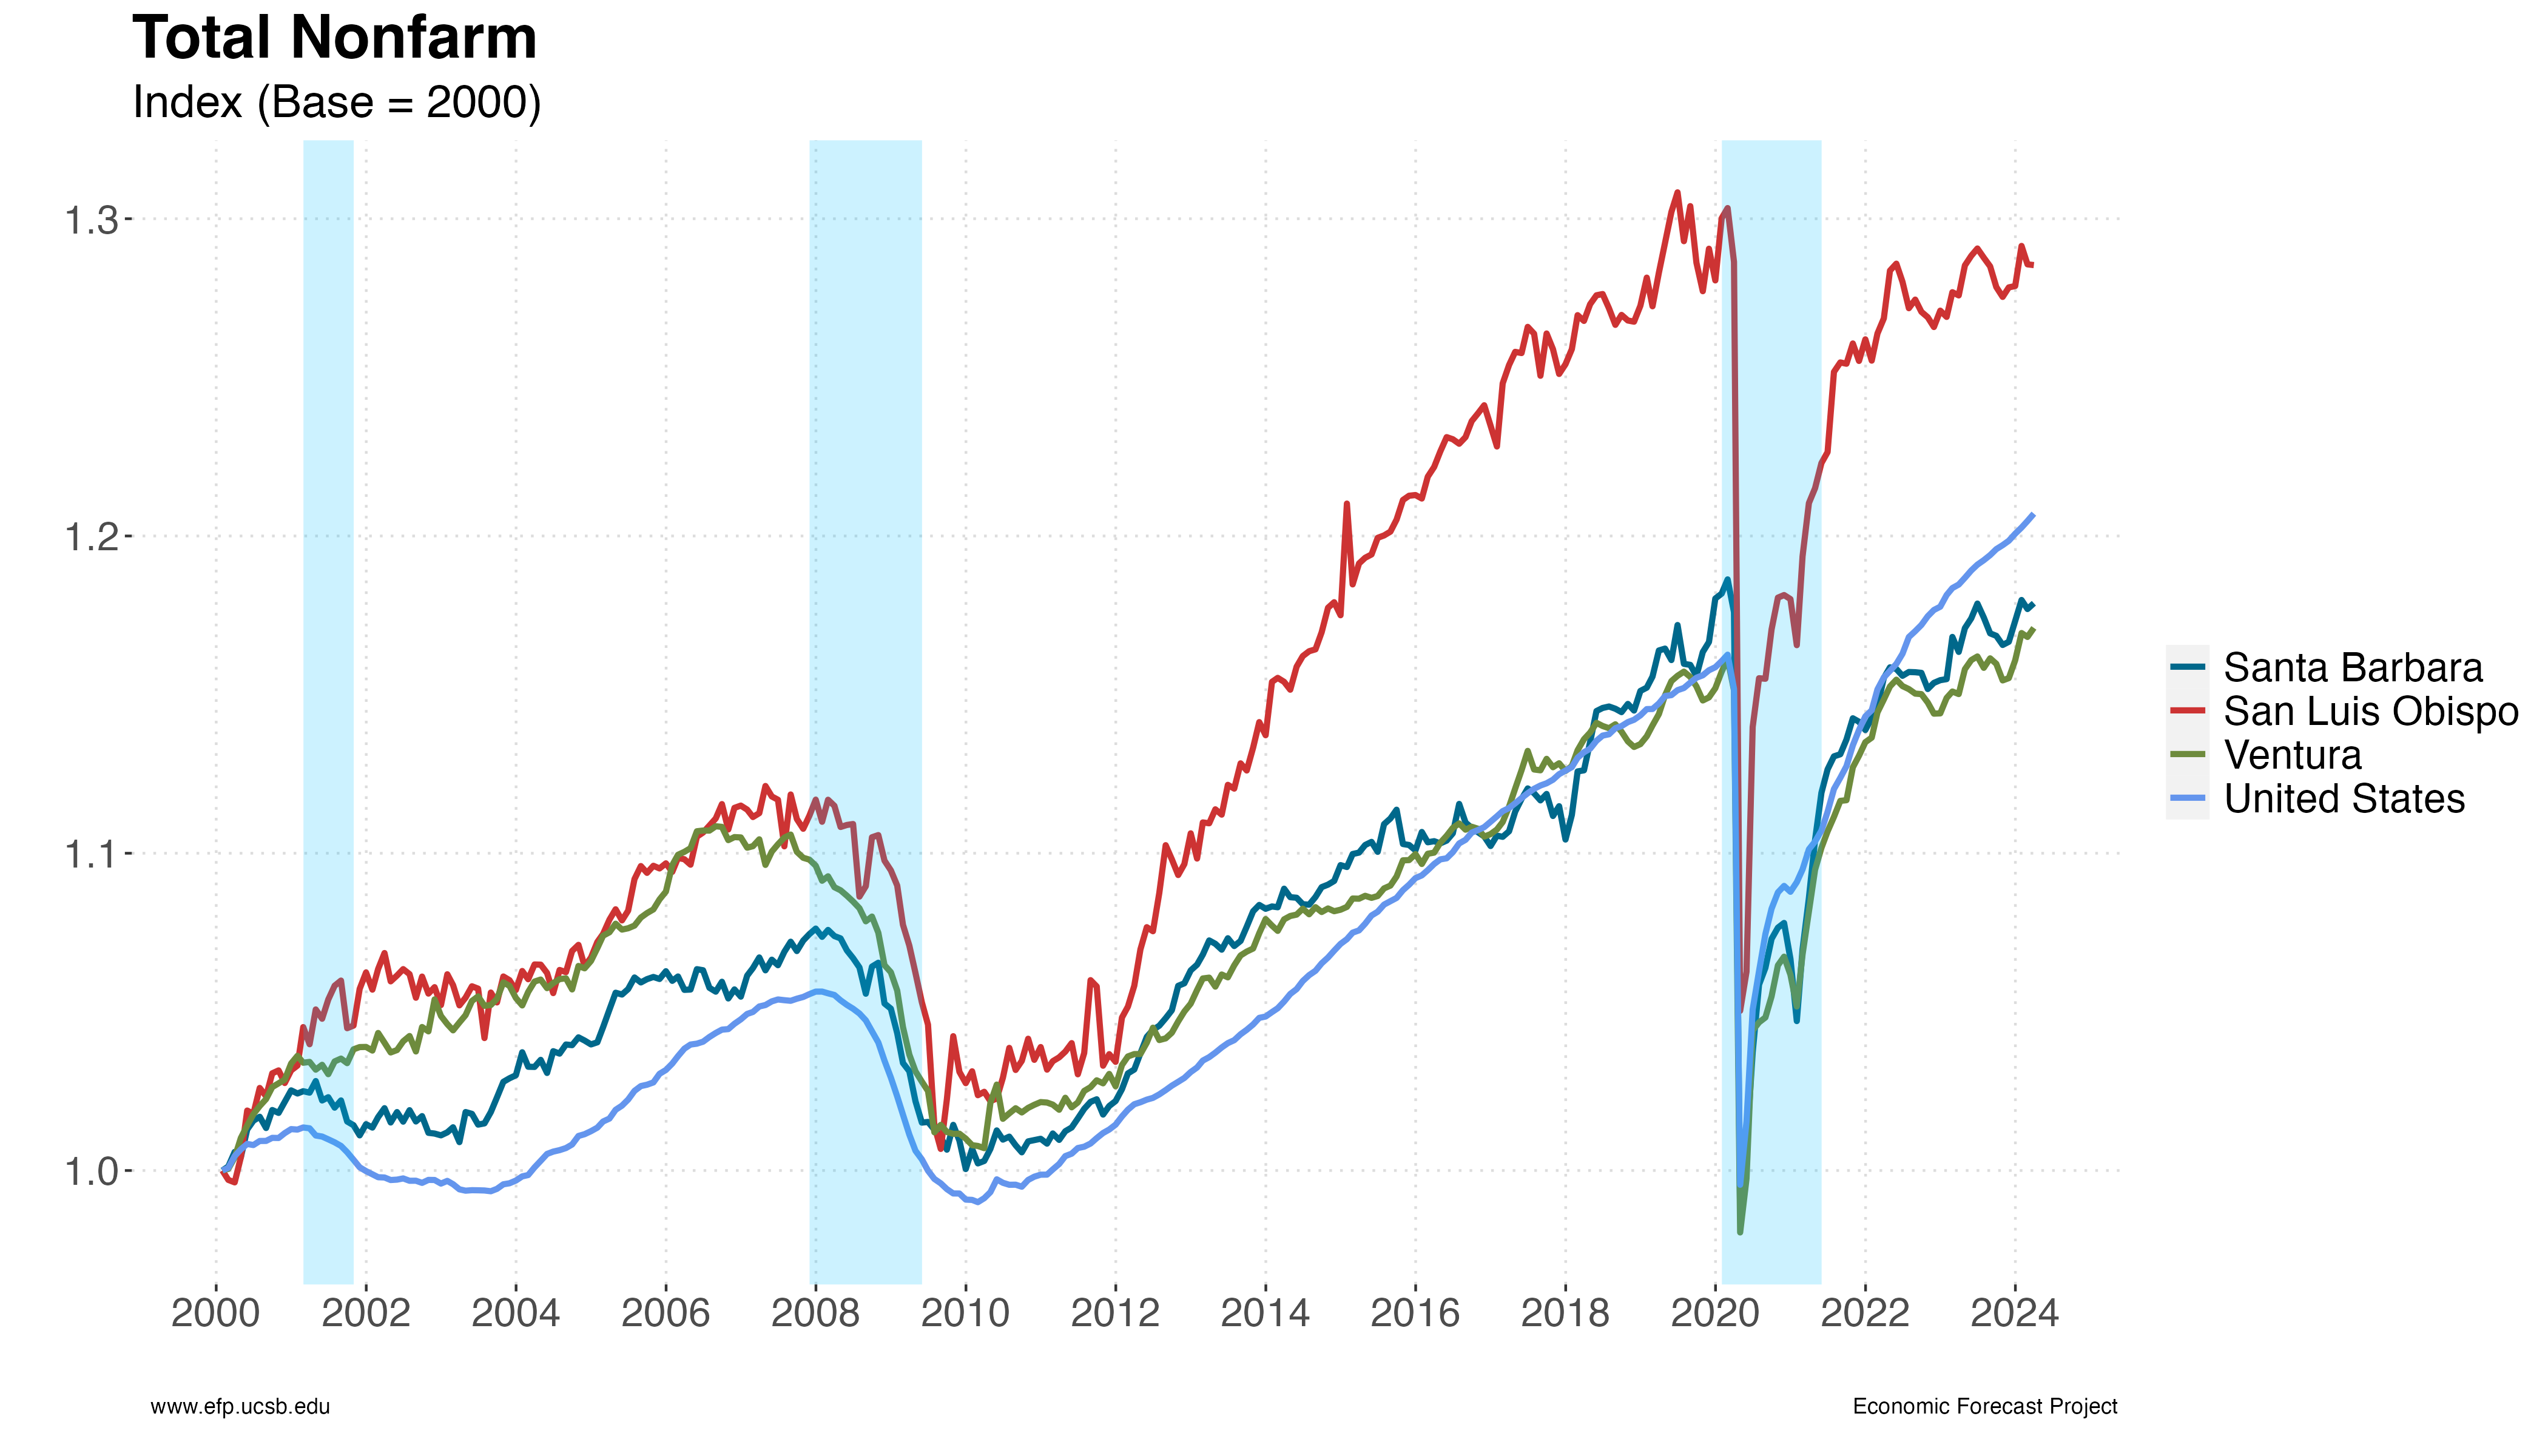
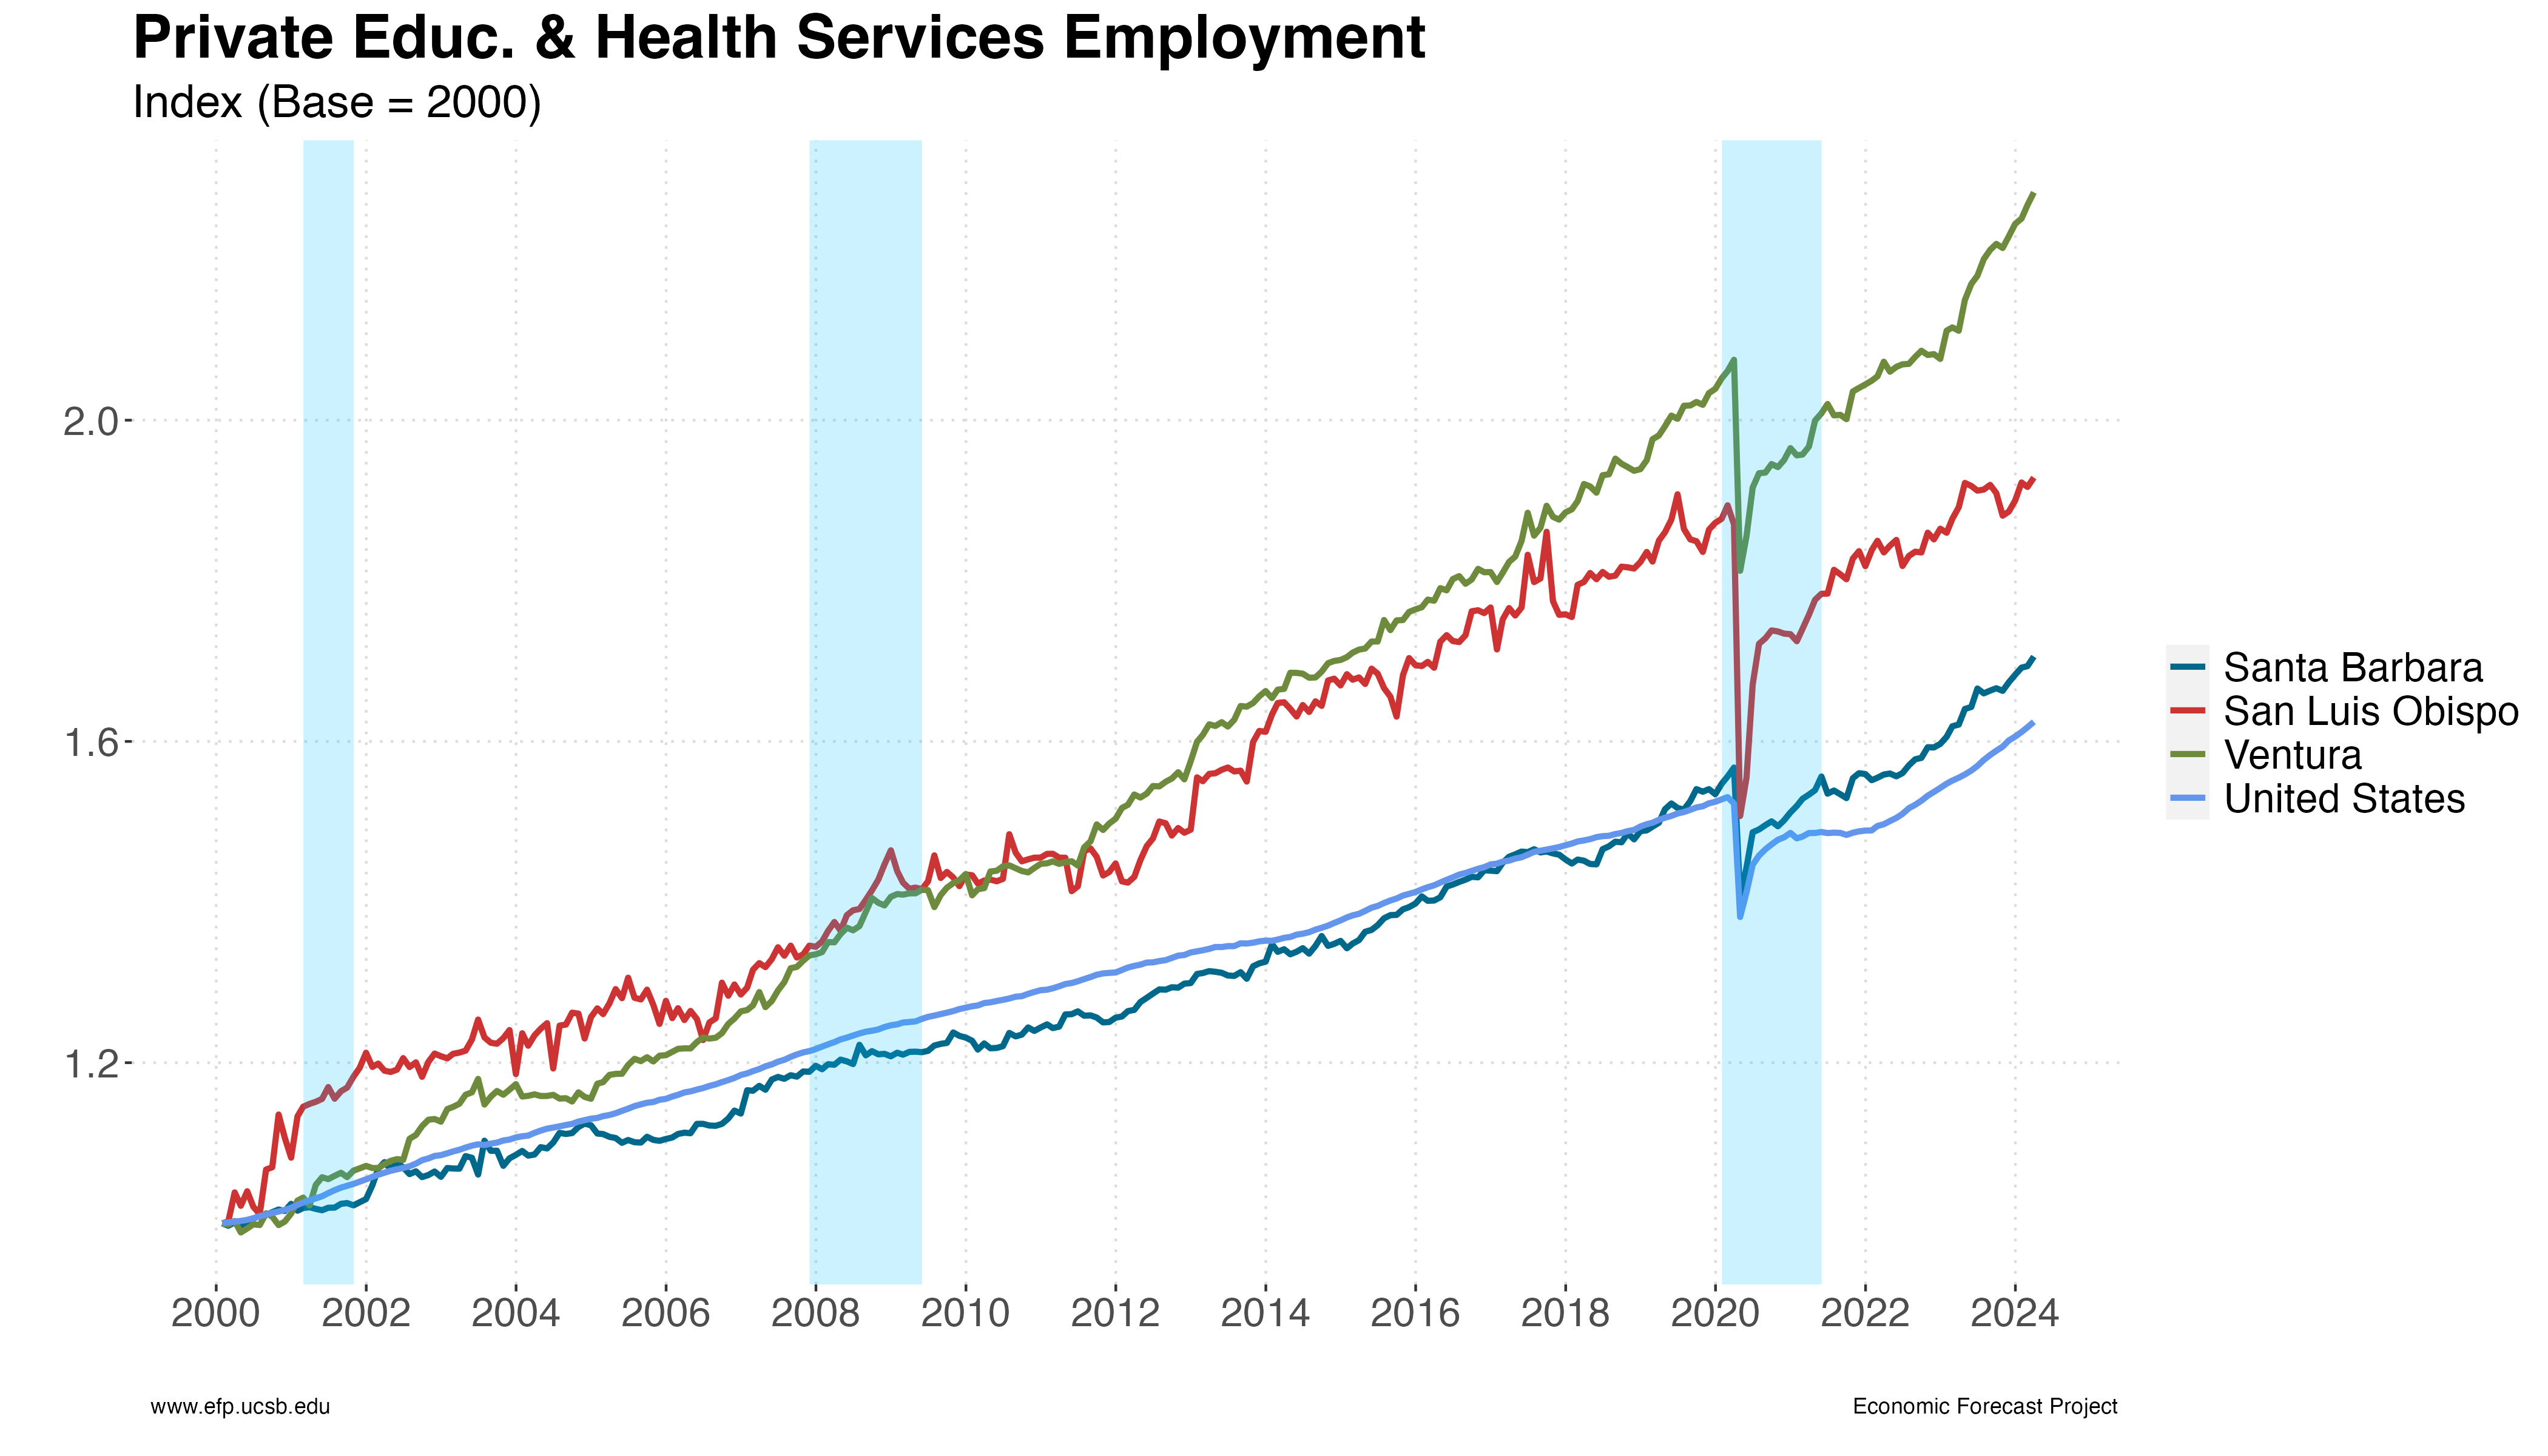
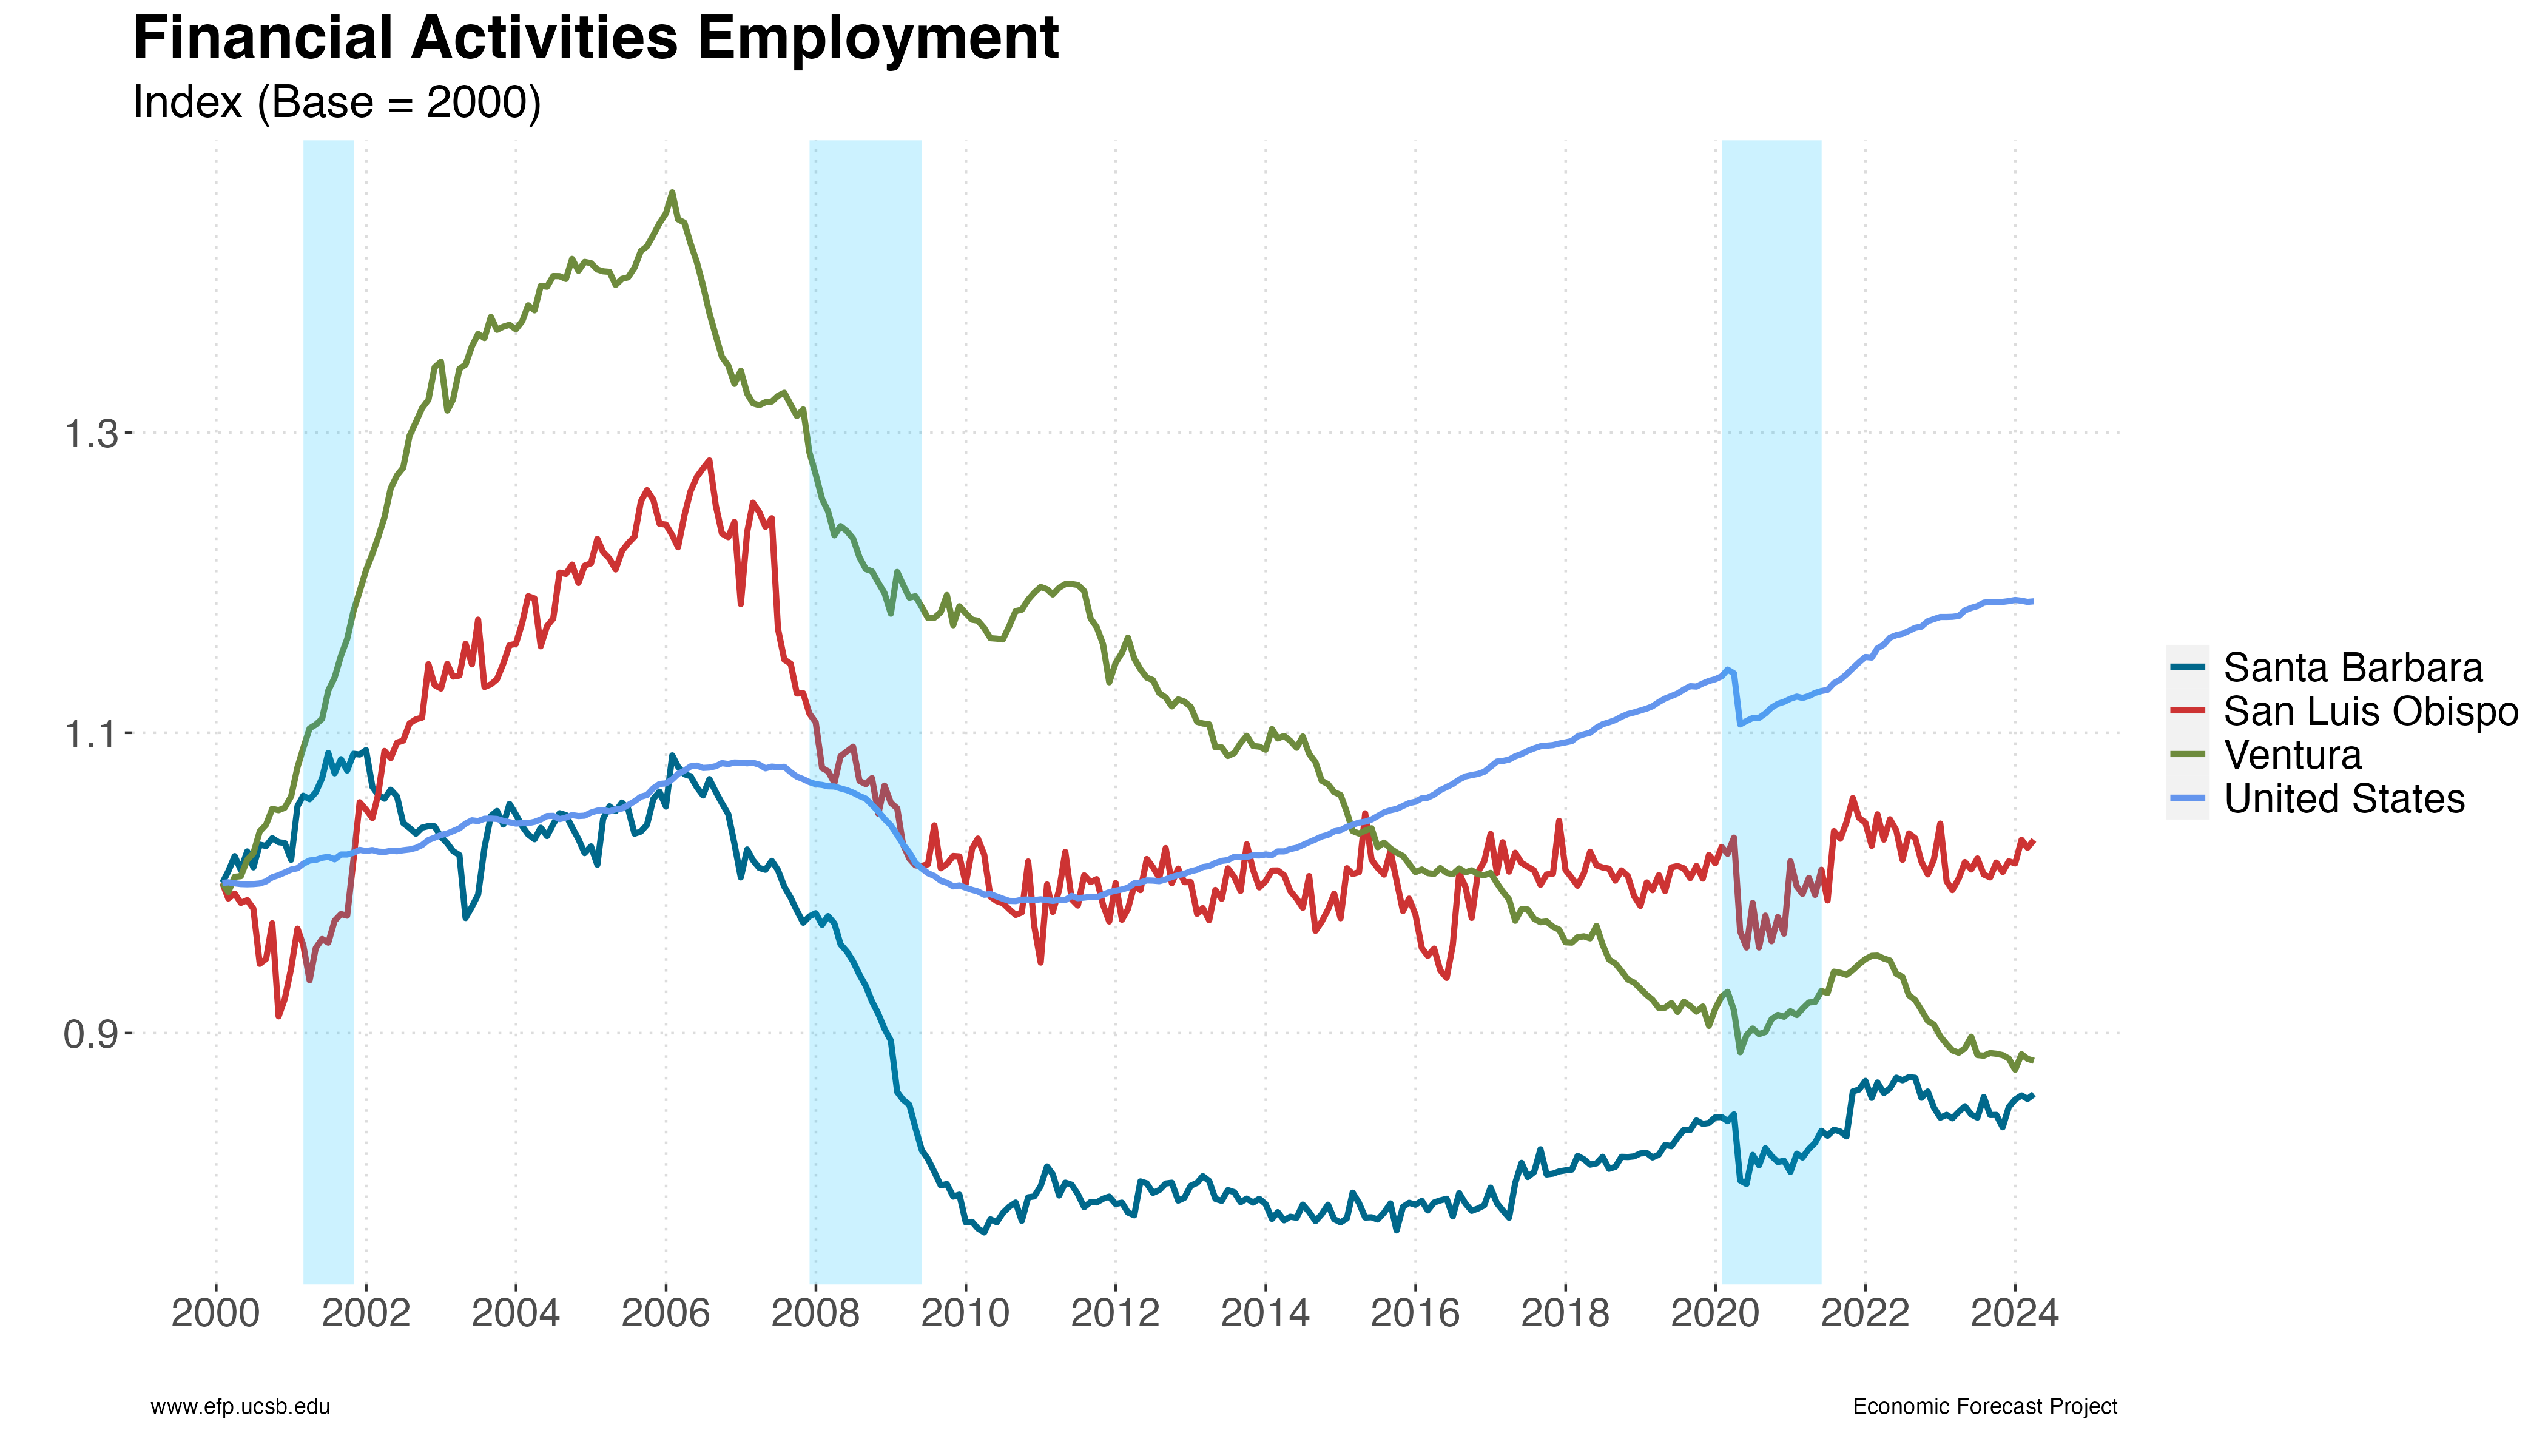
1.1 Detailed Data
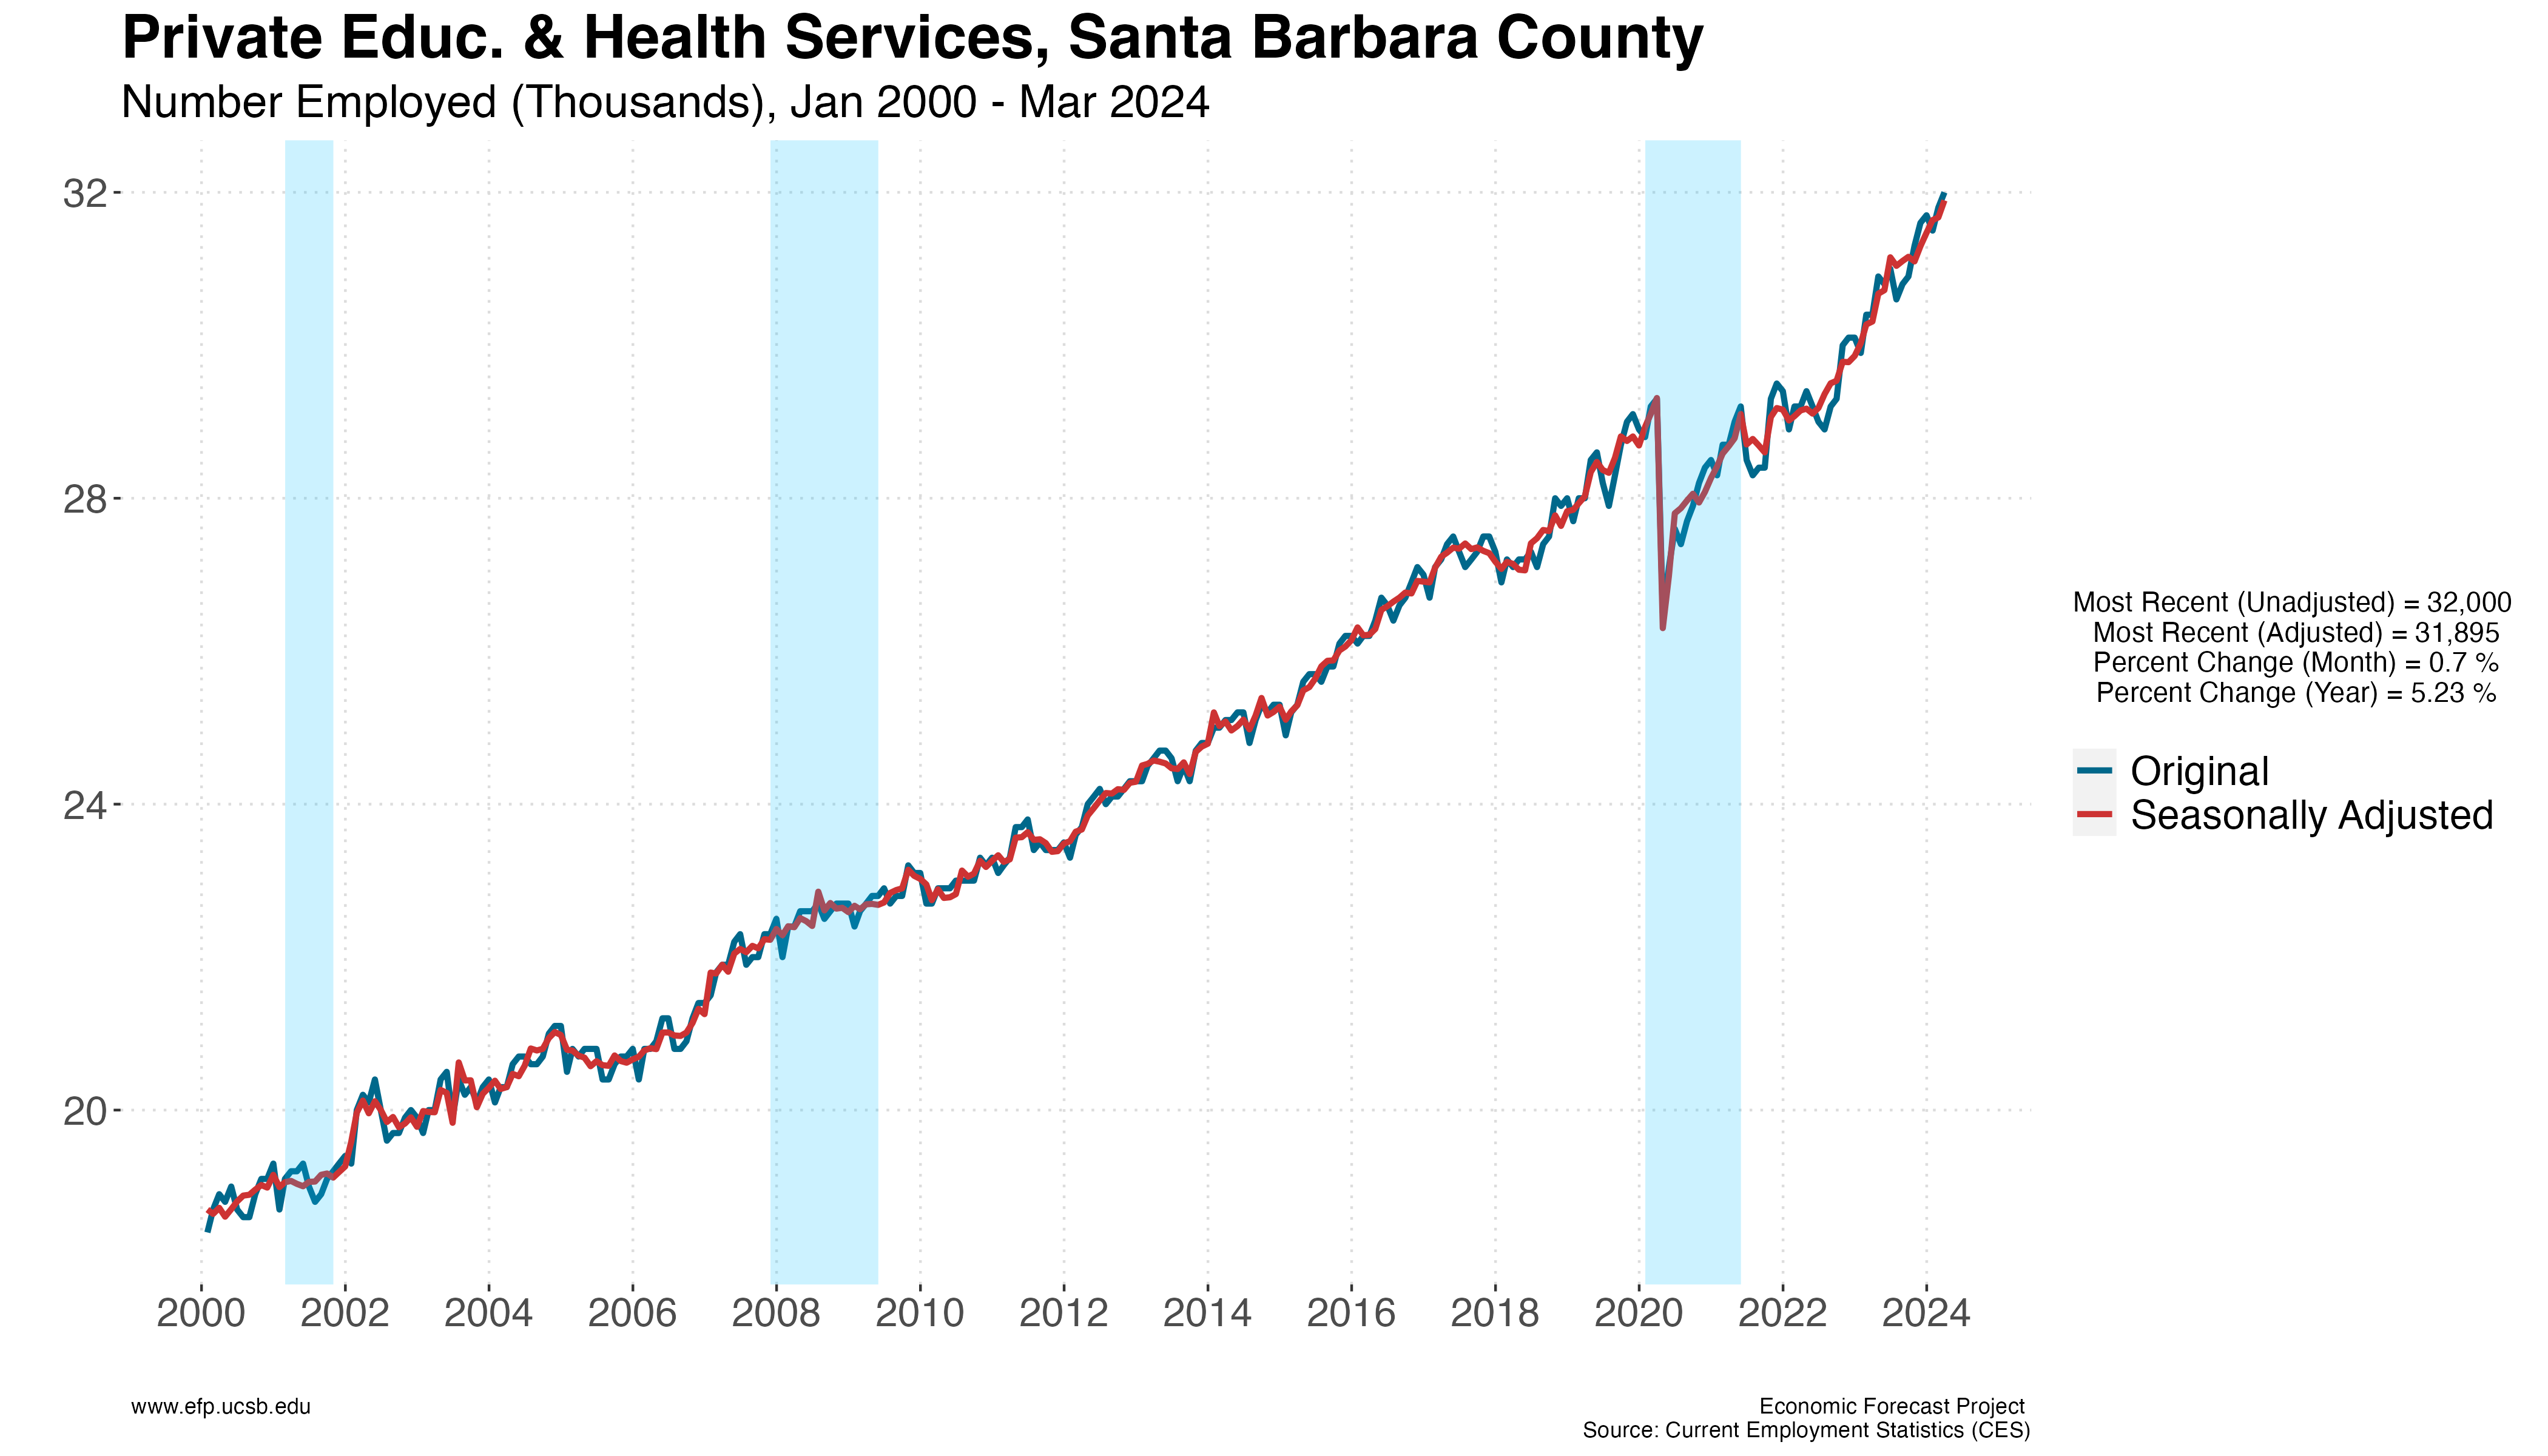
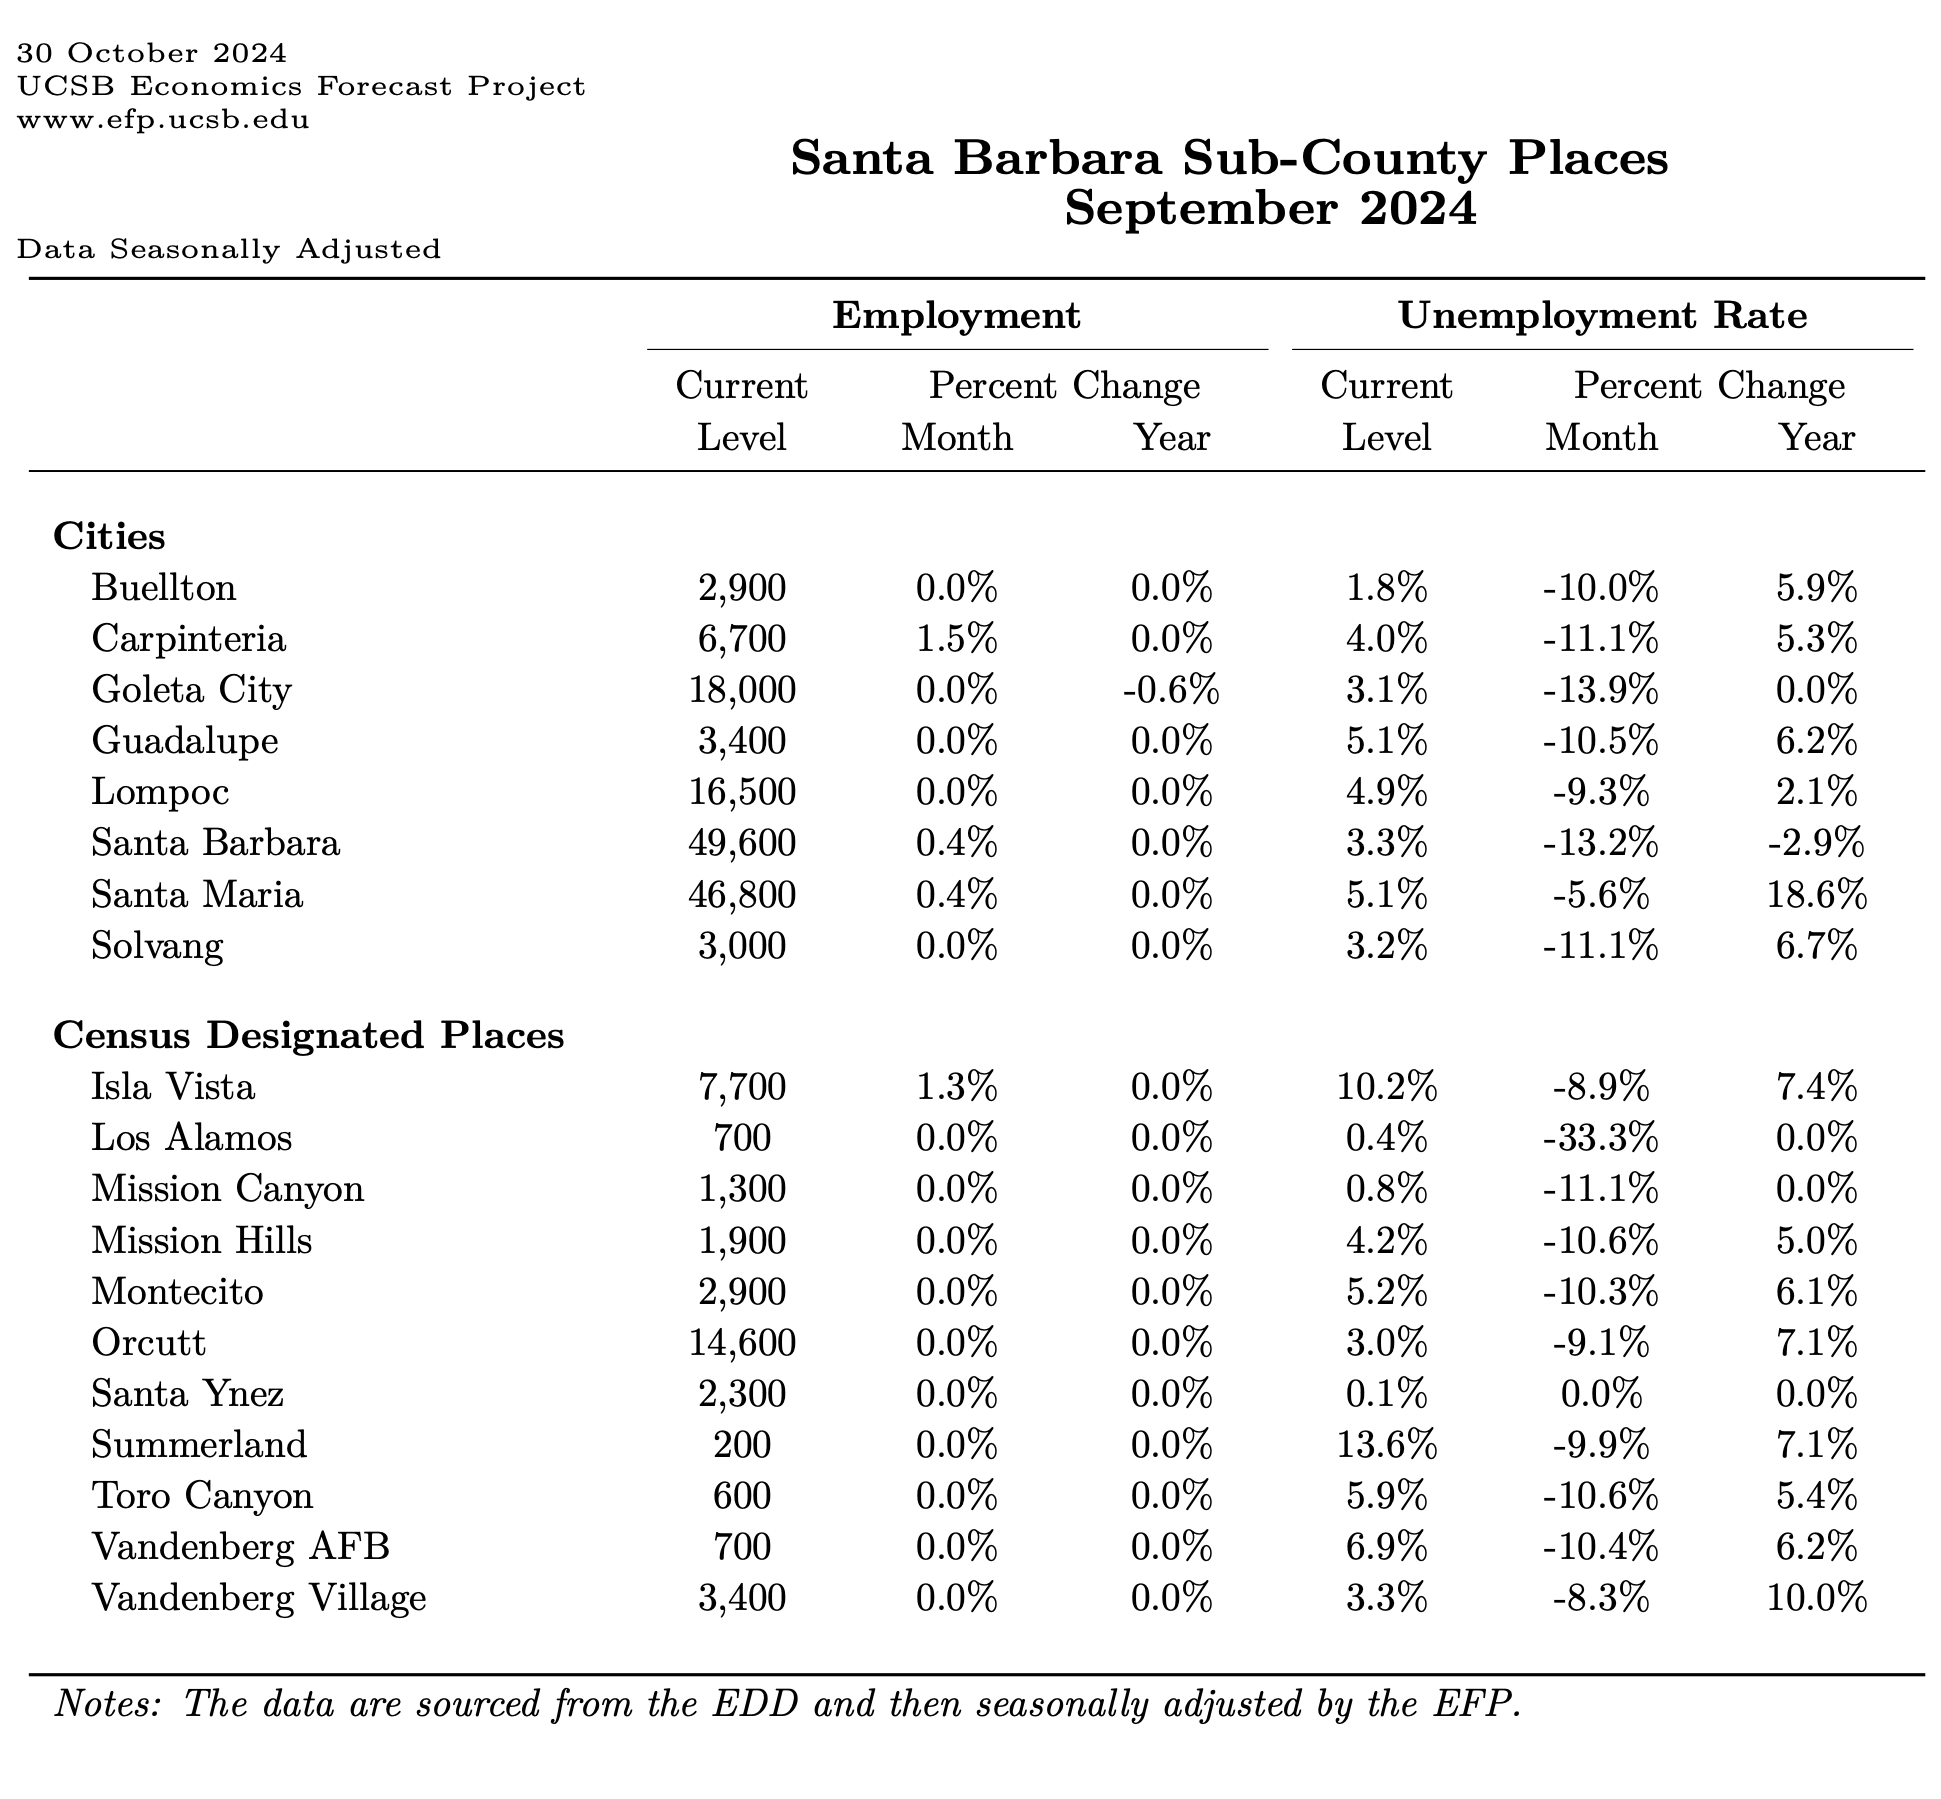
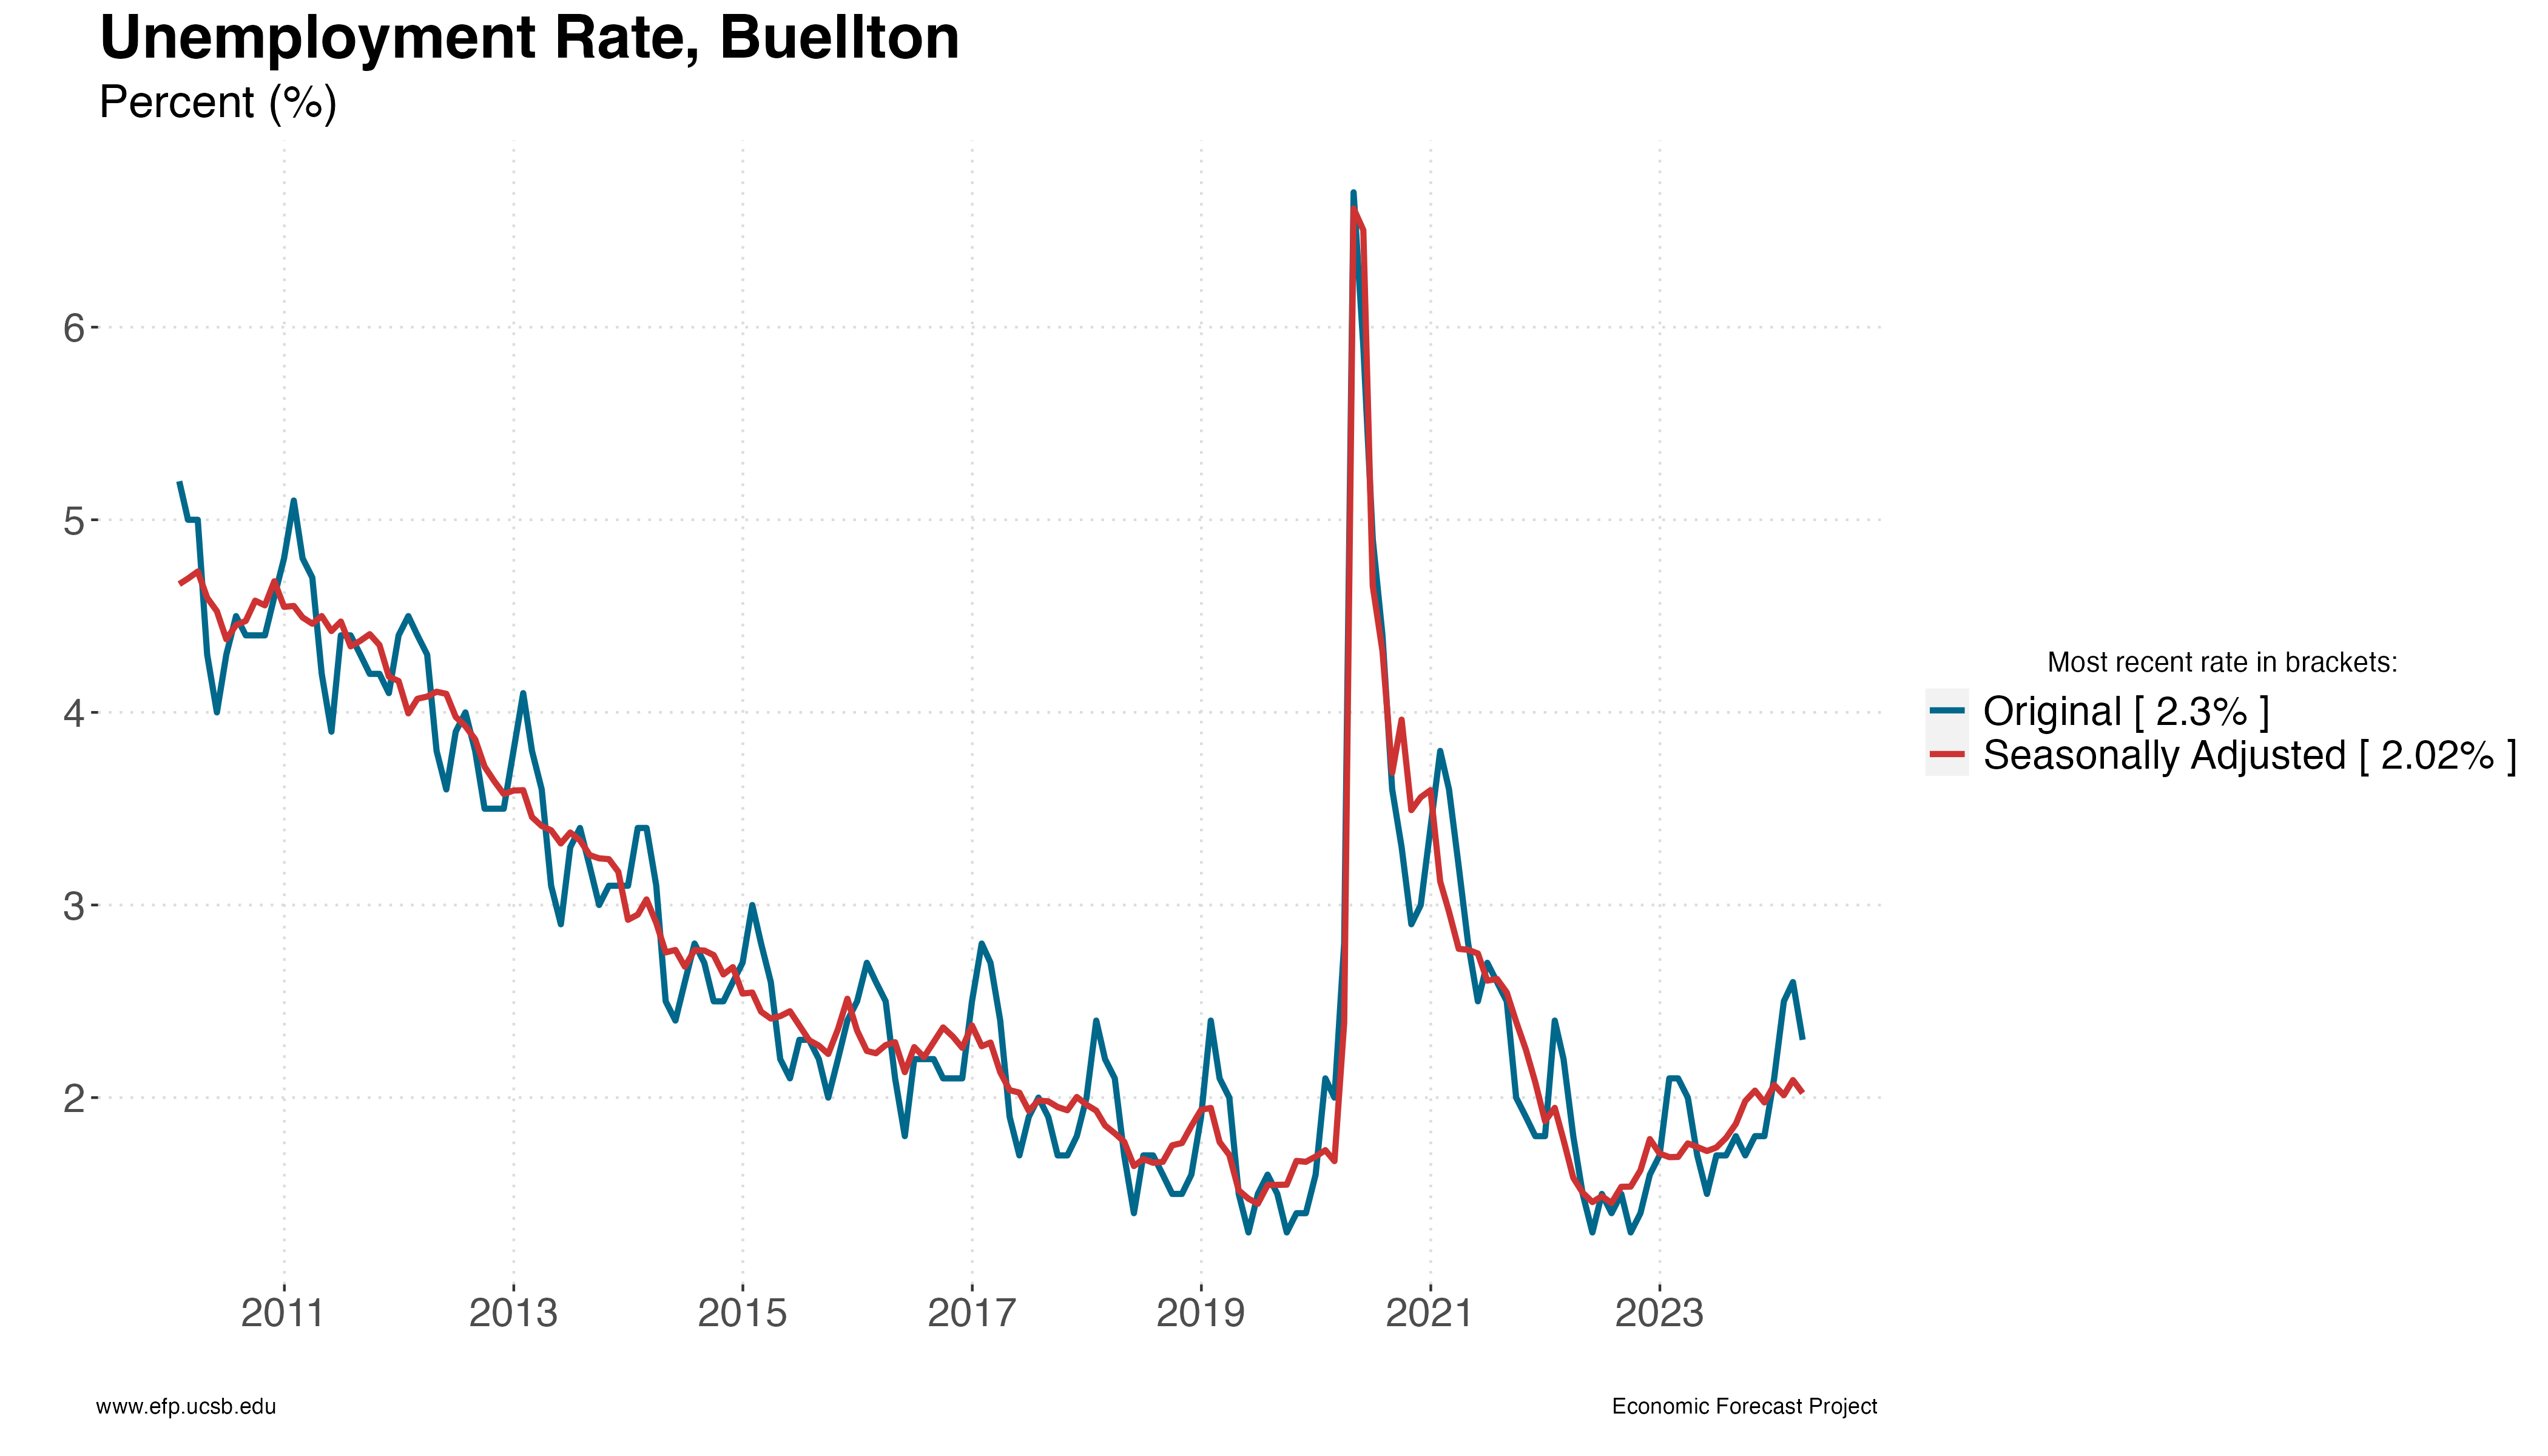
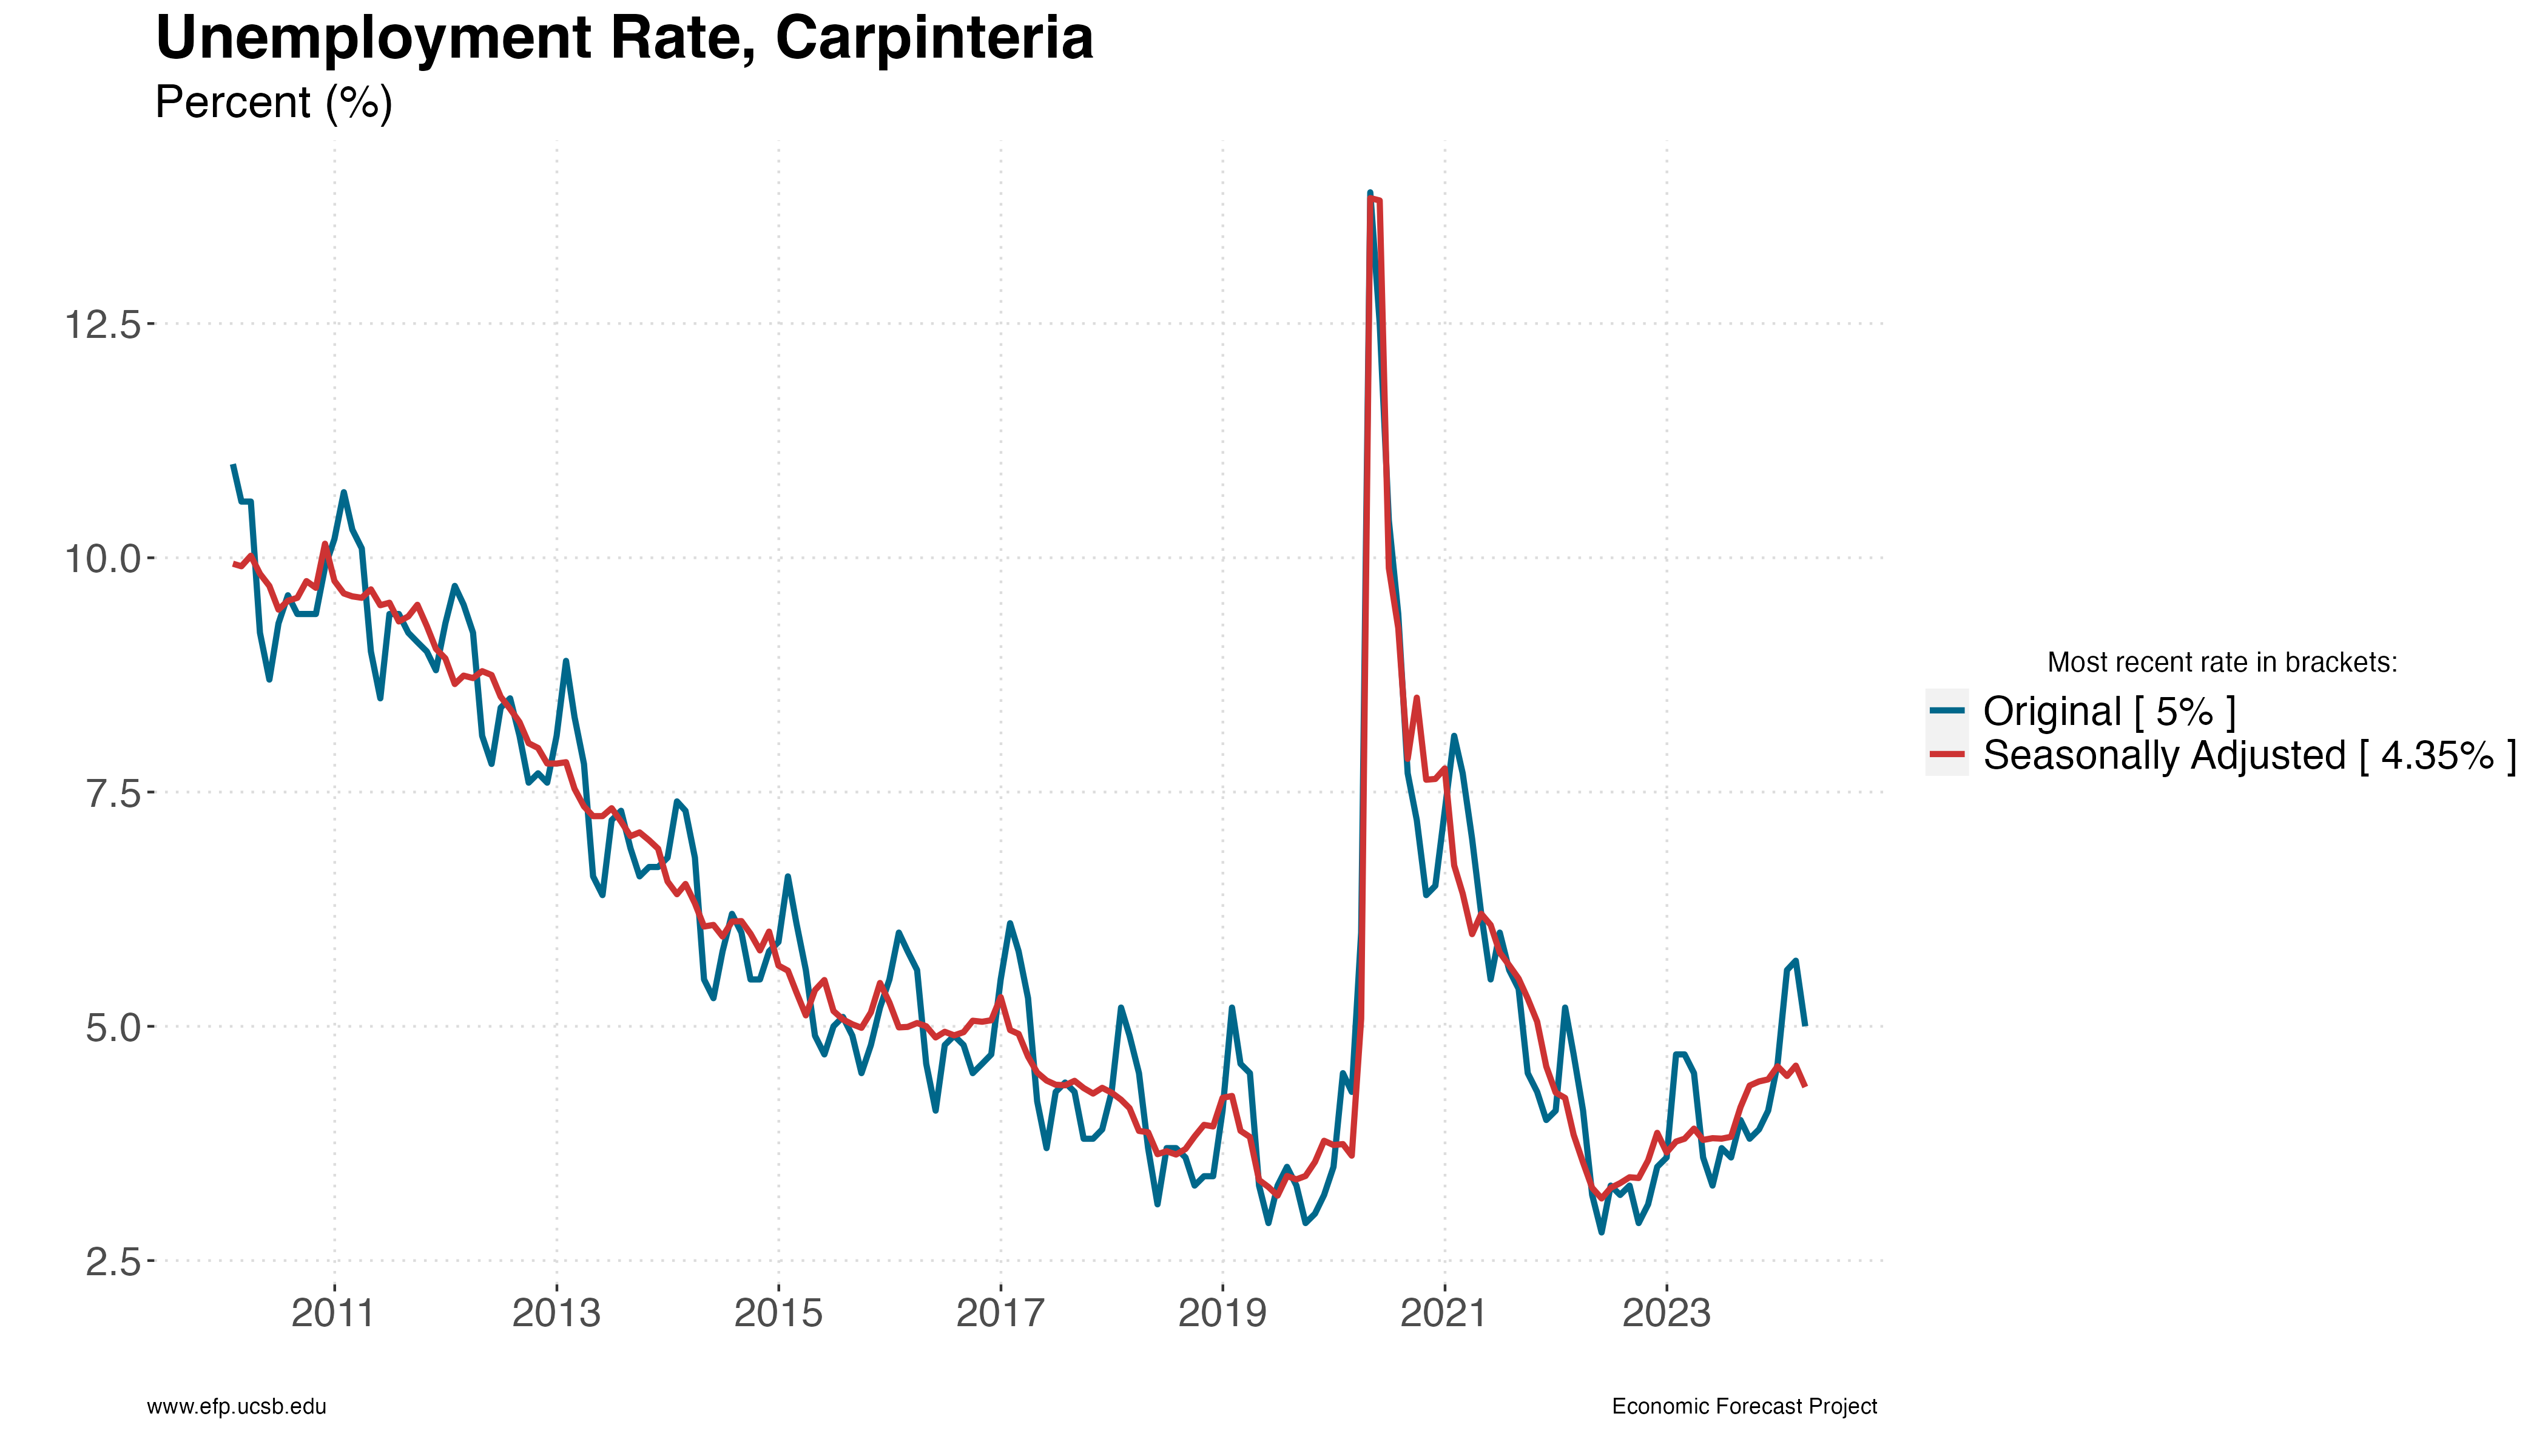
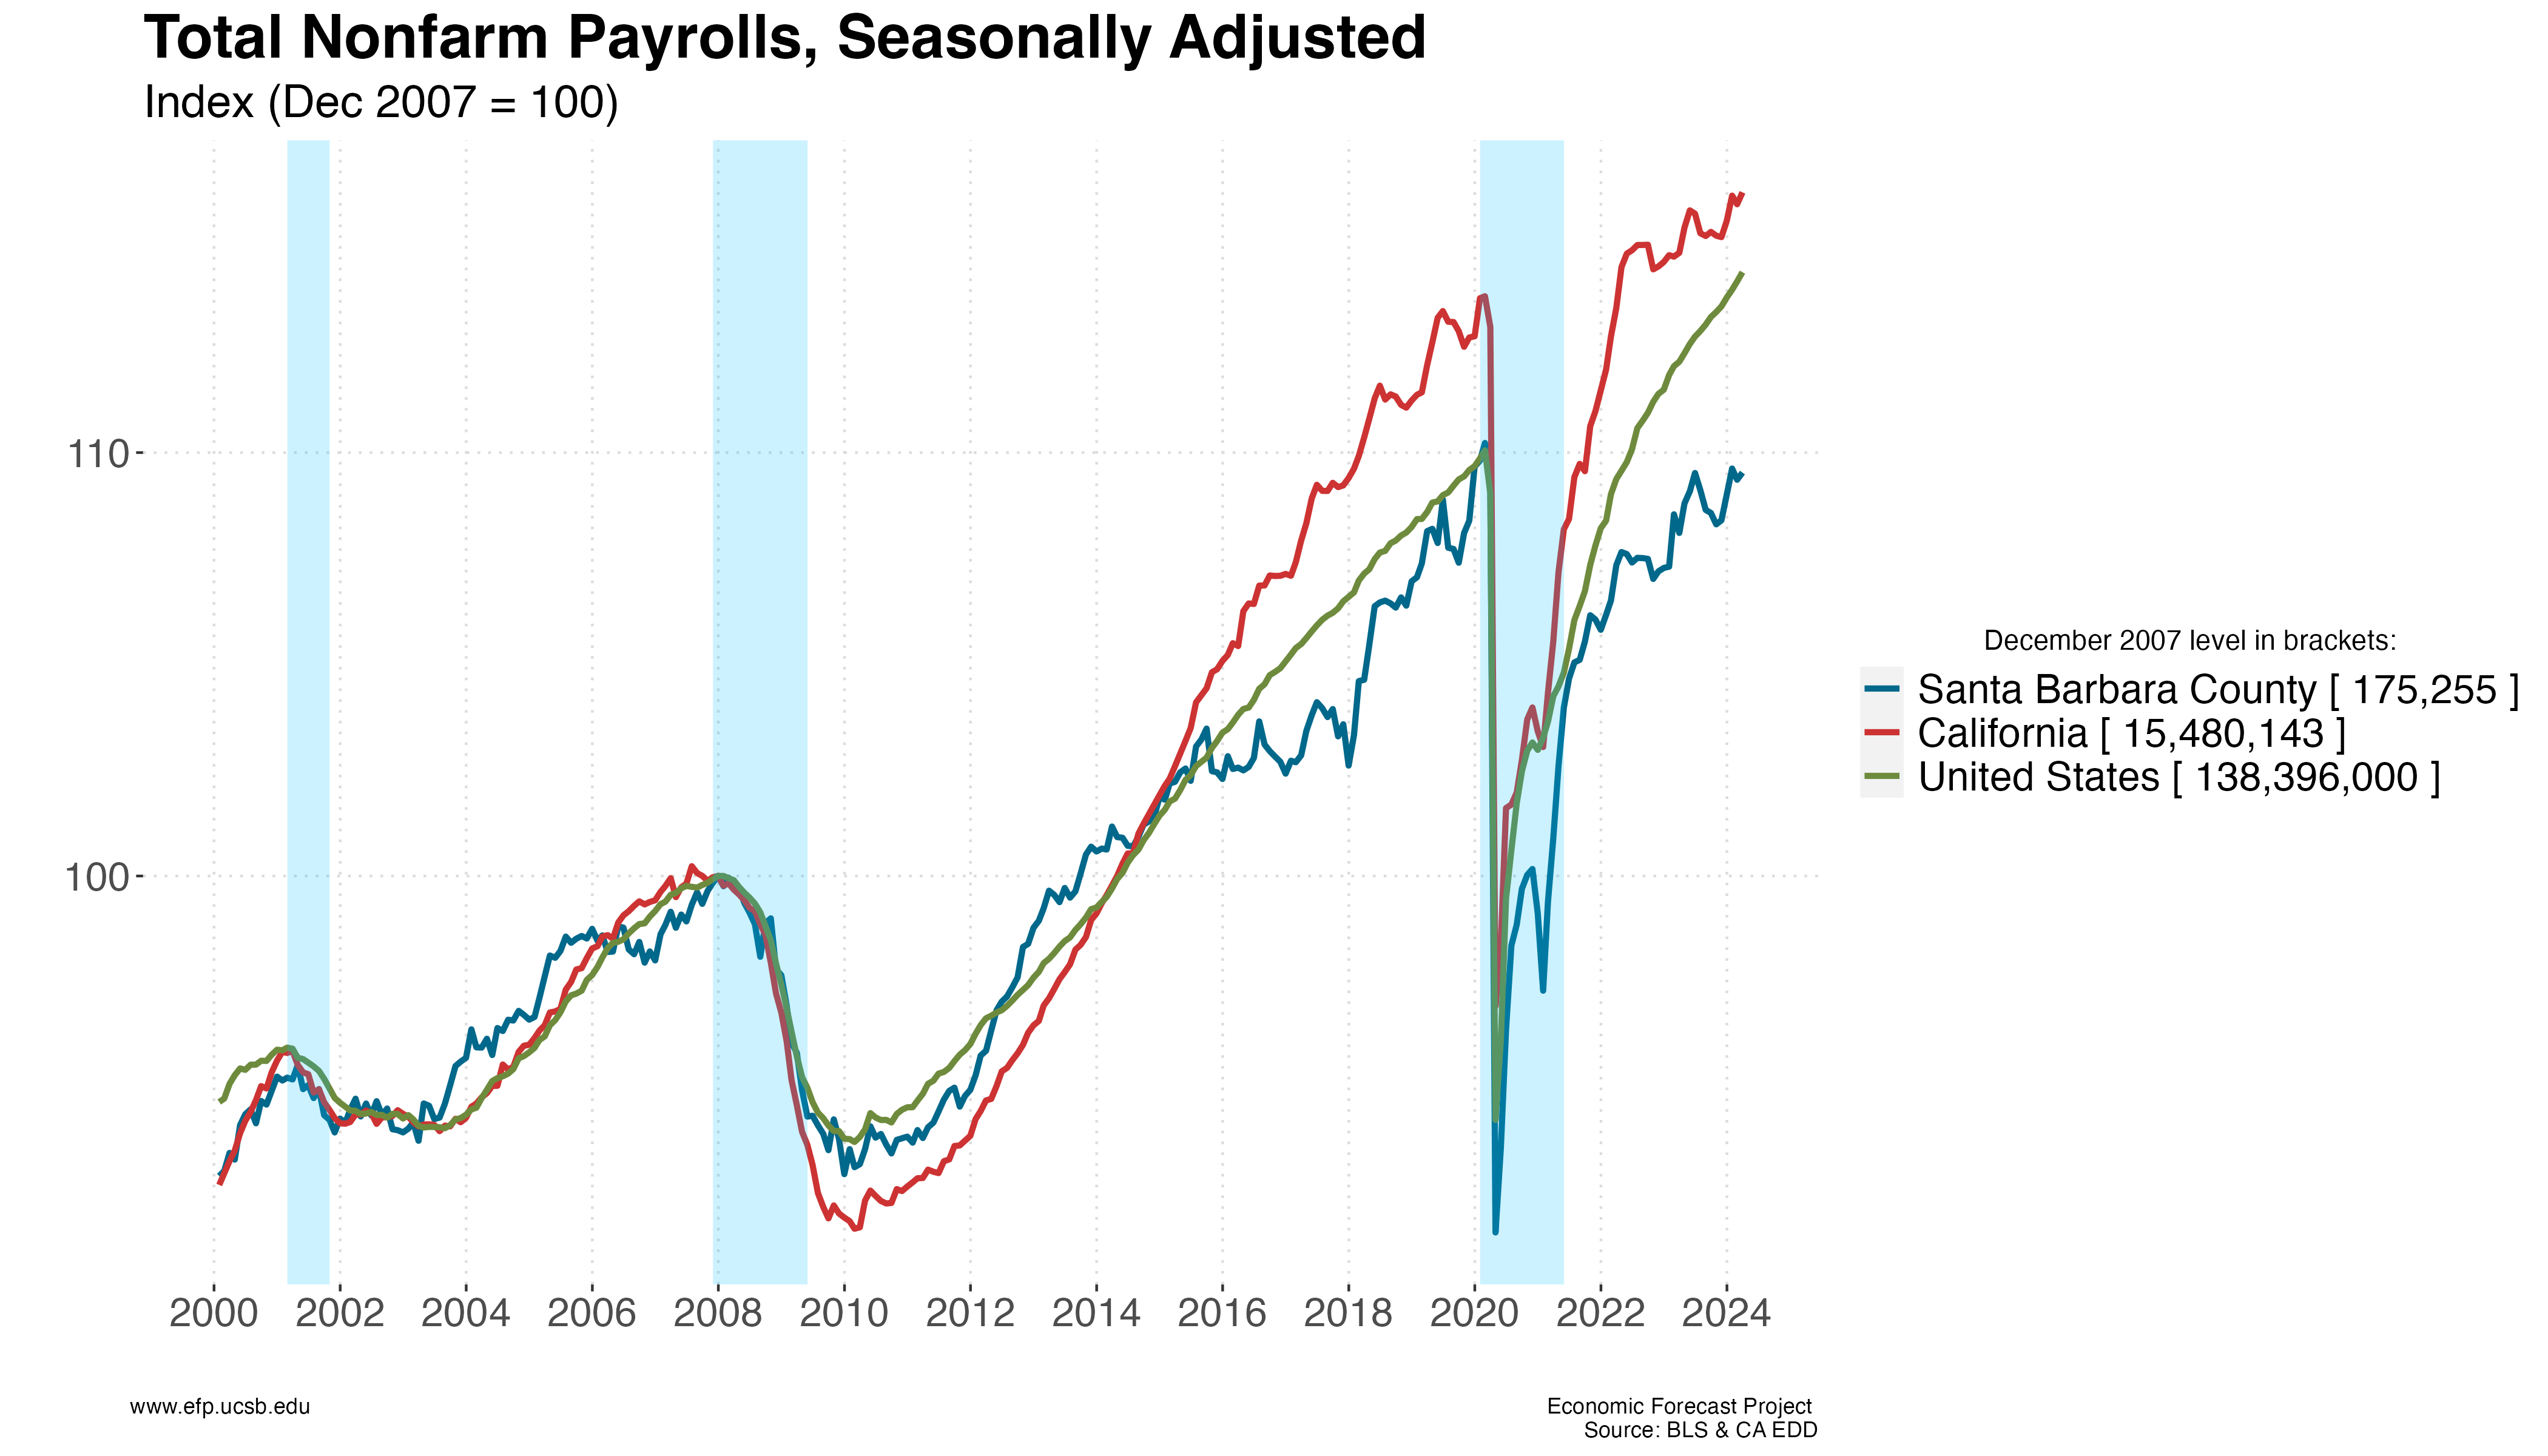
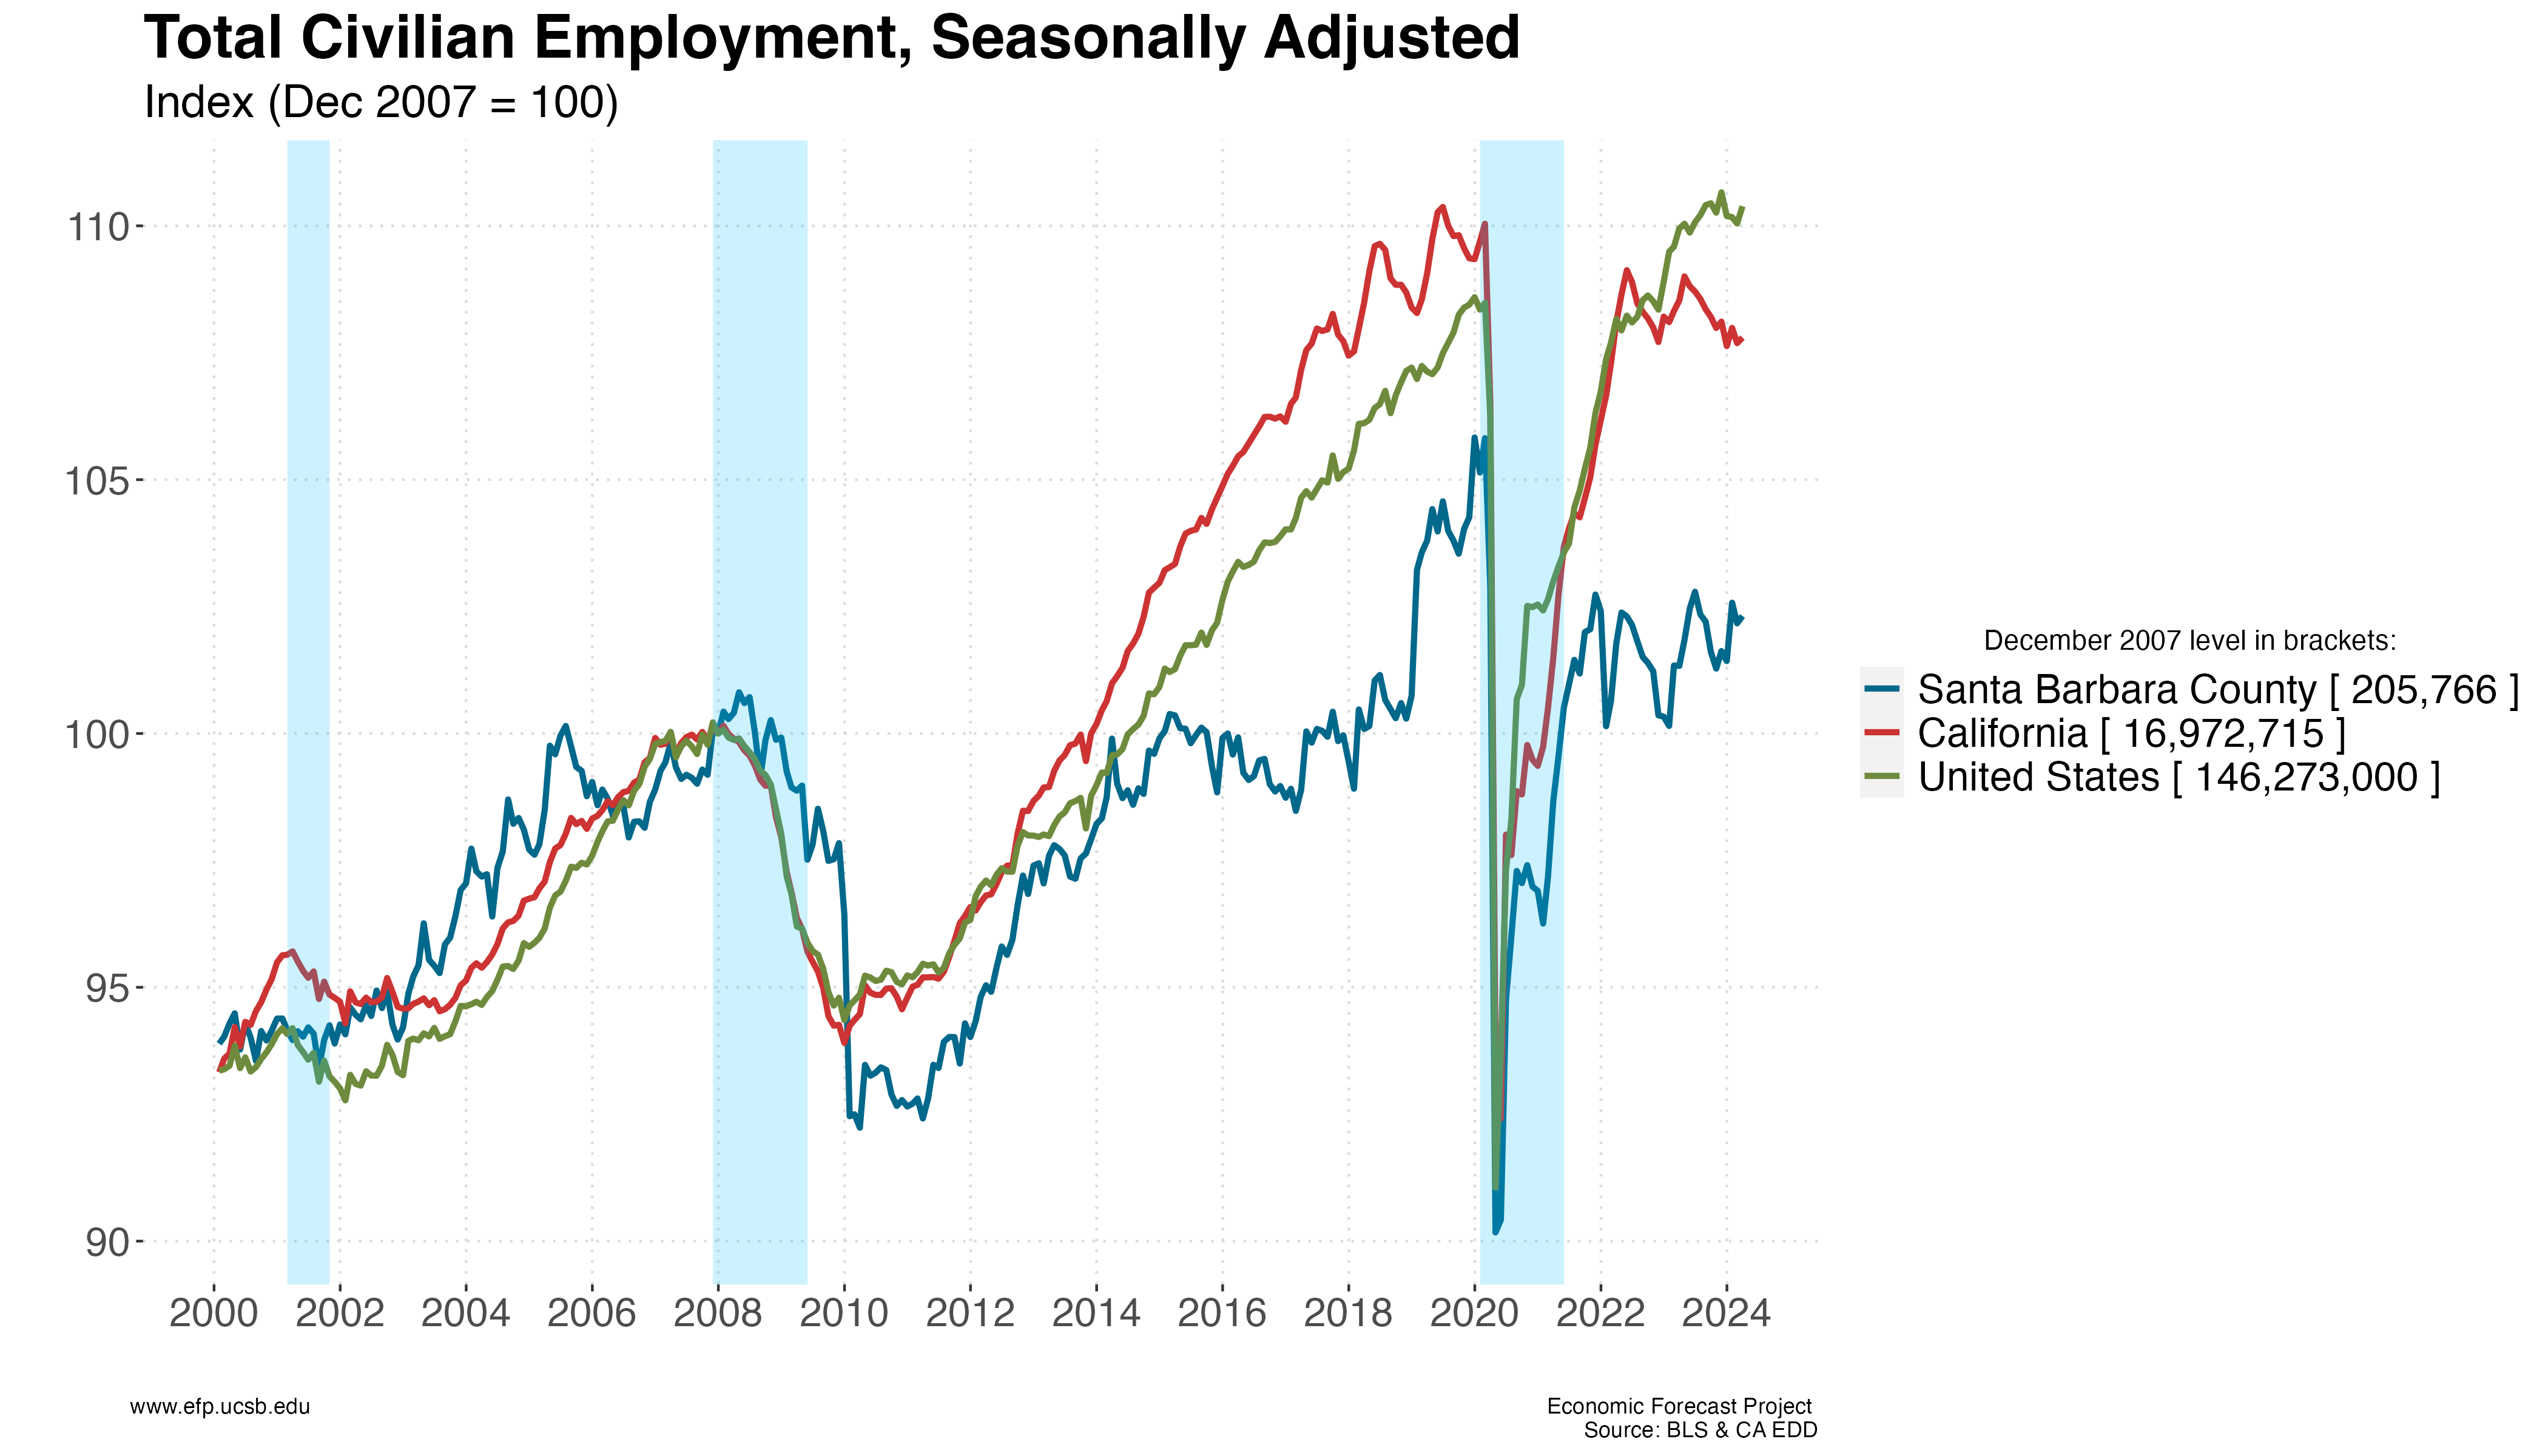
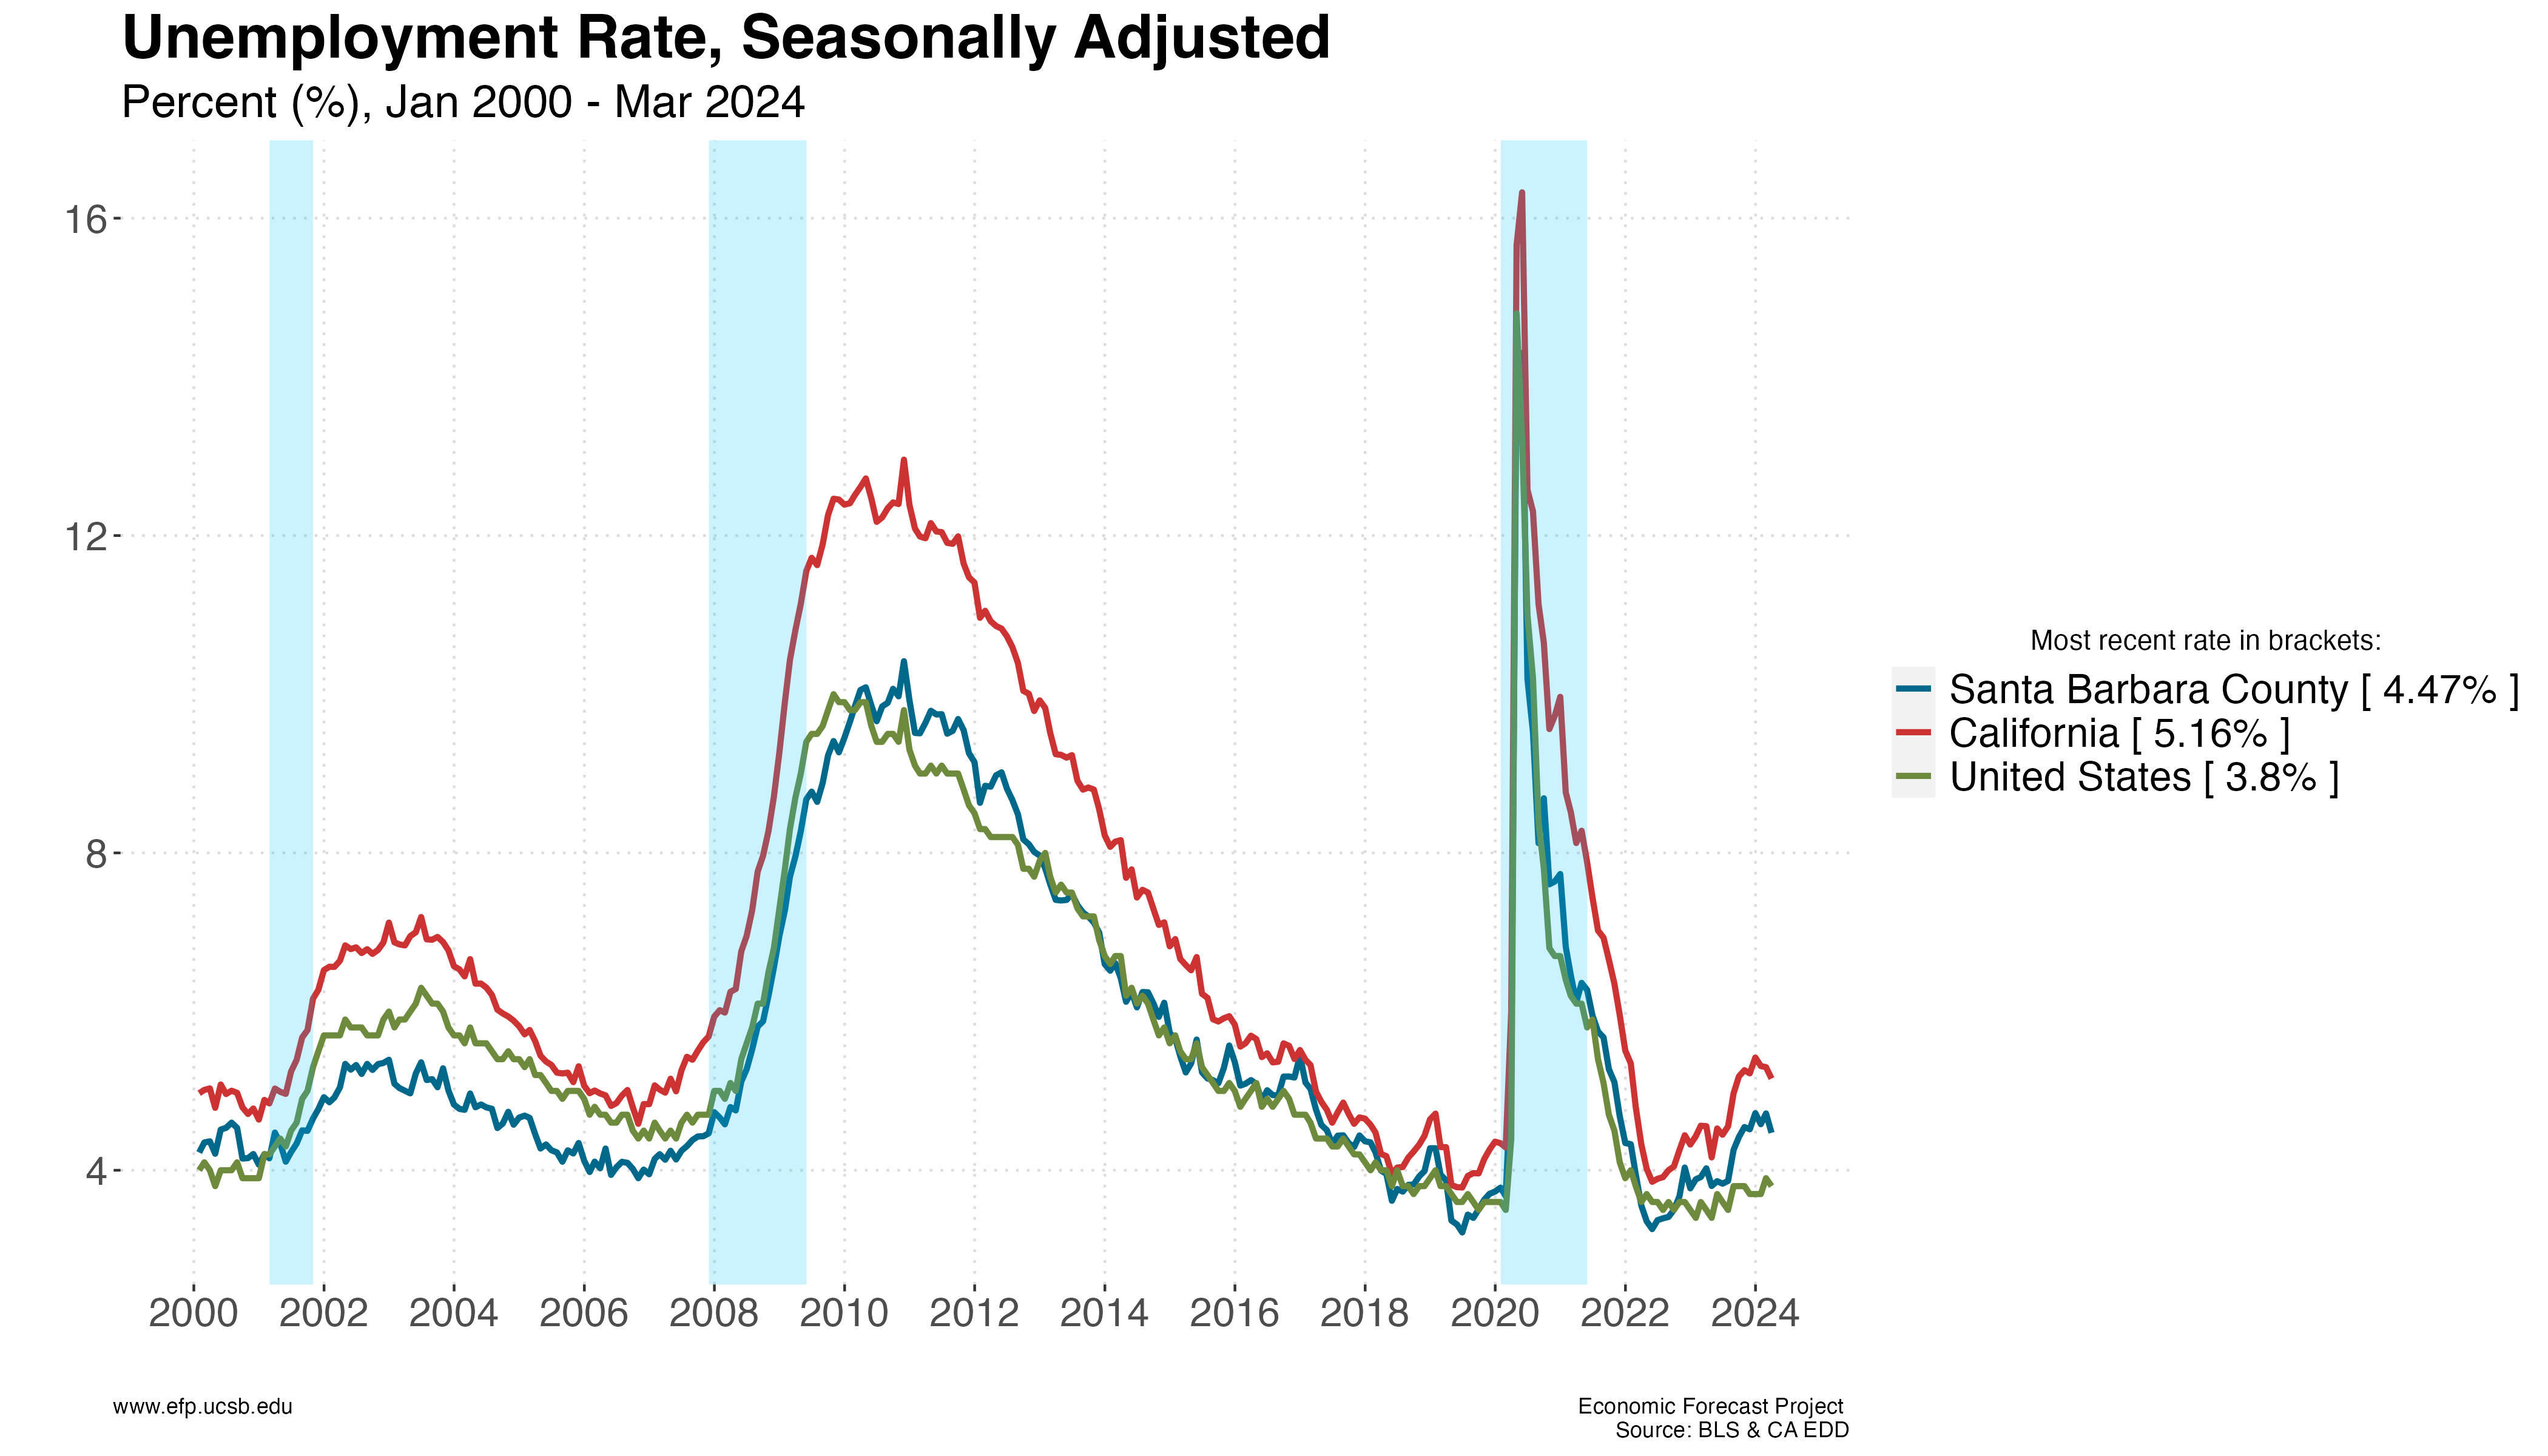
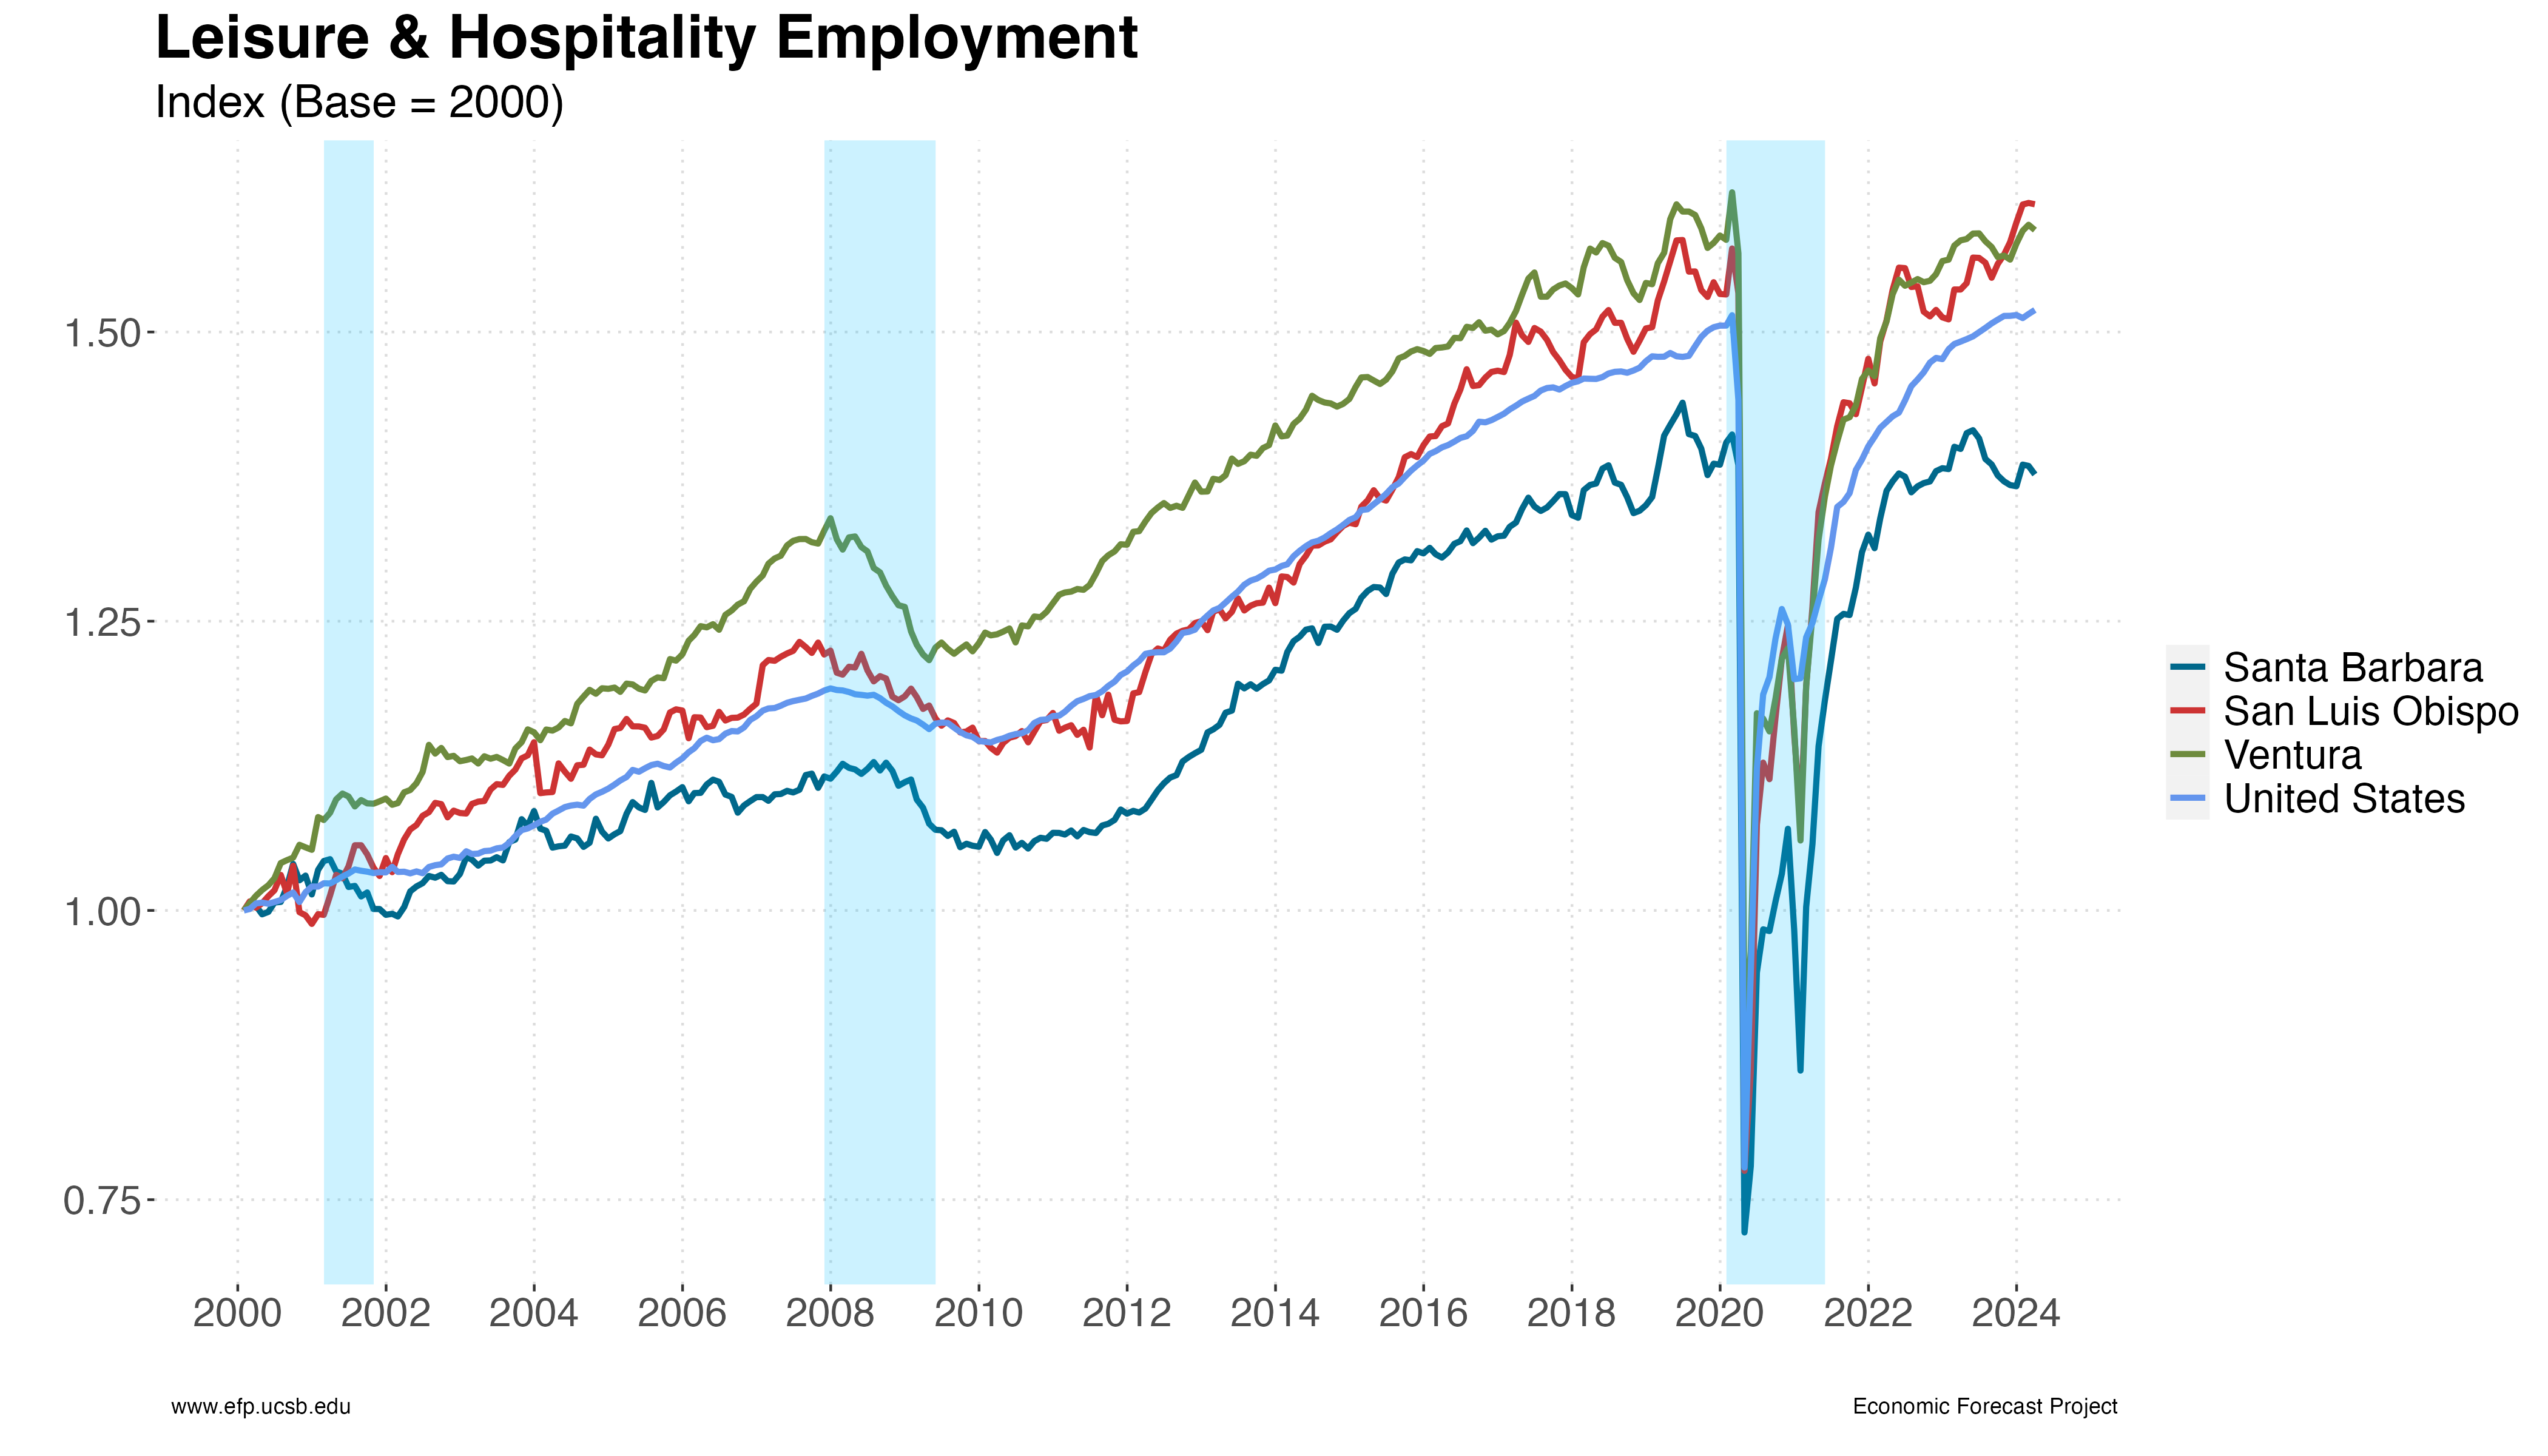
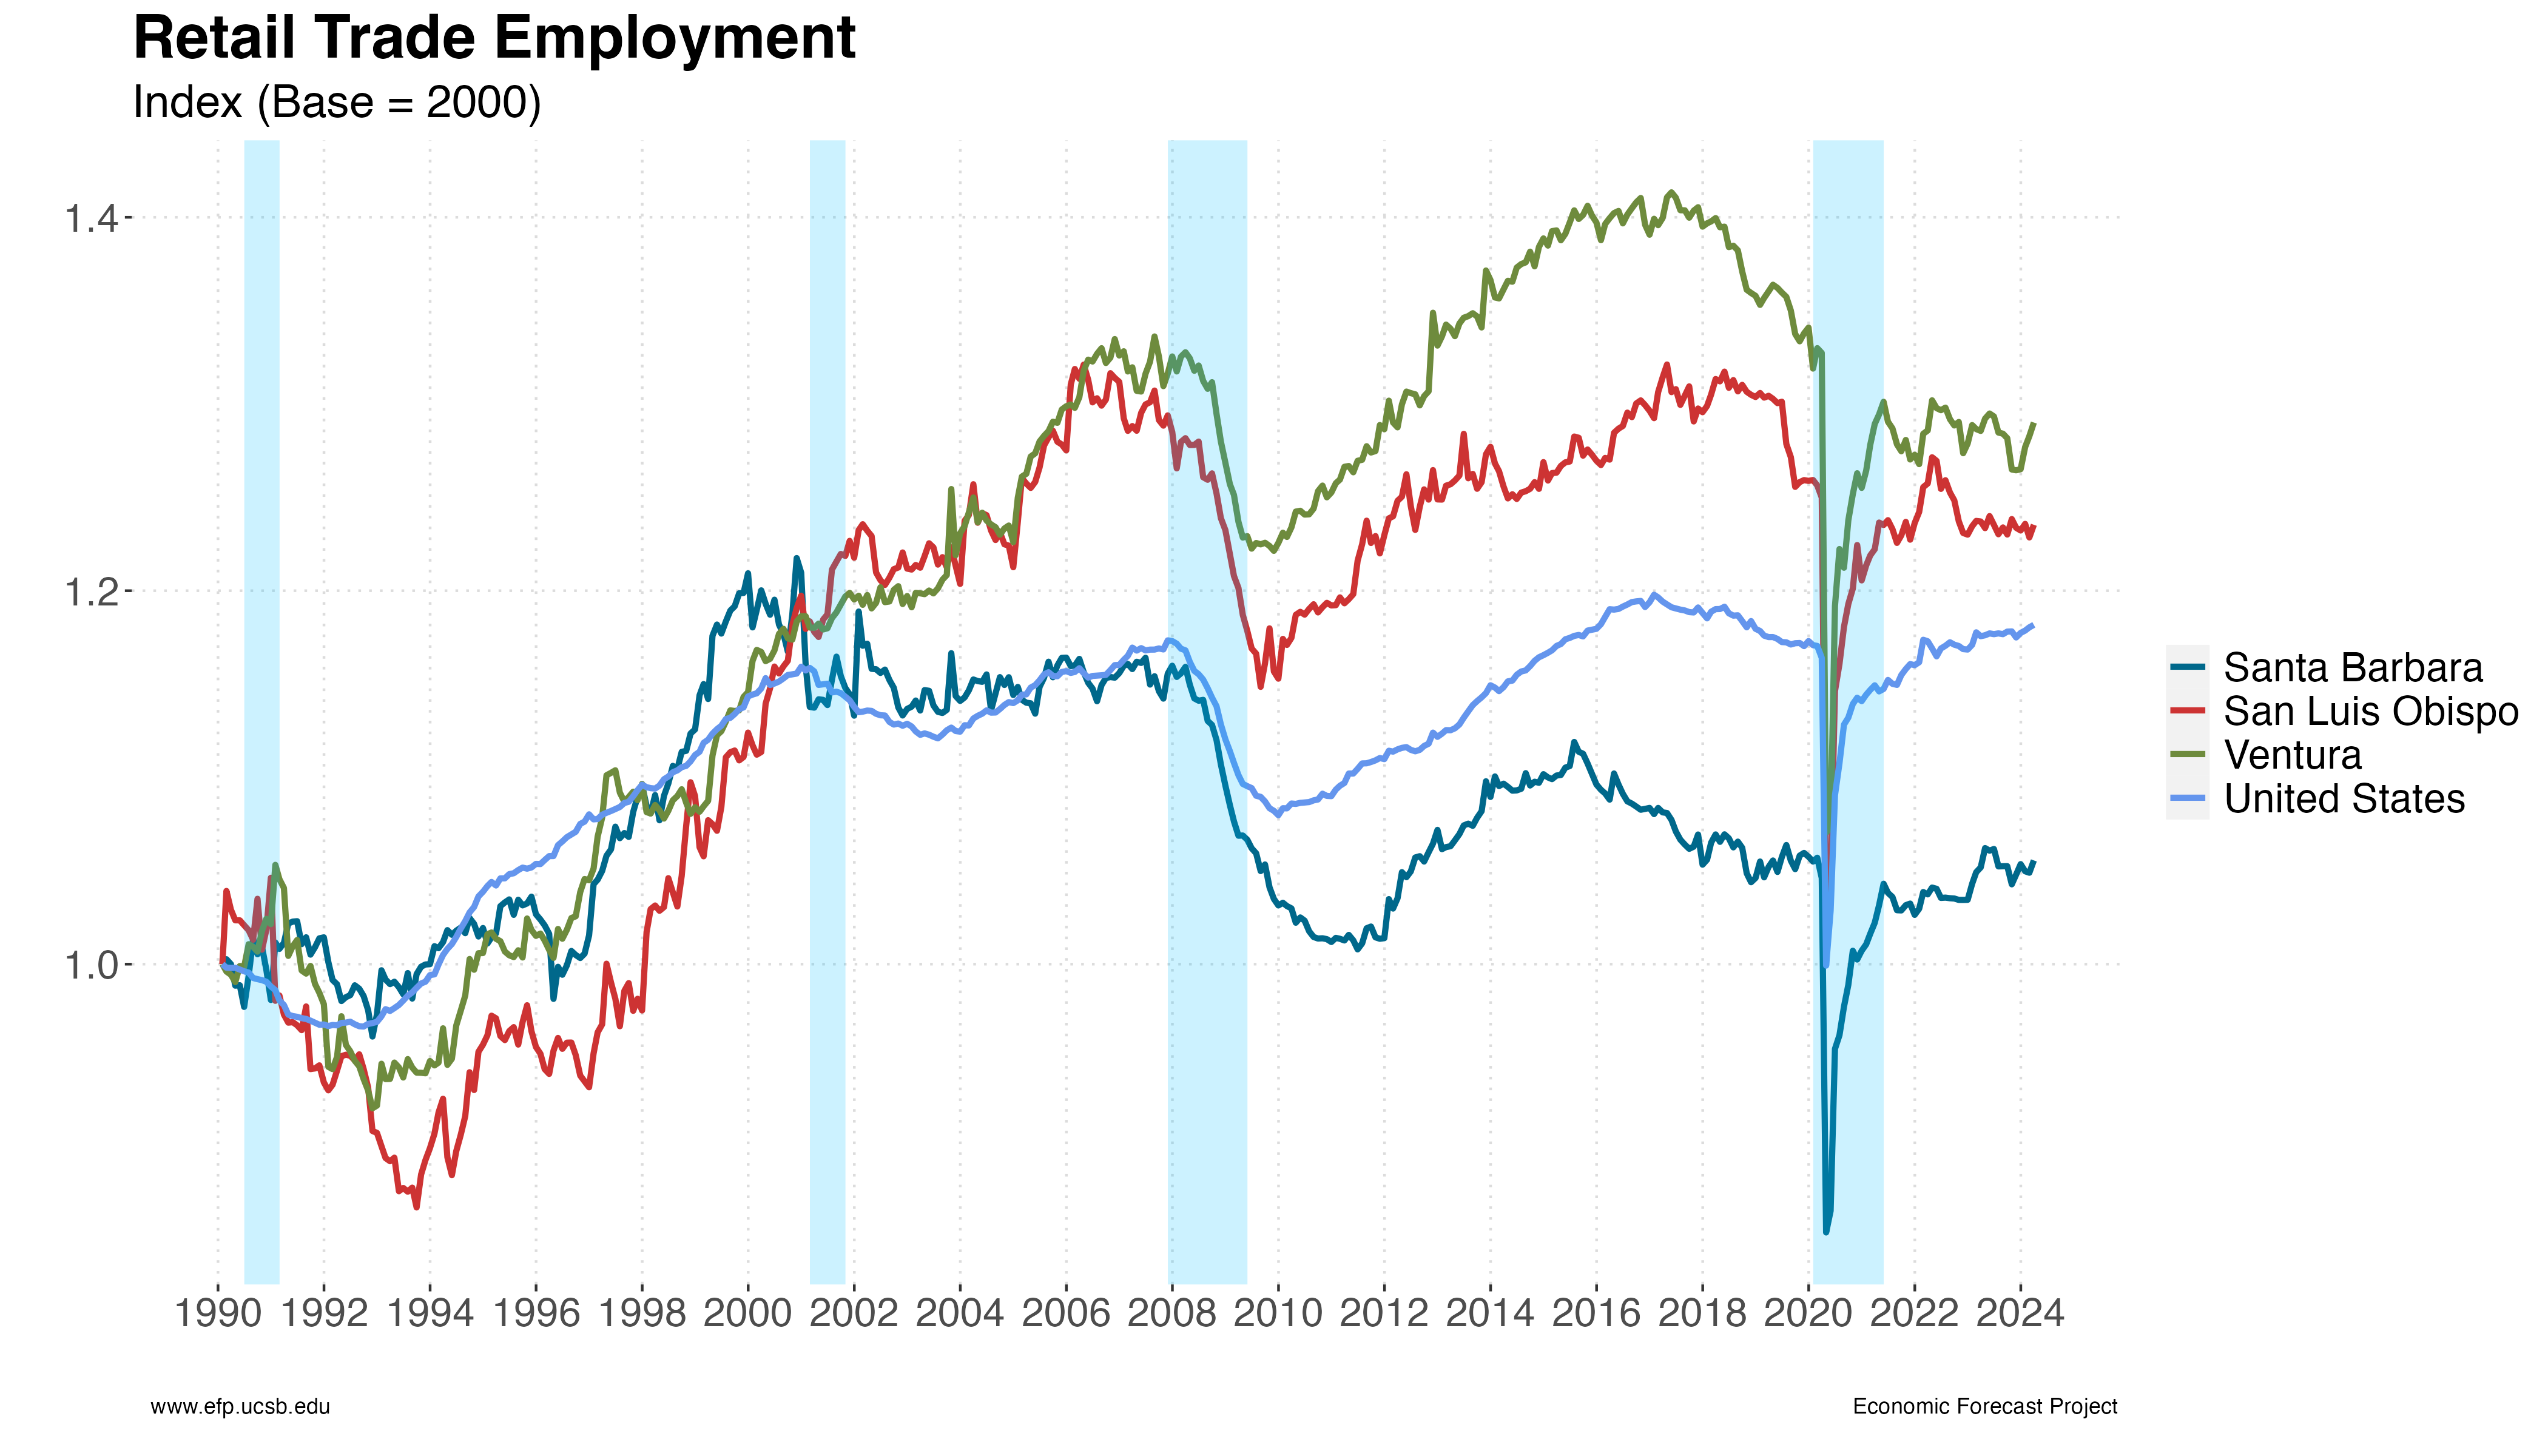
Below you will find a more detailed breakdown of the employment data for Santa Barbara County. In particular, we present employment estimates from multiple sources, employment broken down by industry, unemployment estimates for the county and disaggregated by sub-county places (cities, CDPs, etc.), and estimates for the overall labor force more generally (i.e. those individuals who are either employed or actively looking for work). We present some of the same data for the neighboring Ventura and San Luis Obispo counties. Finally, you will also find data below pertaining to the tri-county area and the relative performance of Santa Barbara Counties with the neighboring Ventura and San Luis Obispo counties, and the aggregate economy more generally.