2 Business Activity
2.1 GDP
Key Points:
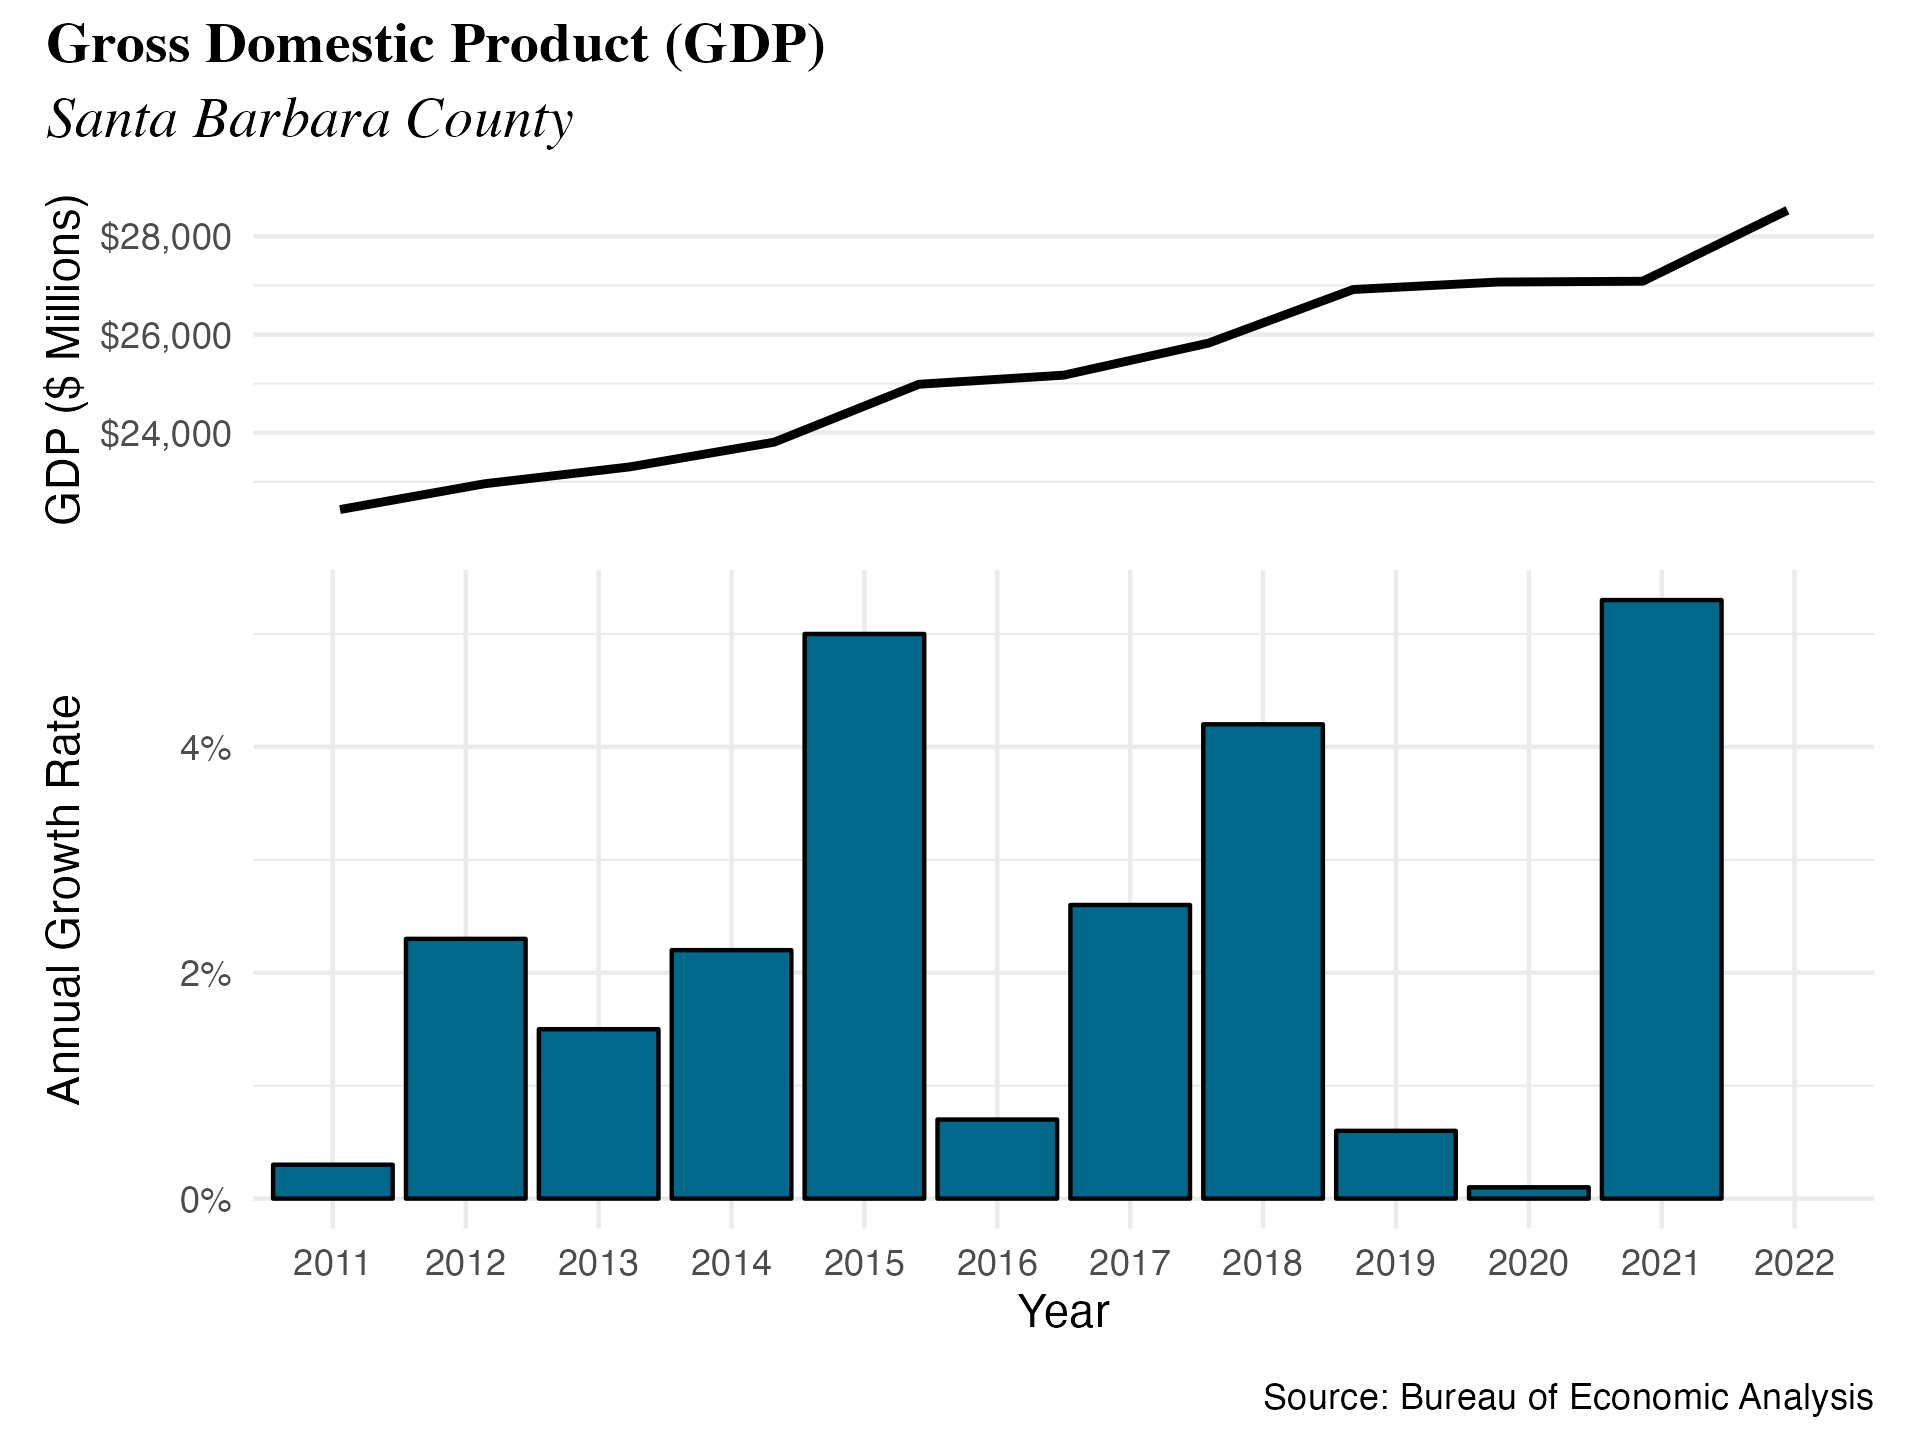
- Real GDP rised at an annual rate of 5.3% in Santa Barbara County in 2021, compared to a 0.1% increase in 2020.
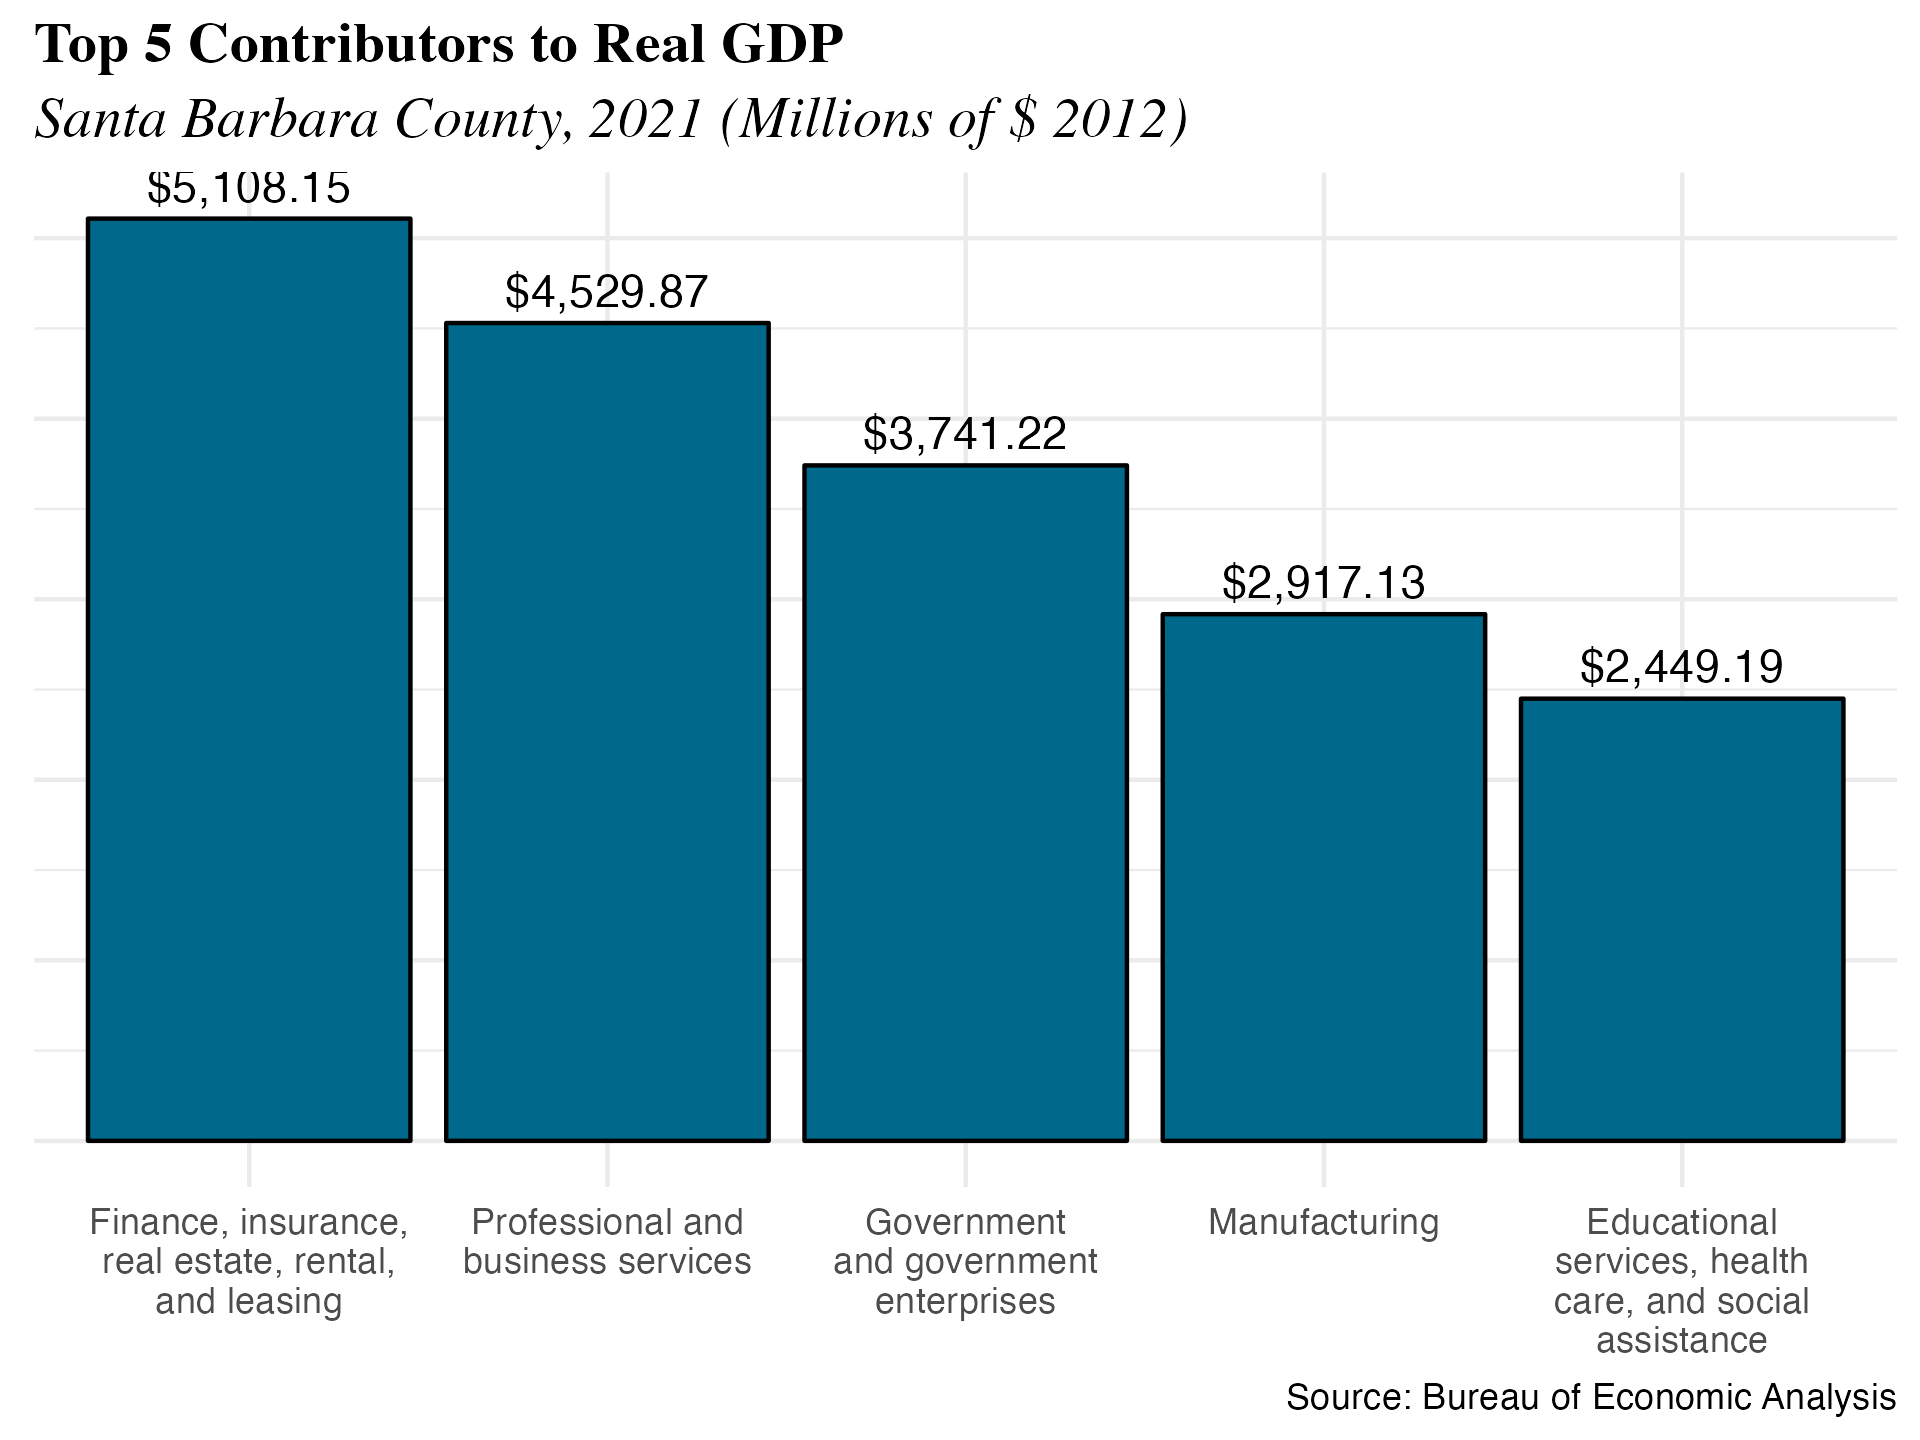
- The Finance industry was the largest contributor to Real GDP in Santa Barbara. The Professional & Business Services industry was the second largest contributor in 2021 and Government followed with the third largest contribution to real GDP in Santa Barbara.
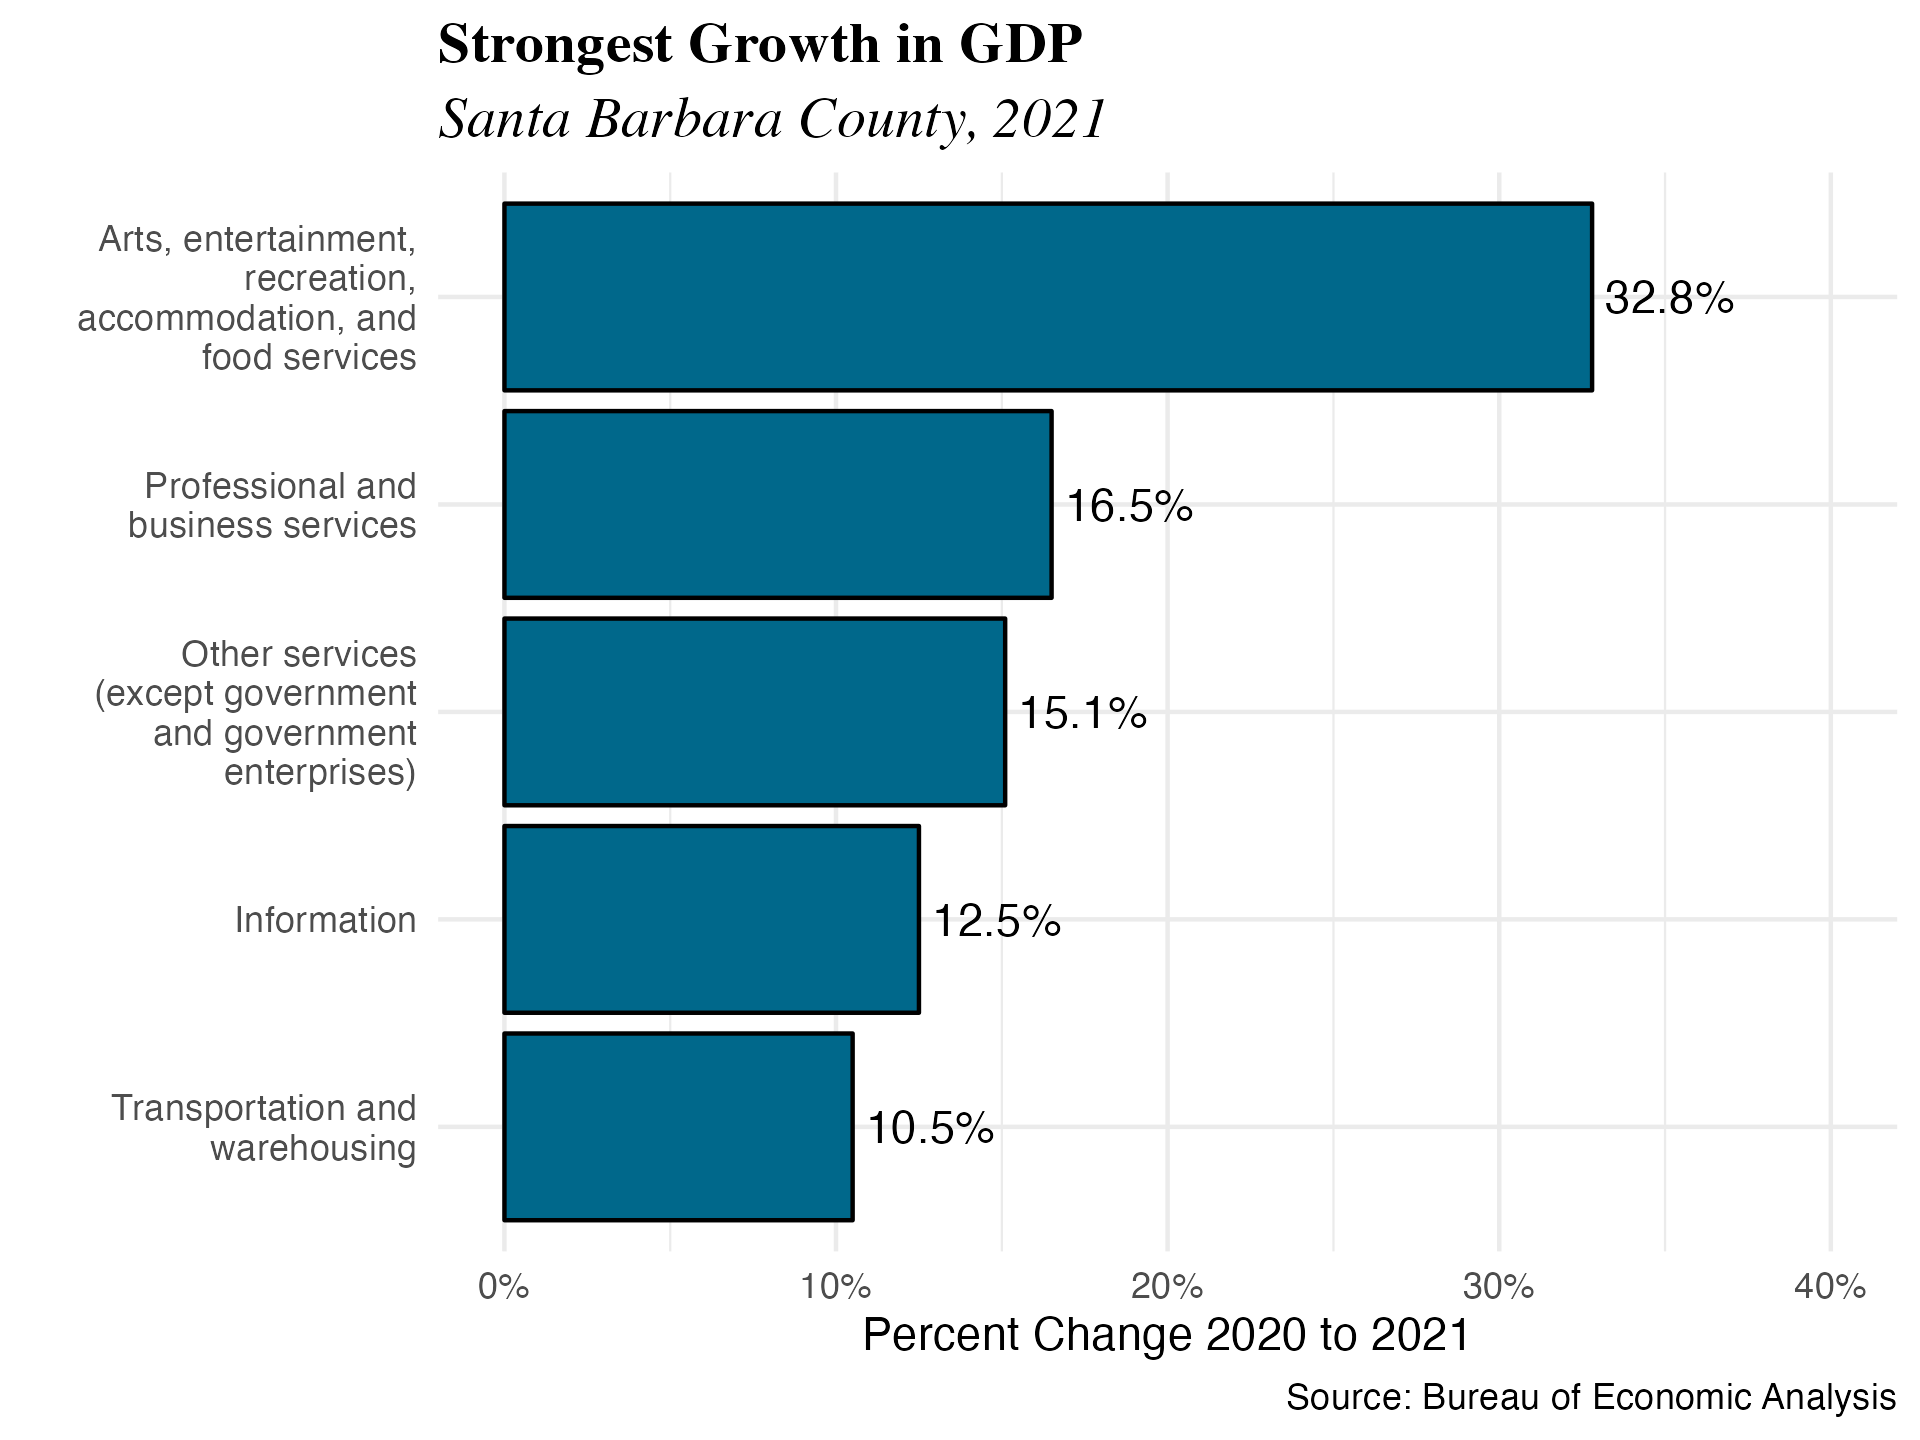
- Arts was the fastest increasing industry in 2021, with an increase in GDP contribution of 32.8%.
Real Gross Domestic Product (GDP) measures the value of all goods and services produced within a certain location over a certain period of time. It remains one of the best measures of economic growth and well-being, not only for the nation but also for local areas. Unlike the data on national GDP, data on GDP for Santa Barbara County is only reported annually and at a considerable lag. Typically, we rely on alternative measures to judge the health of our local economy like employment statistics and housing prices, which are released more frequently. However, GDP remains a relevant statistic to determine long-run trends in the county’s economic growth and industry mix. It also allows for a direct comparison to growth in the nation and state.
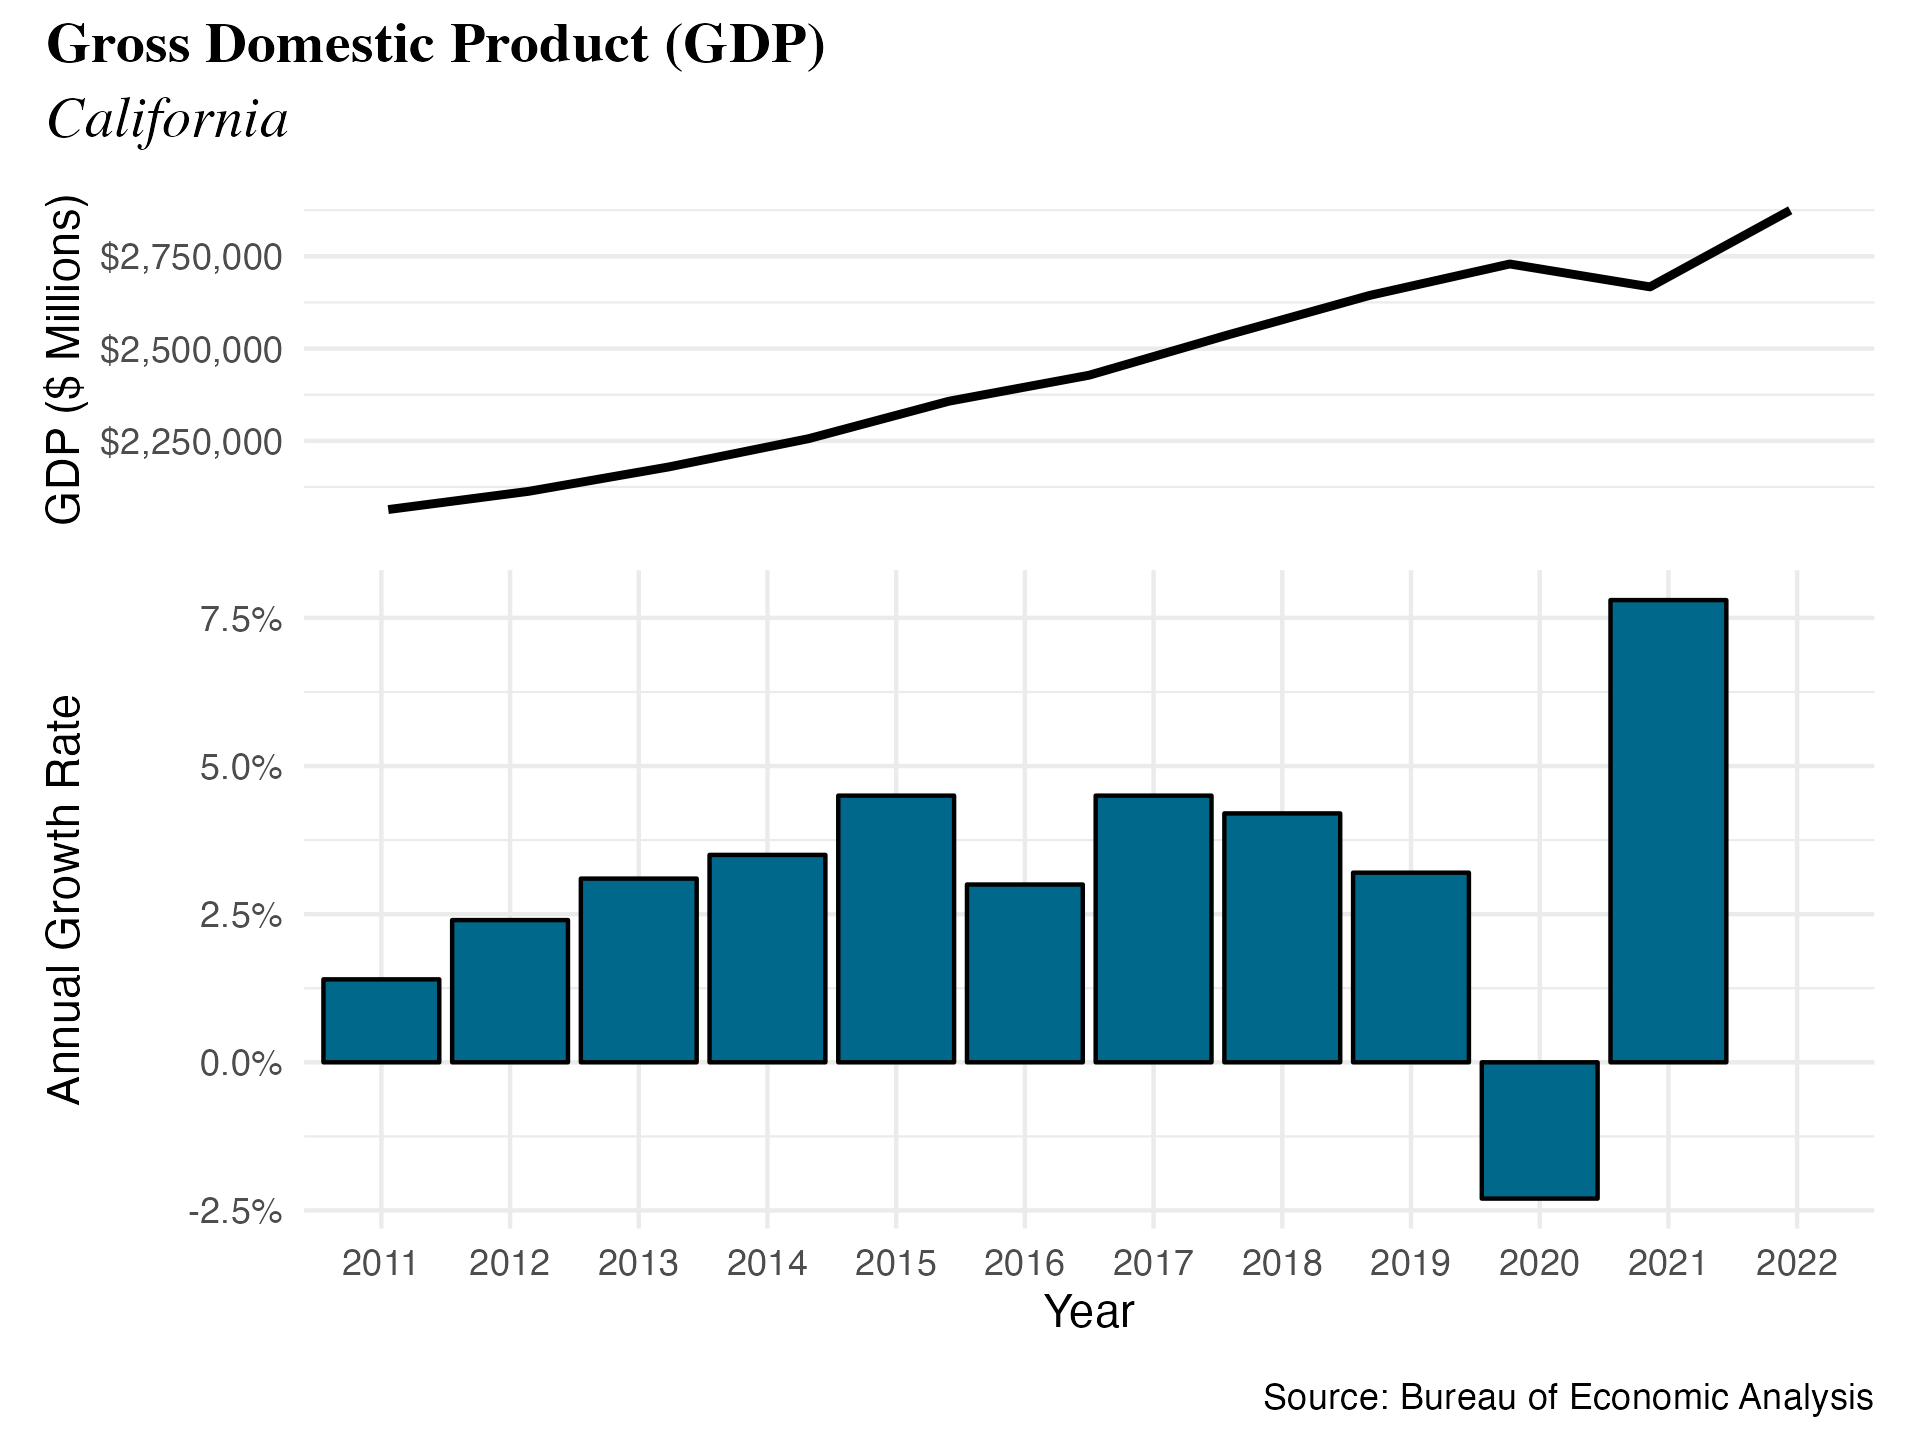
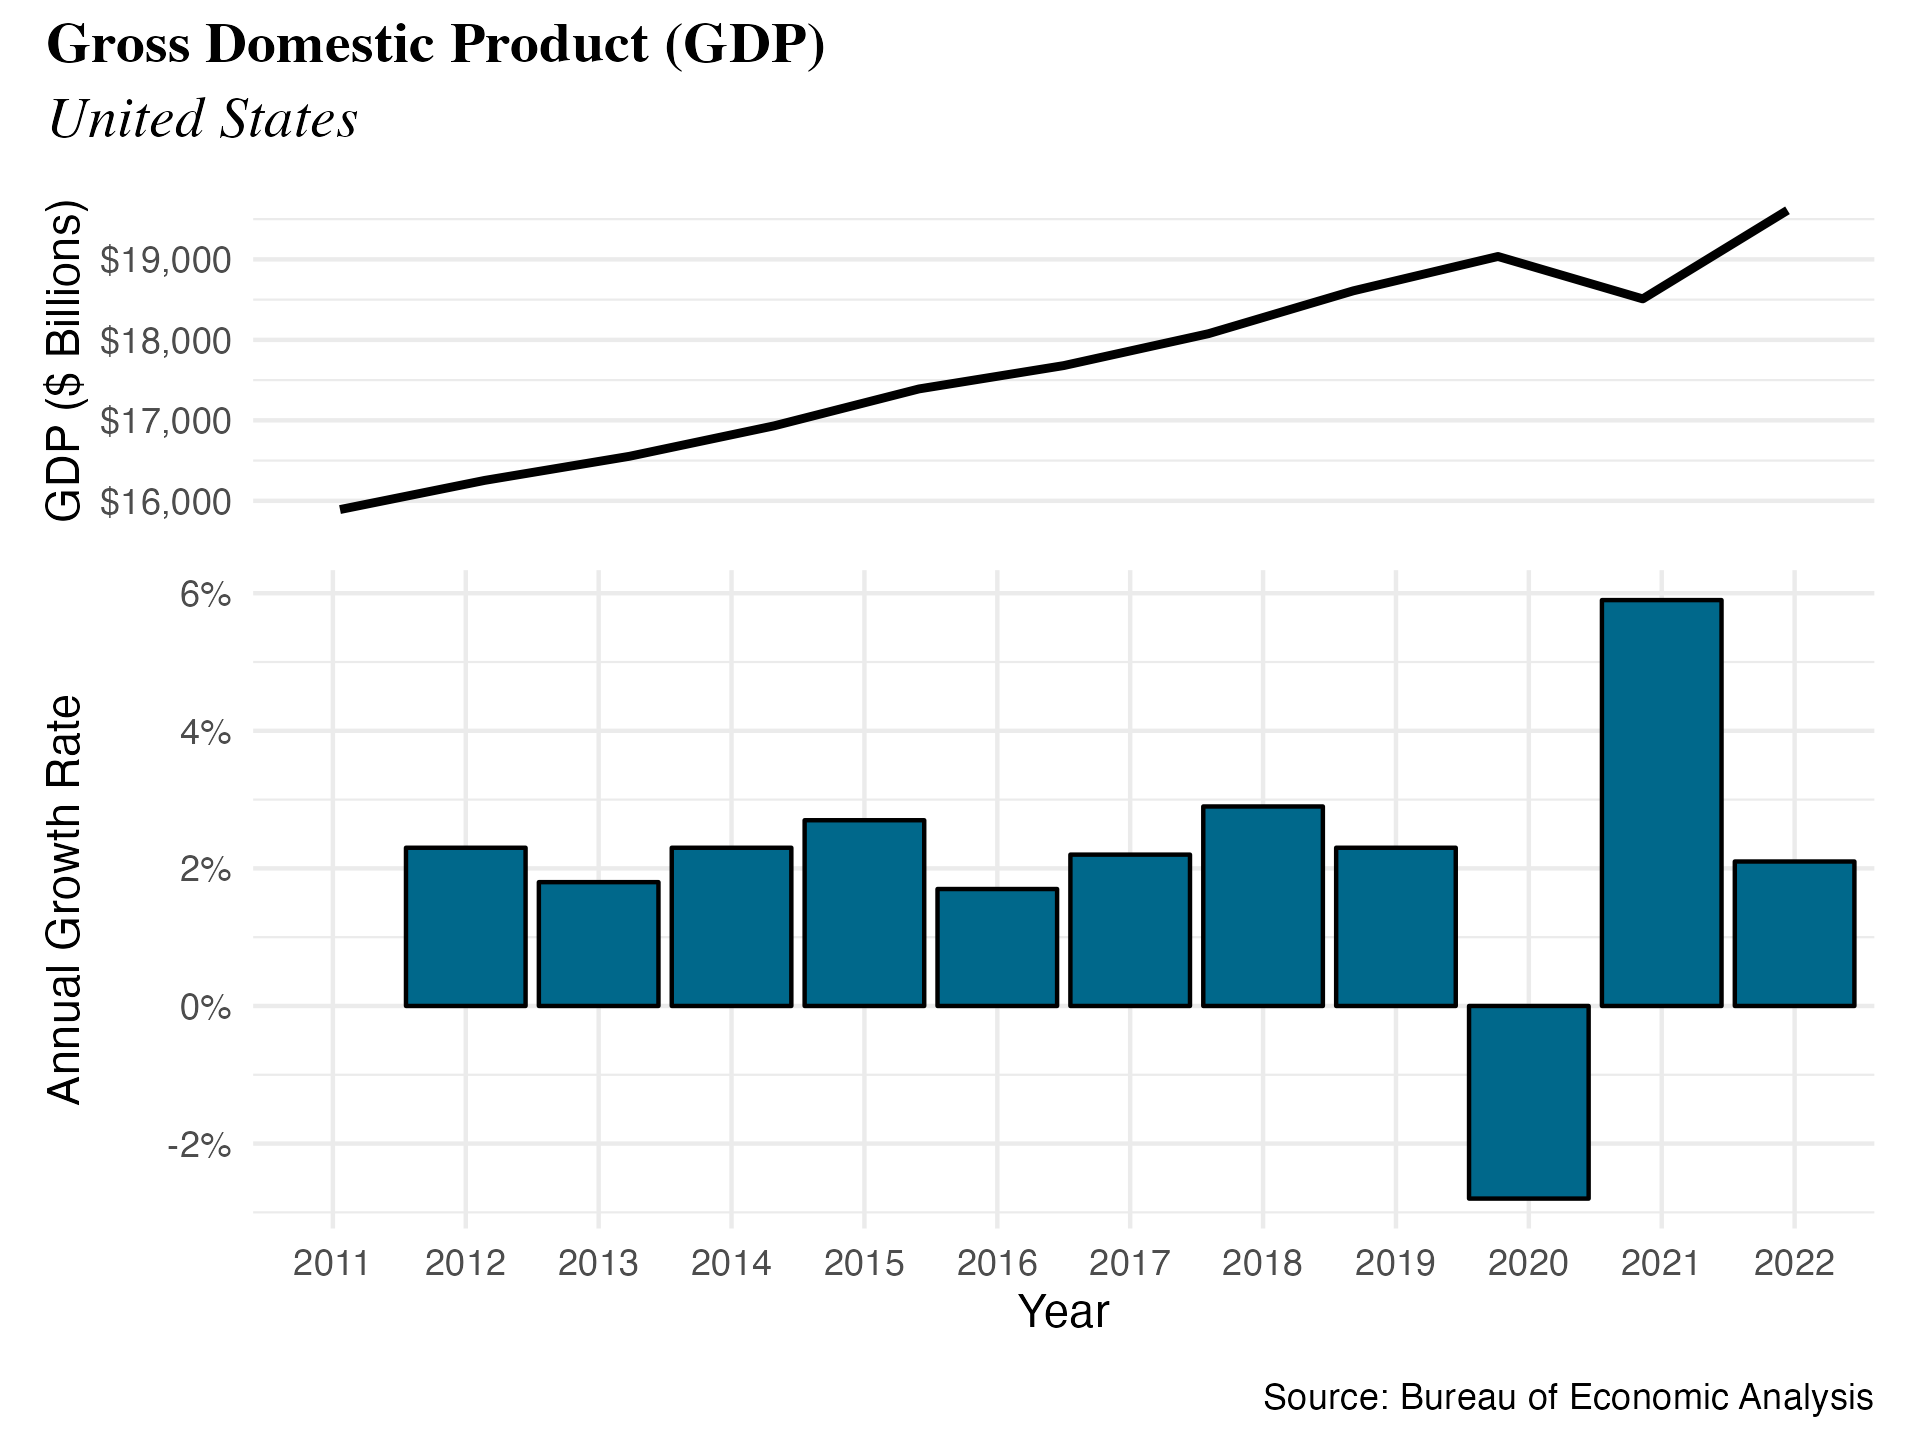
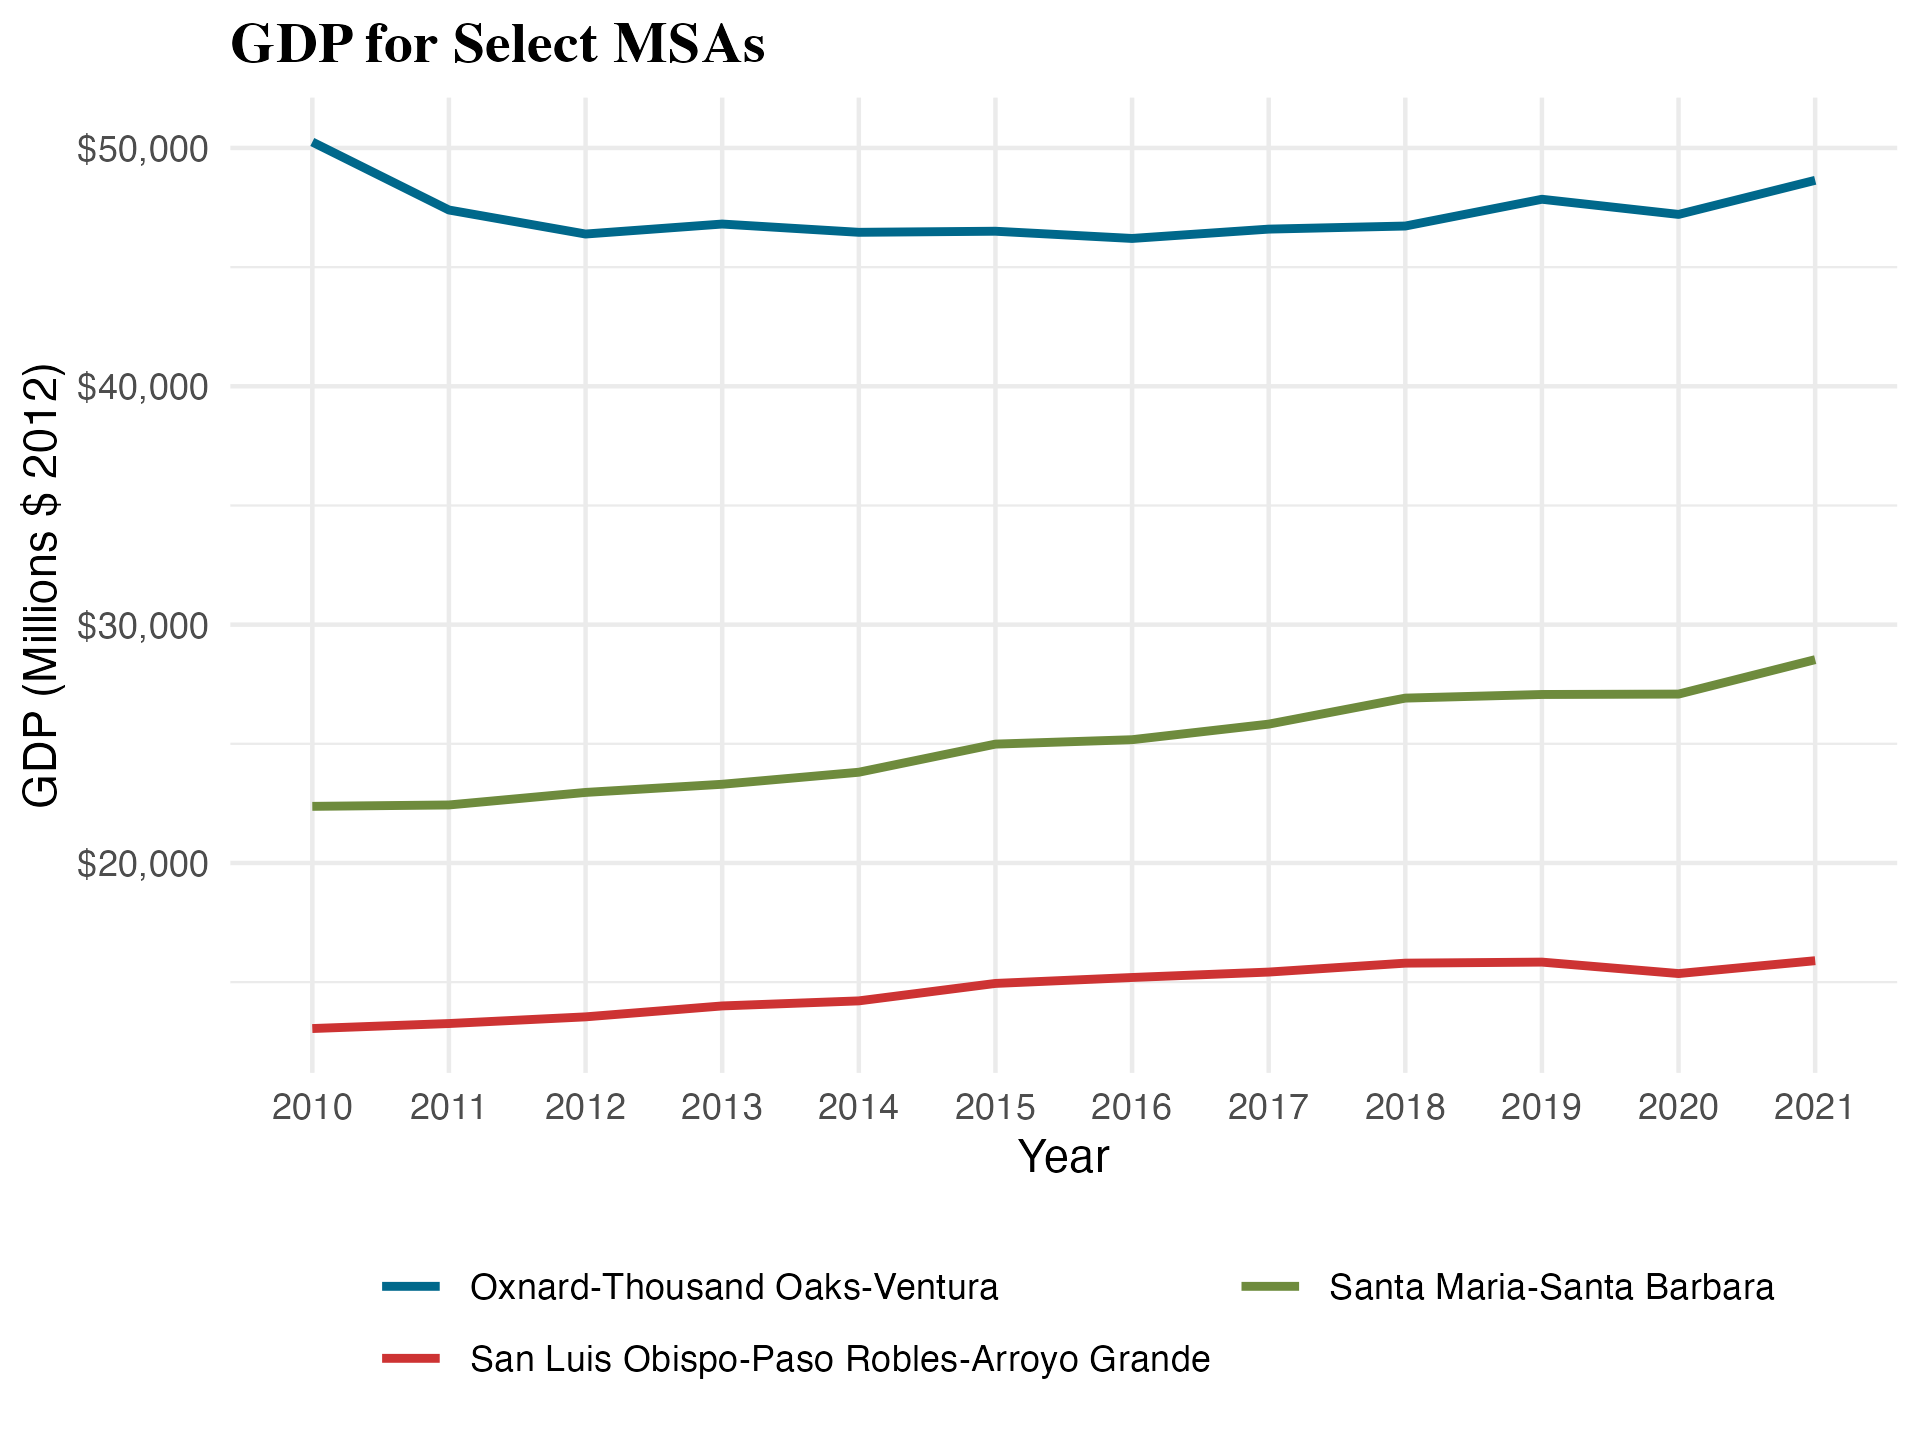
Real GDP growth in Santa Barbara County for 2021 increased by 5.3%. Over the last decade, Santa Barbara County had seen steady growth in real GDP, with an average growth of 2.25%. In 2021, Santa Barbara County saw the highest real GDP growth rate over the past ten years, while the lowest increase in real GDP occurred in 2020, with only a 0.1% rise. U.S. real GDP decreased by 2.8% in 2020, but has since increased by nearly 6% in 2021. This is above and beyond what is typical, illustrating how the economy was able to bounce back after the pandemic. Real GDP also fell in California by 2.3% in 2020, a large decrease from a 3.2% growth in 2019. As of 2021, the real GDP in the United States had risen by 5.9%, while California recorded a higher growth rate of 7.8% in its real GDP.
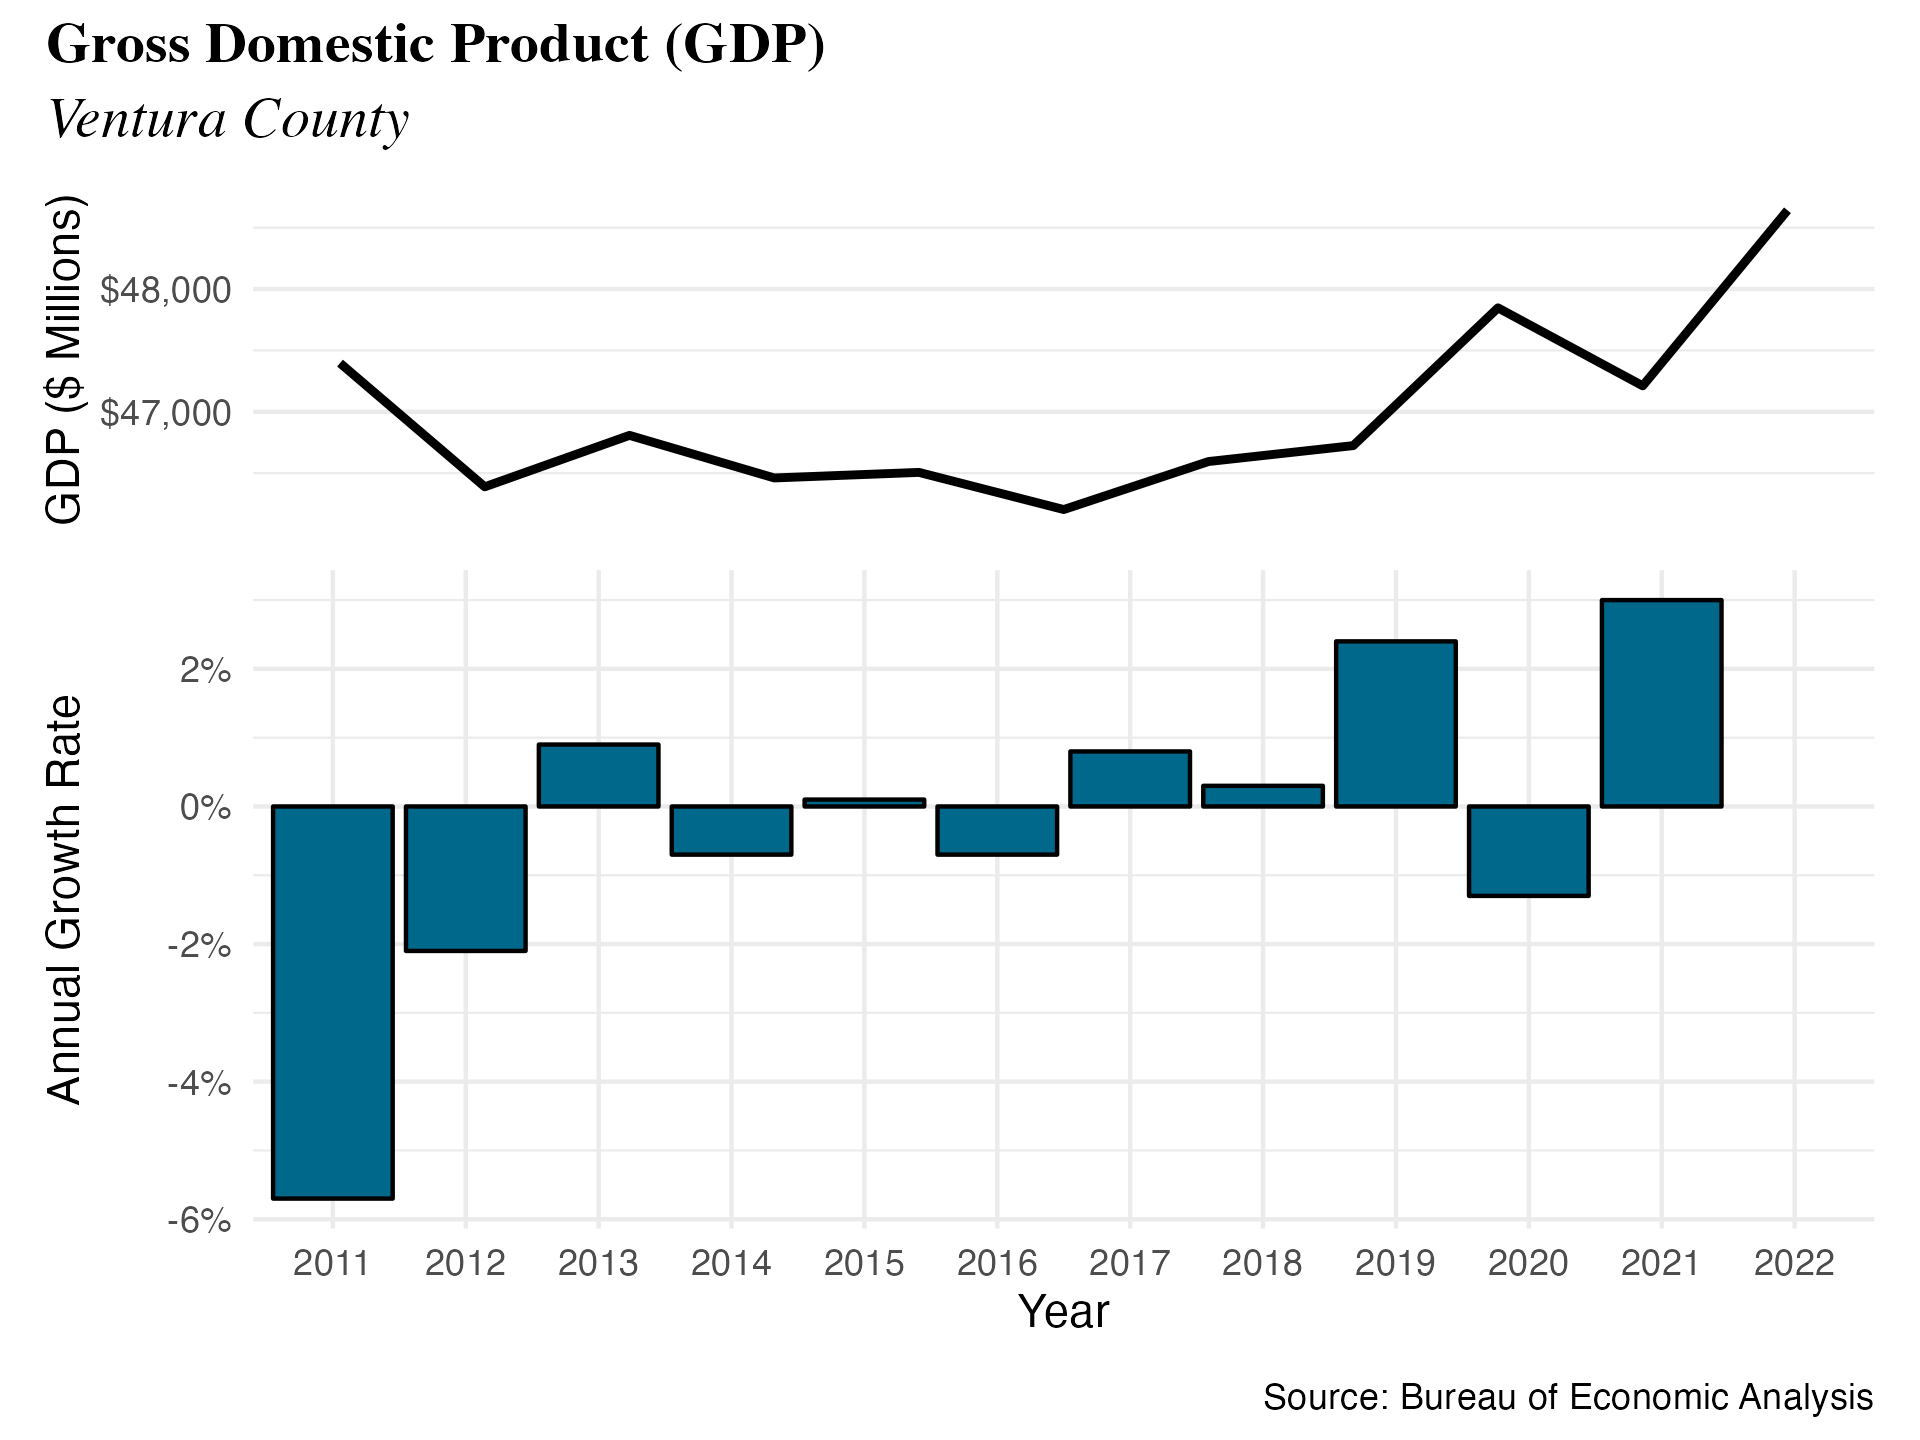
Real GDP increased by 3.5% in 2021 for San Luis Obispo County. From 2010 to 2019, San Luis Obispo has had nine consecutive years of positive real GDP growth rates. However, the year 2020 marked a break in this trend with a negative growth rate of -3.0%. In 2015, San Luis Obispo recorded its highest growth rate of the past decade, with a 5.1% increase. Real GDP for Ventura County increased by 3.0% in 2021. Similarly, Ventura County experienced a 2.6% decrease in real GDP in 2020. This was the first decrease for Ventura County since 2016, when real GDP decreased by 0.7%.

Industry Growth
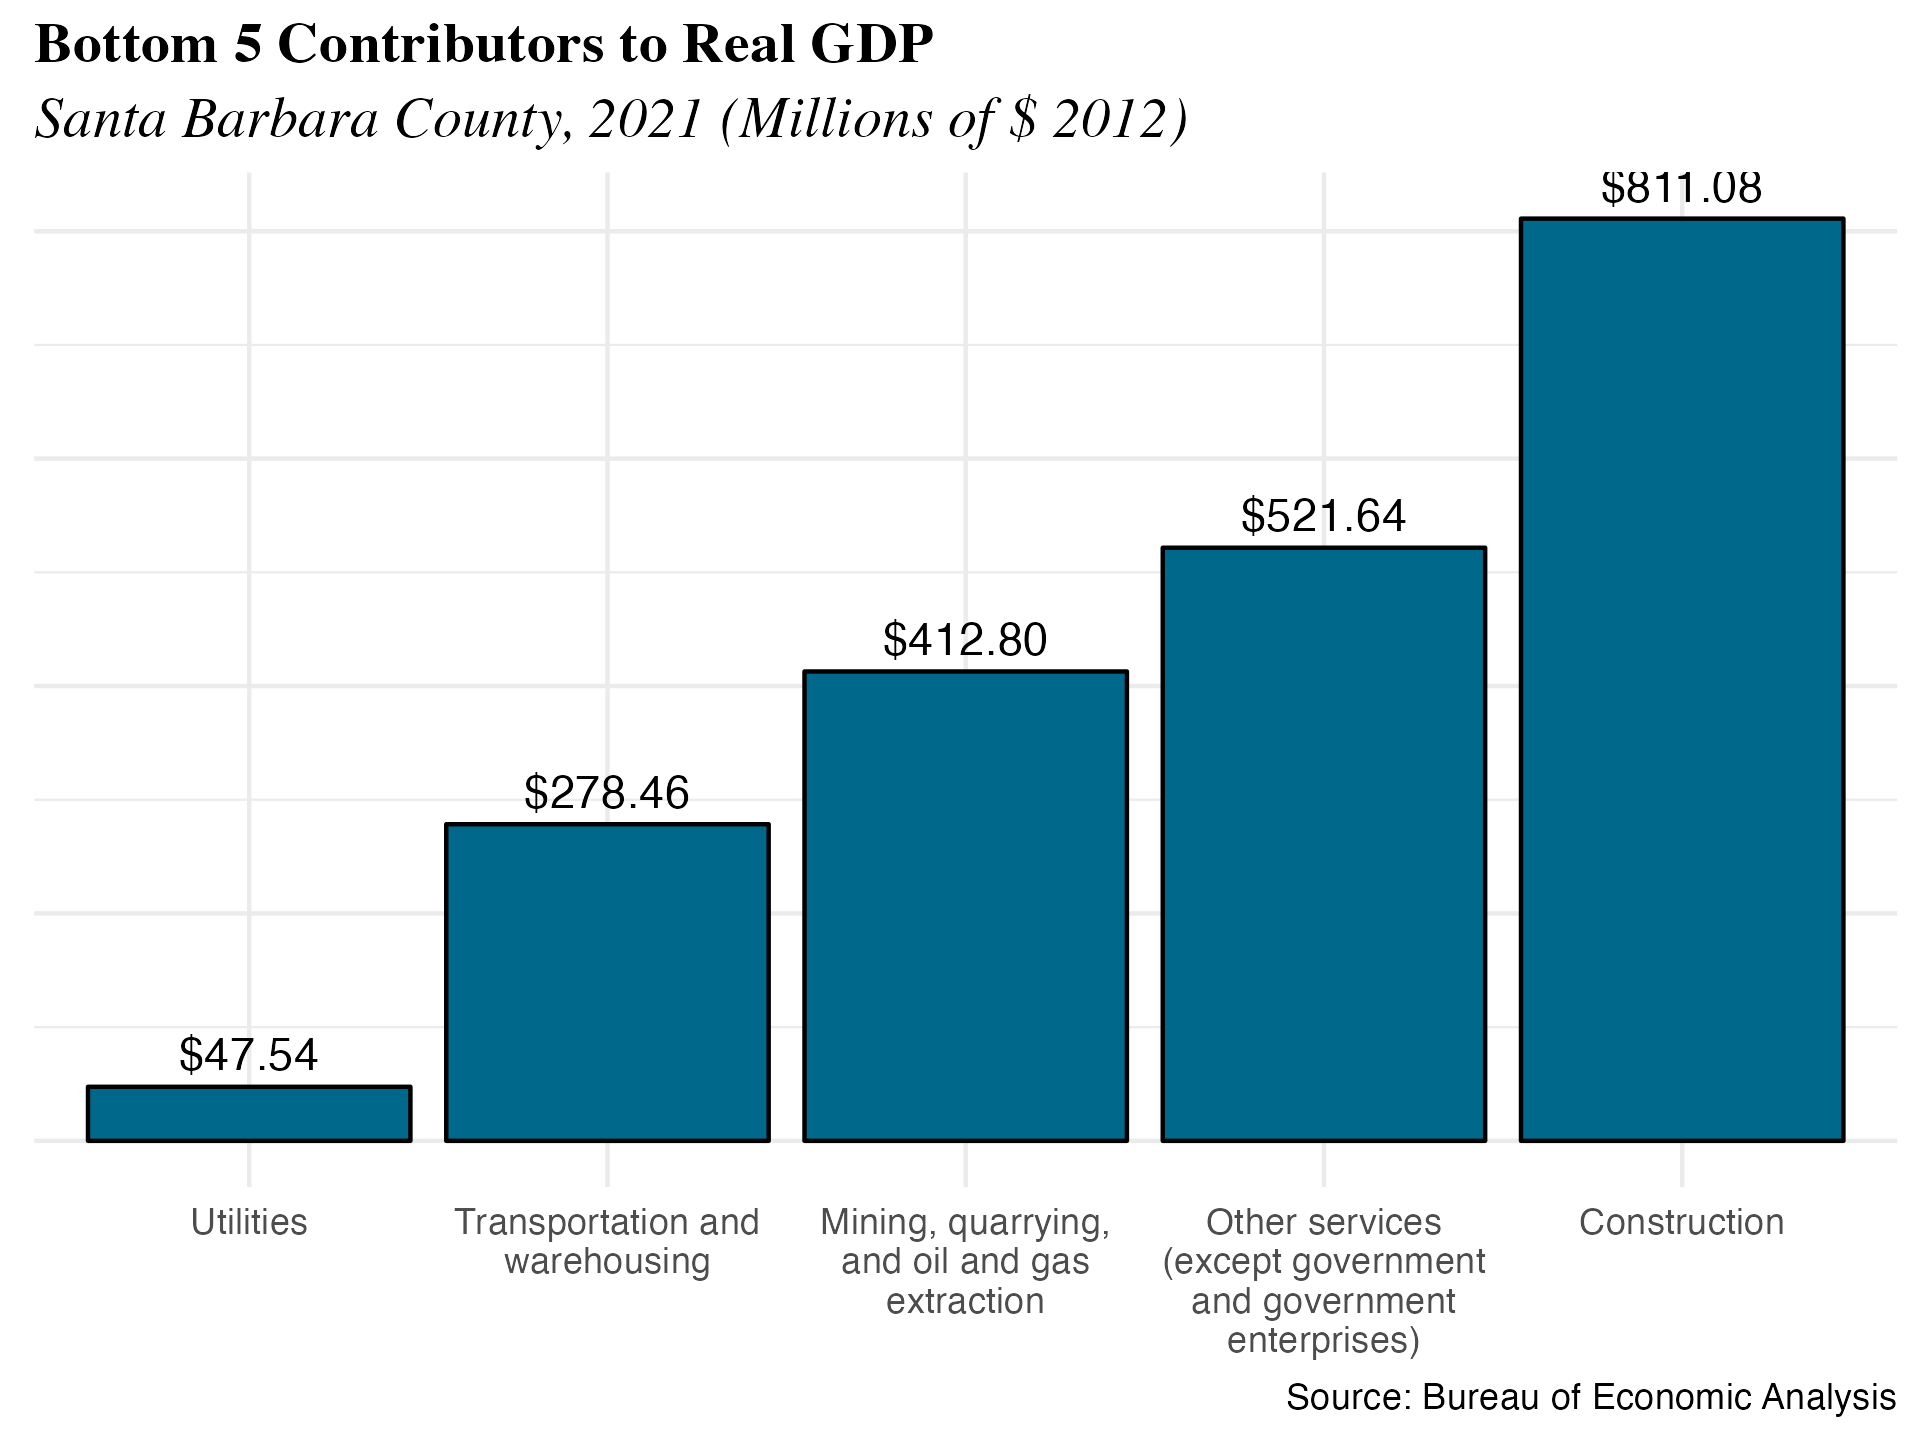
In Santa Barbara County, the largest five industries in 2021 were Finance, Professional & Business Services, Government, Manufacturing, and Educational Services in that order. All of these industries were also part of the five largest industries in 2020, with Finance still leading. Professional & Business Services was the second largest industry in 2020 and Government followed in third.
The fastest growing industry in 2021 was Arts, which experienced GDP growth of 32.8% from 2020. The second-fastest growing industry in Santa Barbara County was Professional & Business Services, with GDP growth of 16.5%. Other Services had the third largest growth rate in 2021 at 15.1%, and Transportation had the fifth largest growth rate at 10.5%.
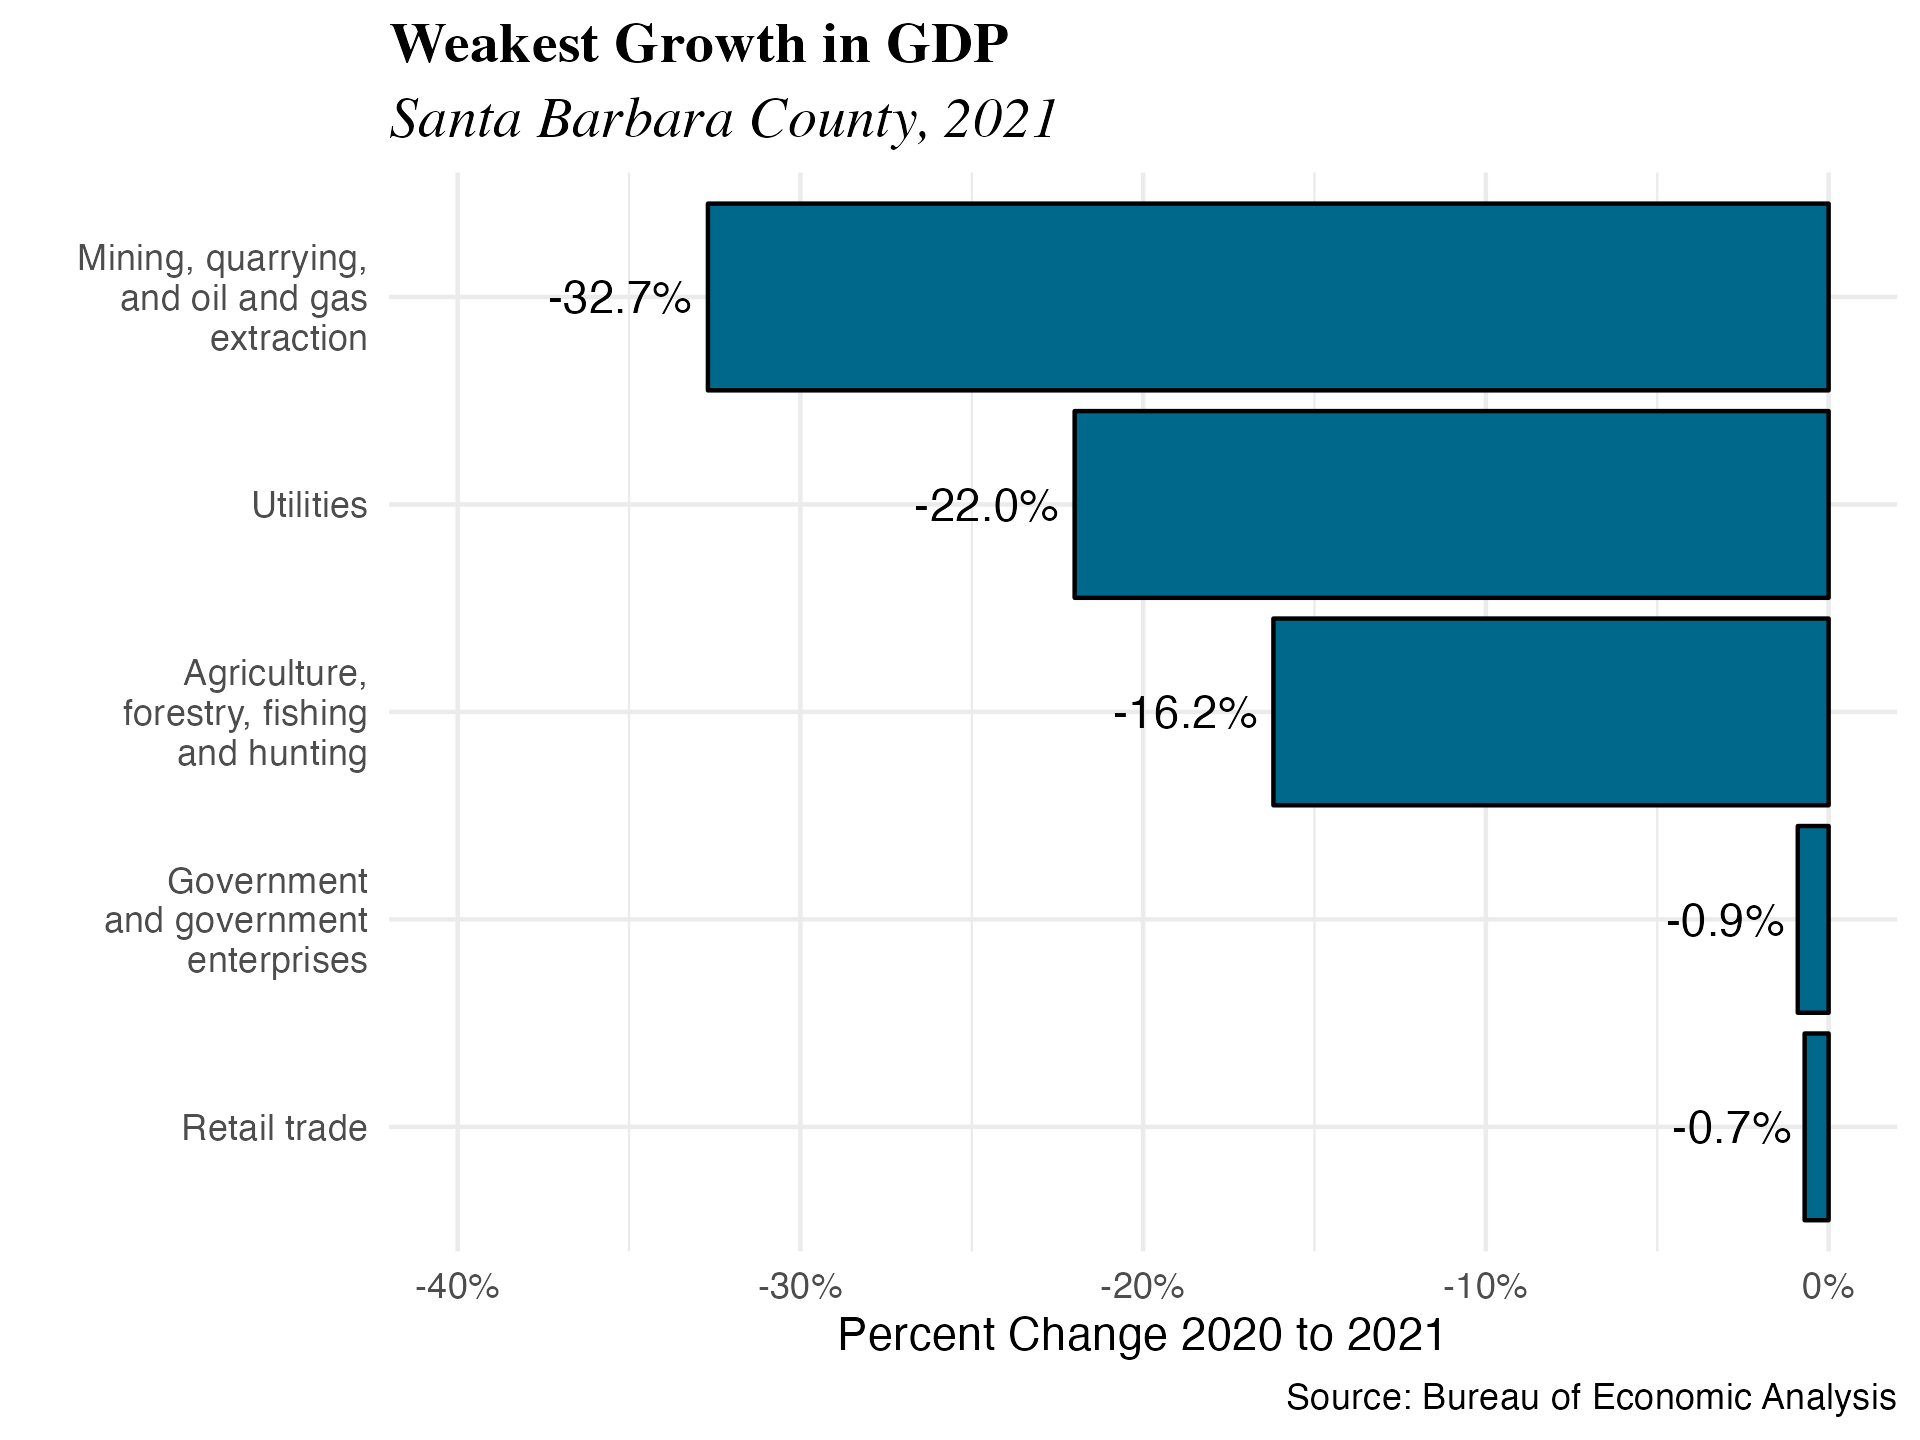
The five industries with the weakest growth in 2021 were Mining (-32.7%), Utilities (-22%), Agriculture (-16.2%), Government (-0.9%), and Retail Trade (-0.7%). It is interesting to note that the Arts, Other Services and Transportation industries, which were three of the industries with the weakest growth in 2020, turned out to be three of the strongest performers in 2021.
Per Capita GDP
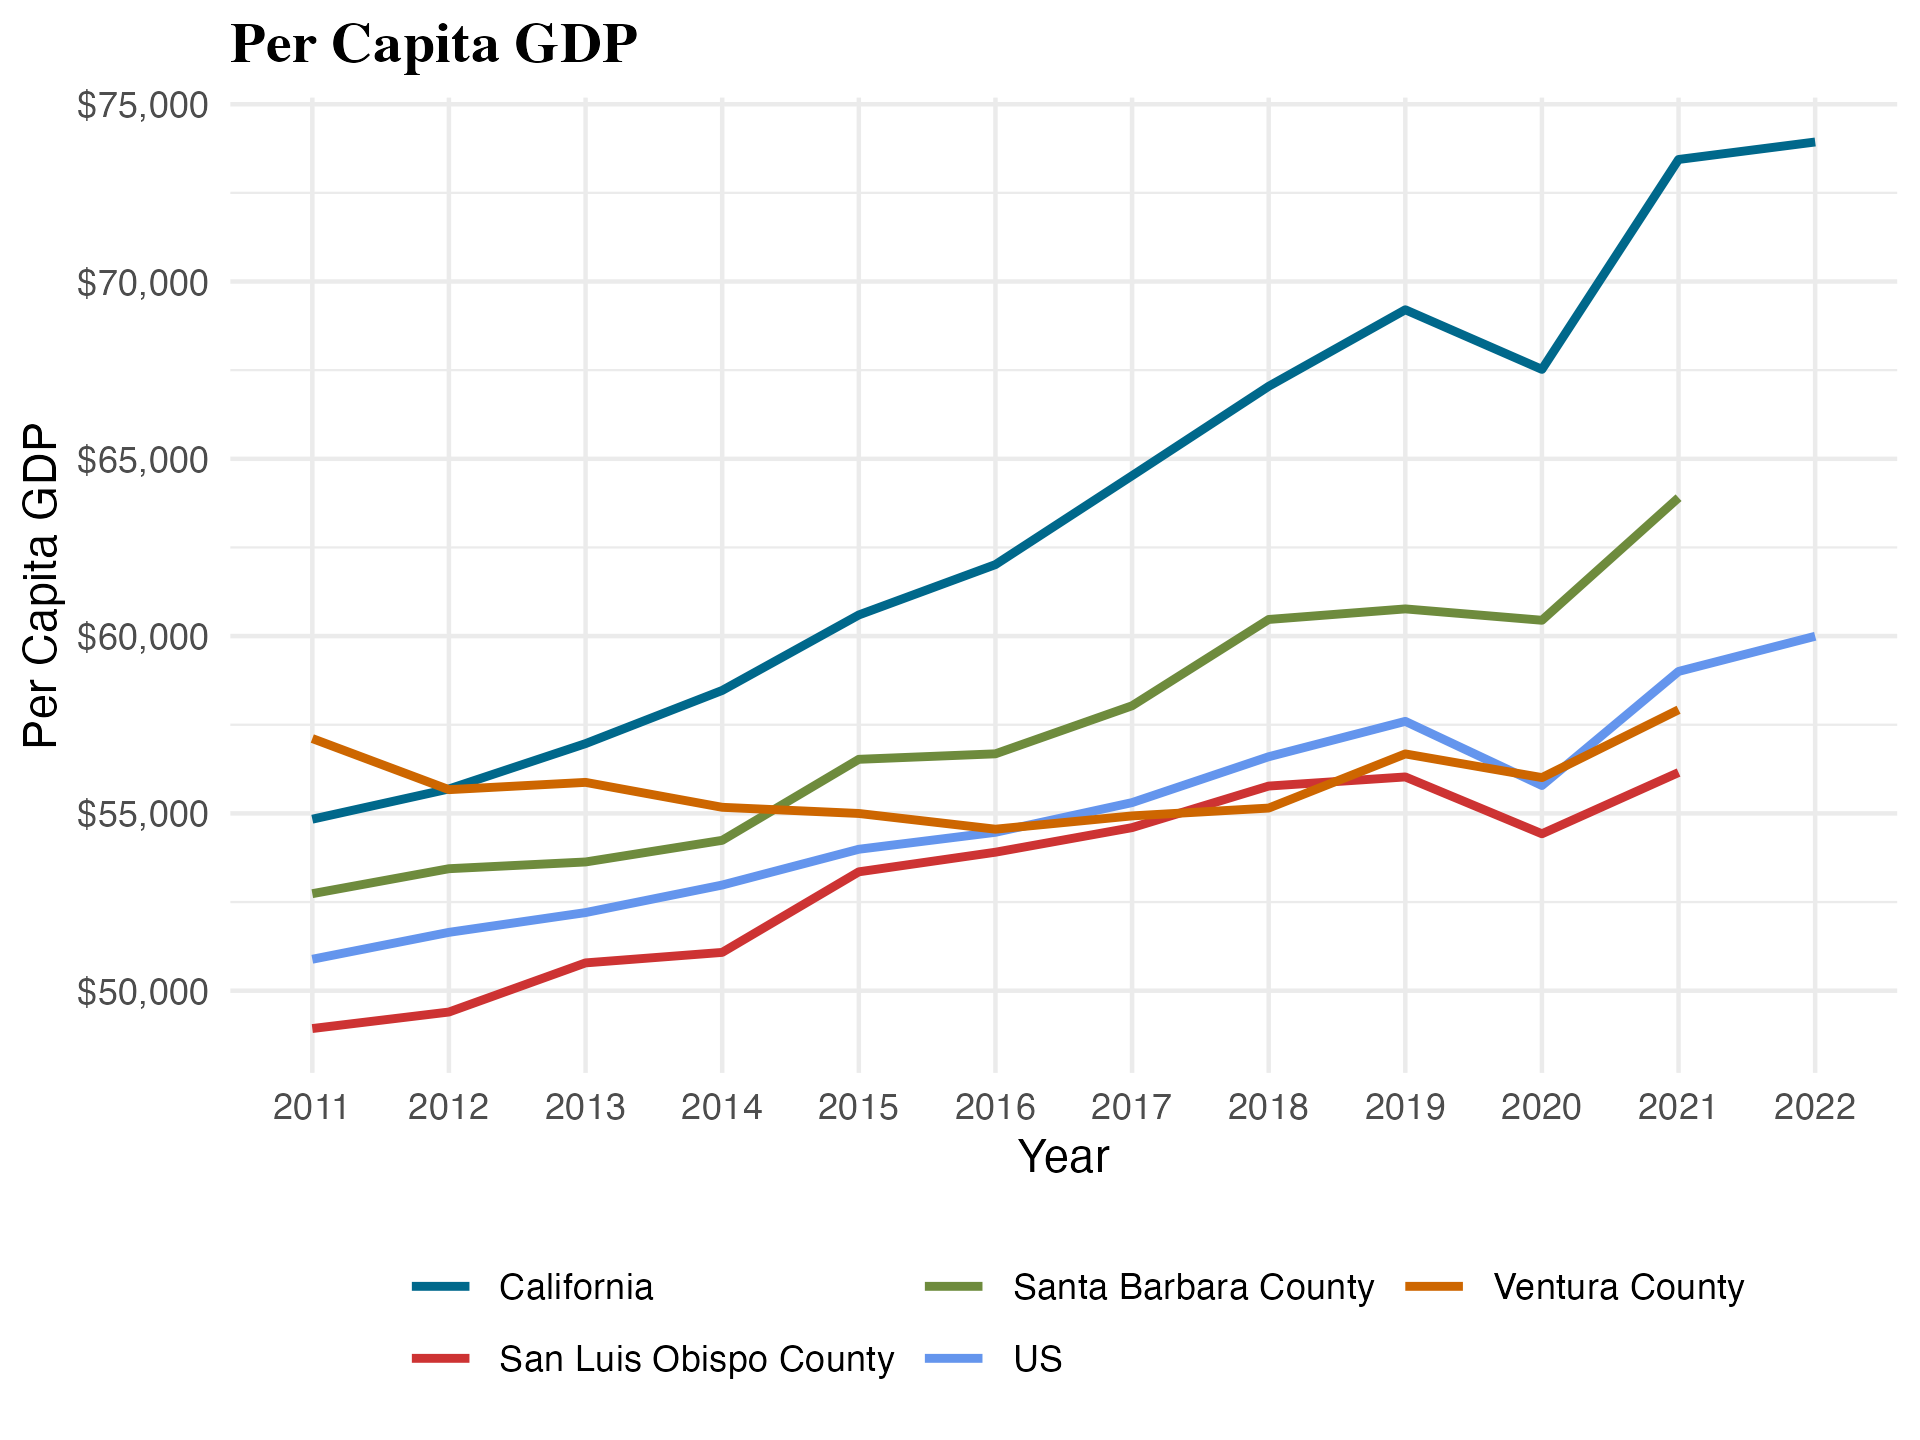
Real GDP per capita for Santa Barbara County in 2021 was $63,903, reflecting an increase of 5.72% compared to the previous year. This was higher than San Luis Obispo County ($56,152) and Ventura County ($57,922). Santa Barbara County’s real GDP per capita was higher than that of the United States’ value of $59,003, but it was lower than California’s real GDP per capita of $73,442. Due to the pandemic, there was a general decline in real GDP per capita in the year 2020, as evidenced by the data. However, the economy has shown signs of recovery in 2021, as we observe an increase in real GDP per capita.
2.2 Prices
Key Points:
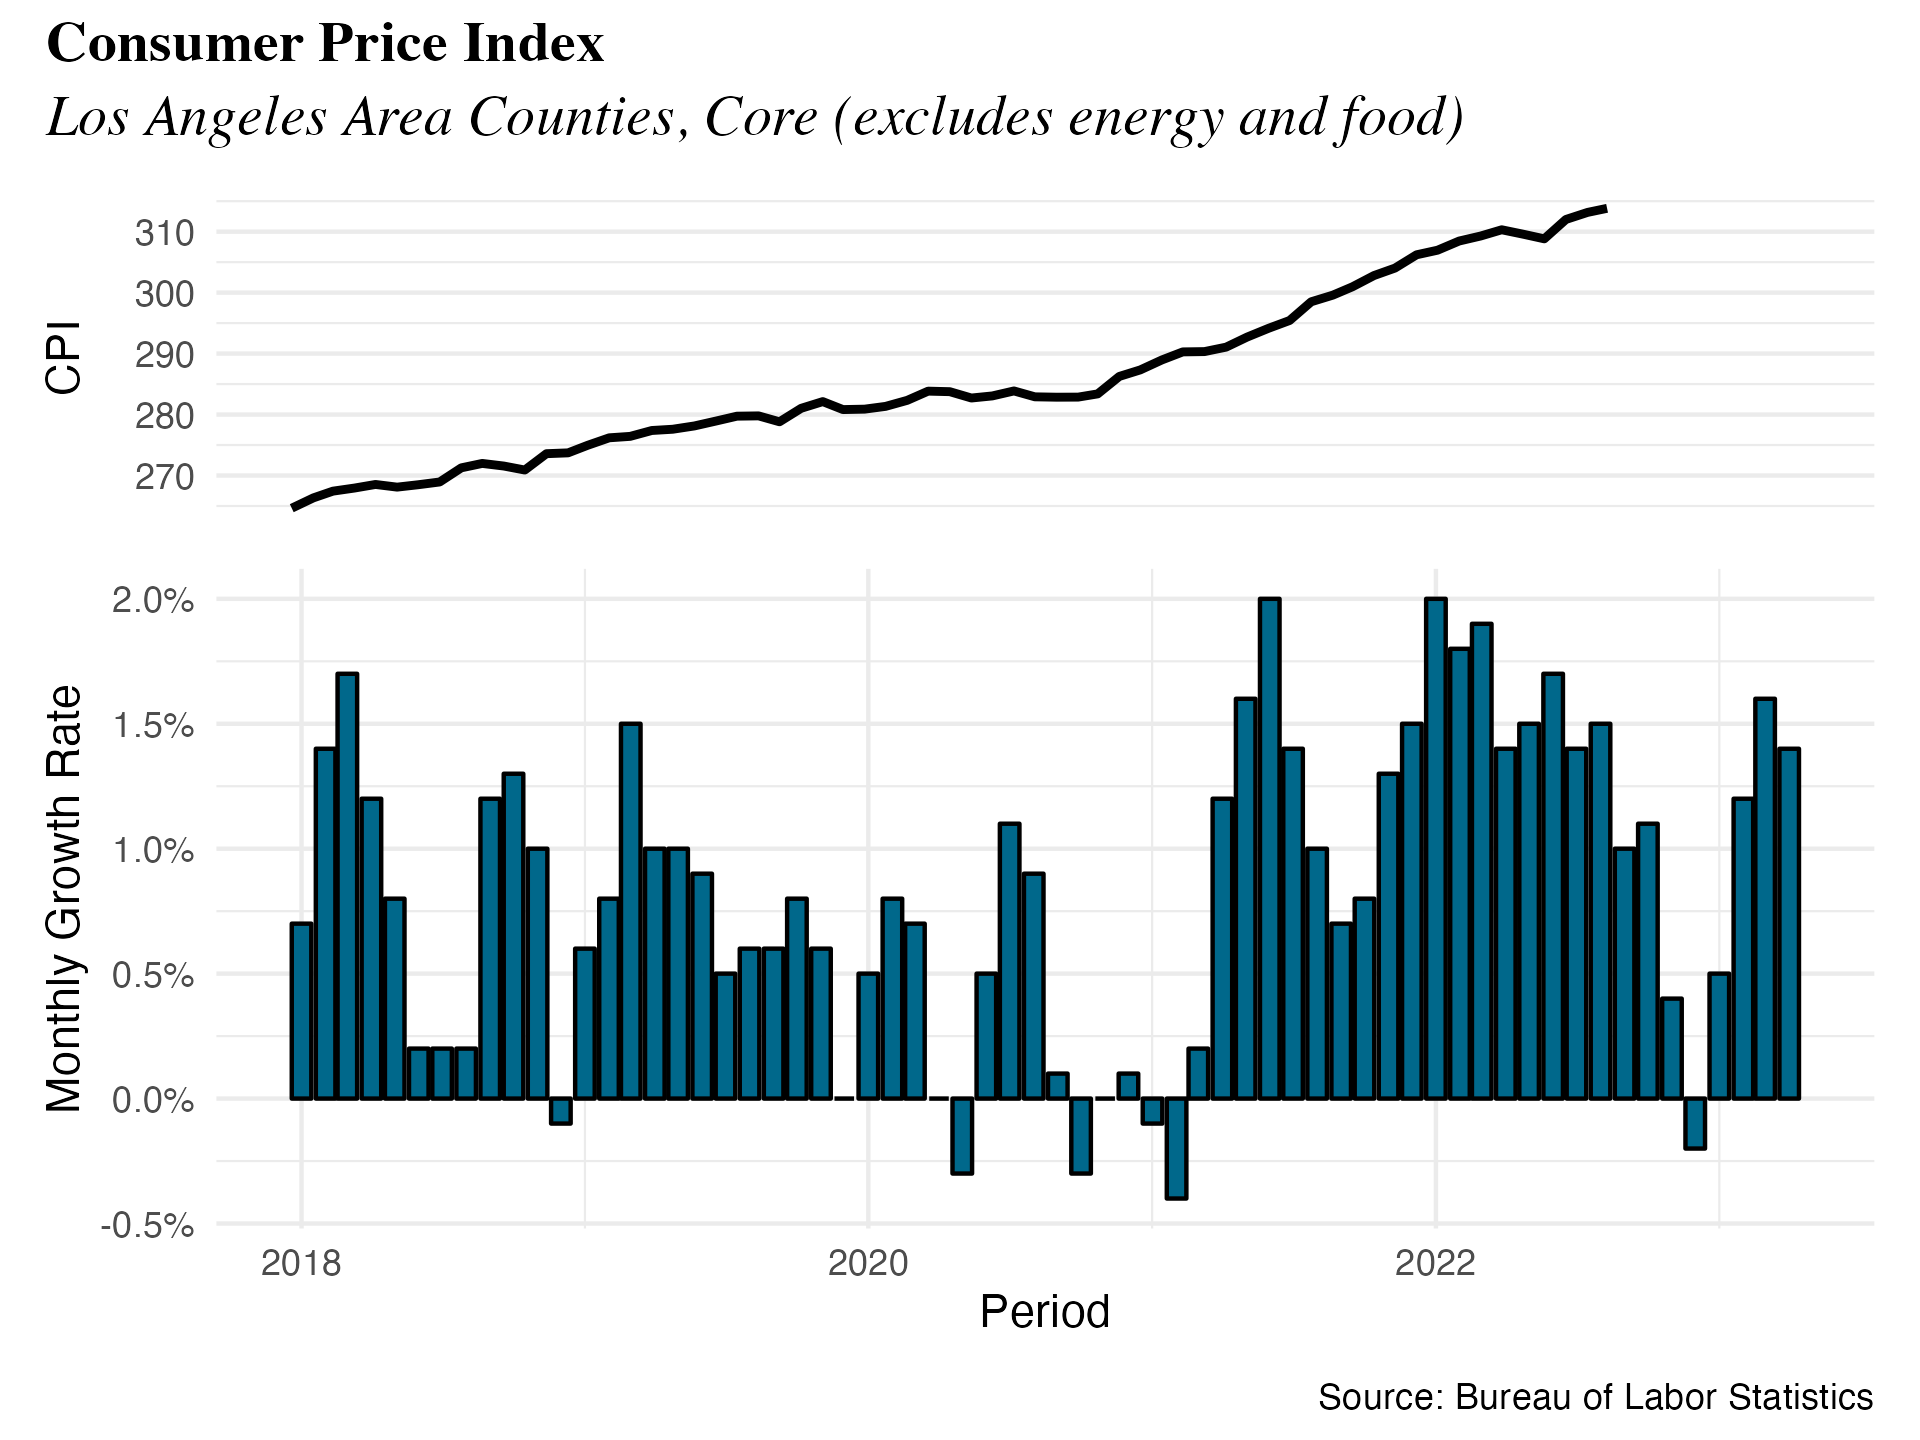
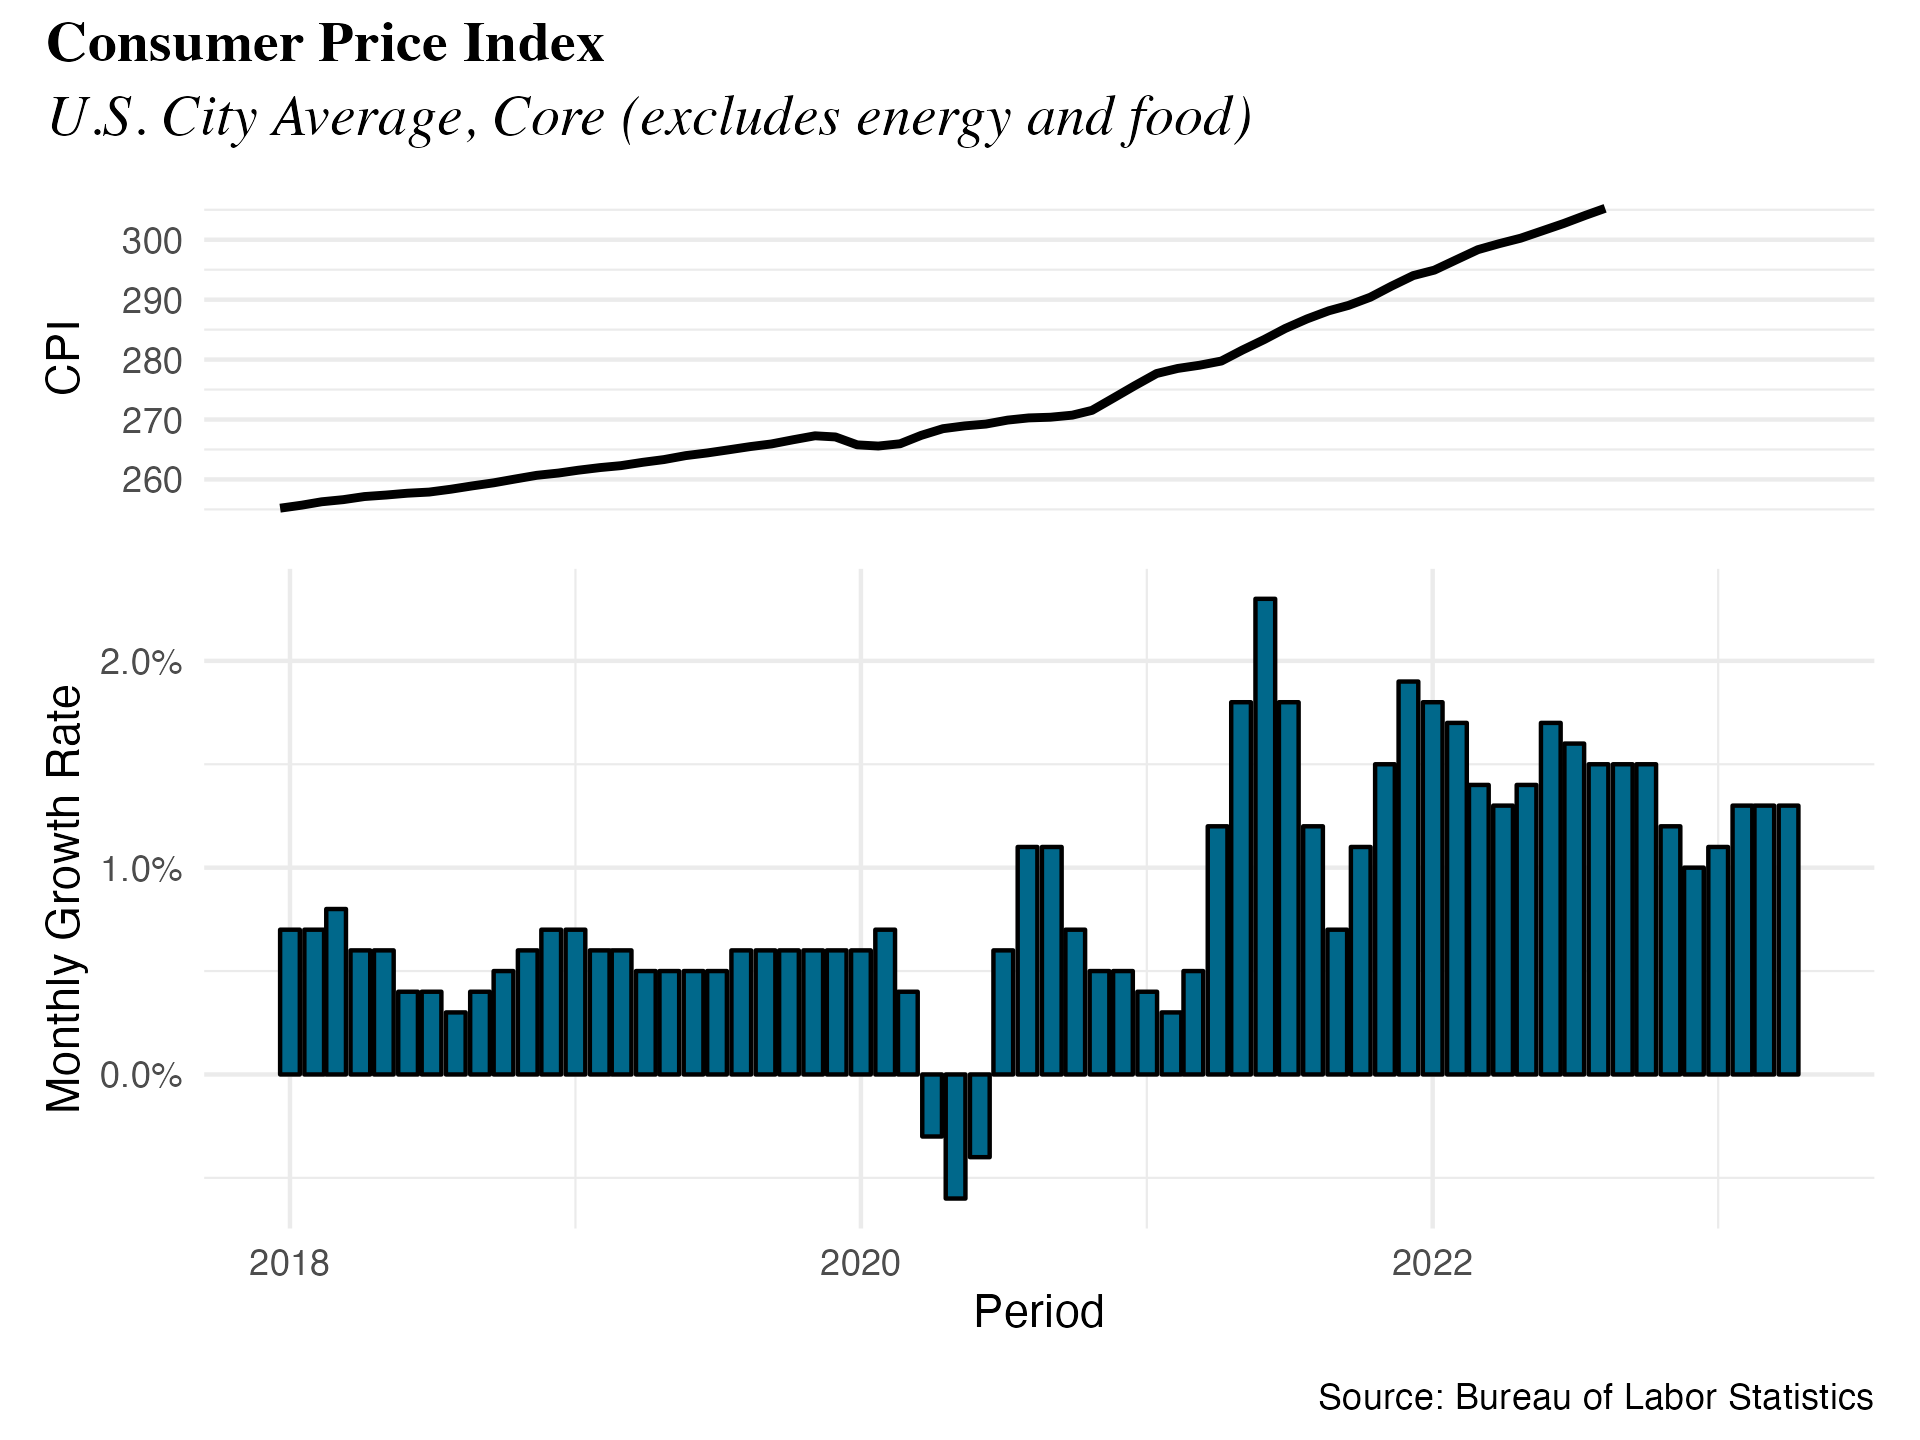
- Core inflation, which removes the effects of energy and food prices, increased by 4.6% from January 2021 to January 2022 in the United States, and increased by 4.9% in the Los Angeles Area.
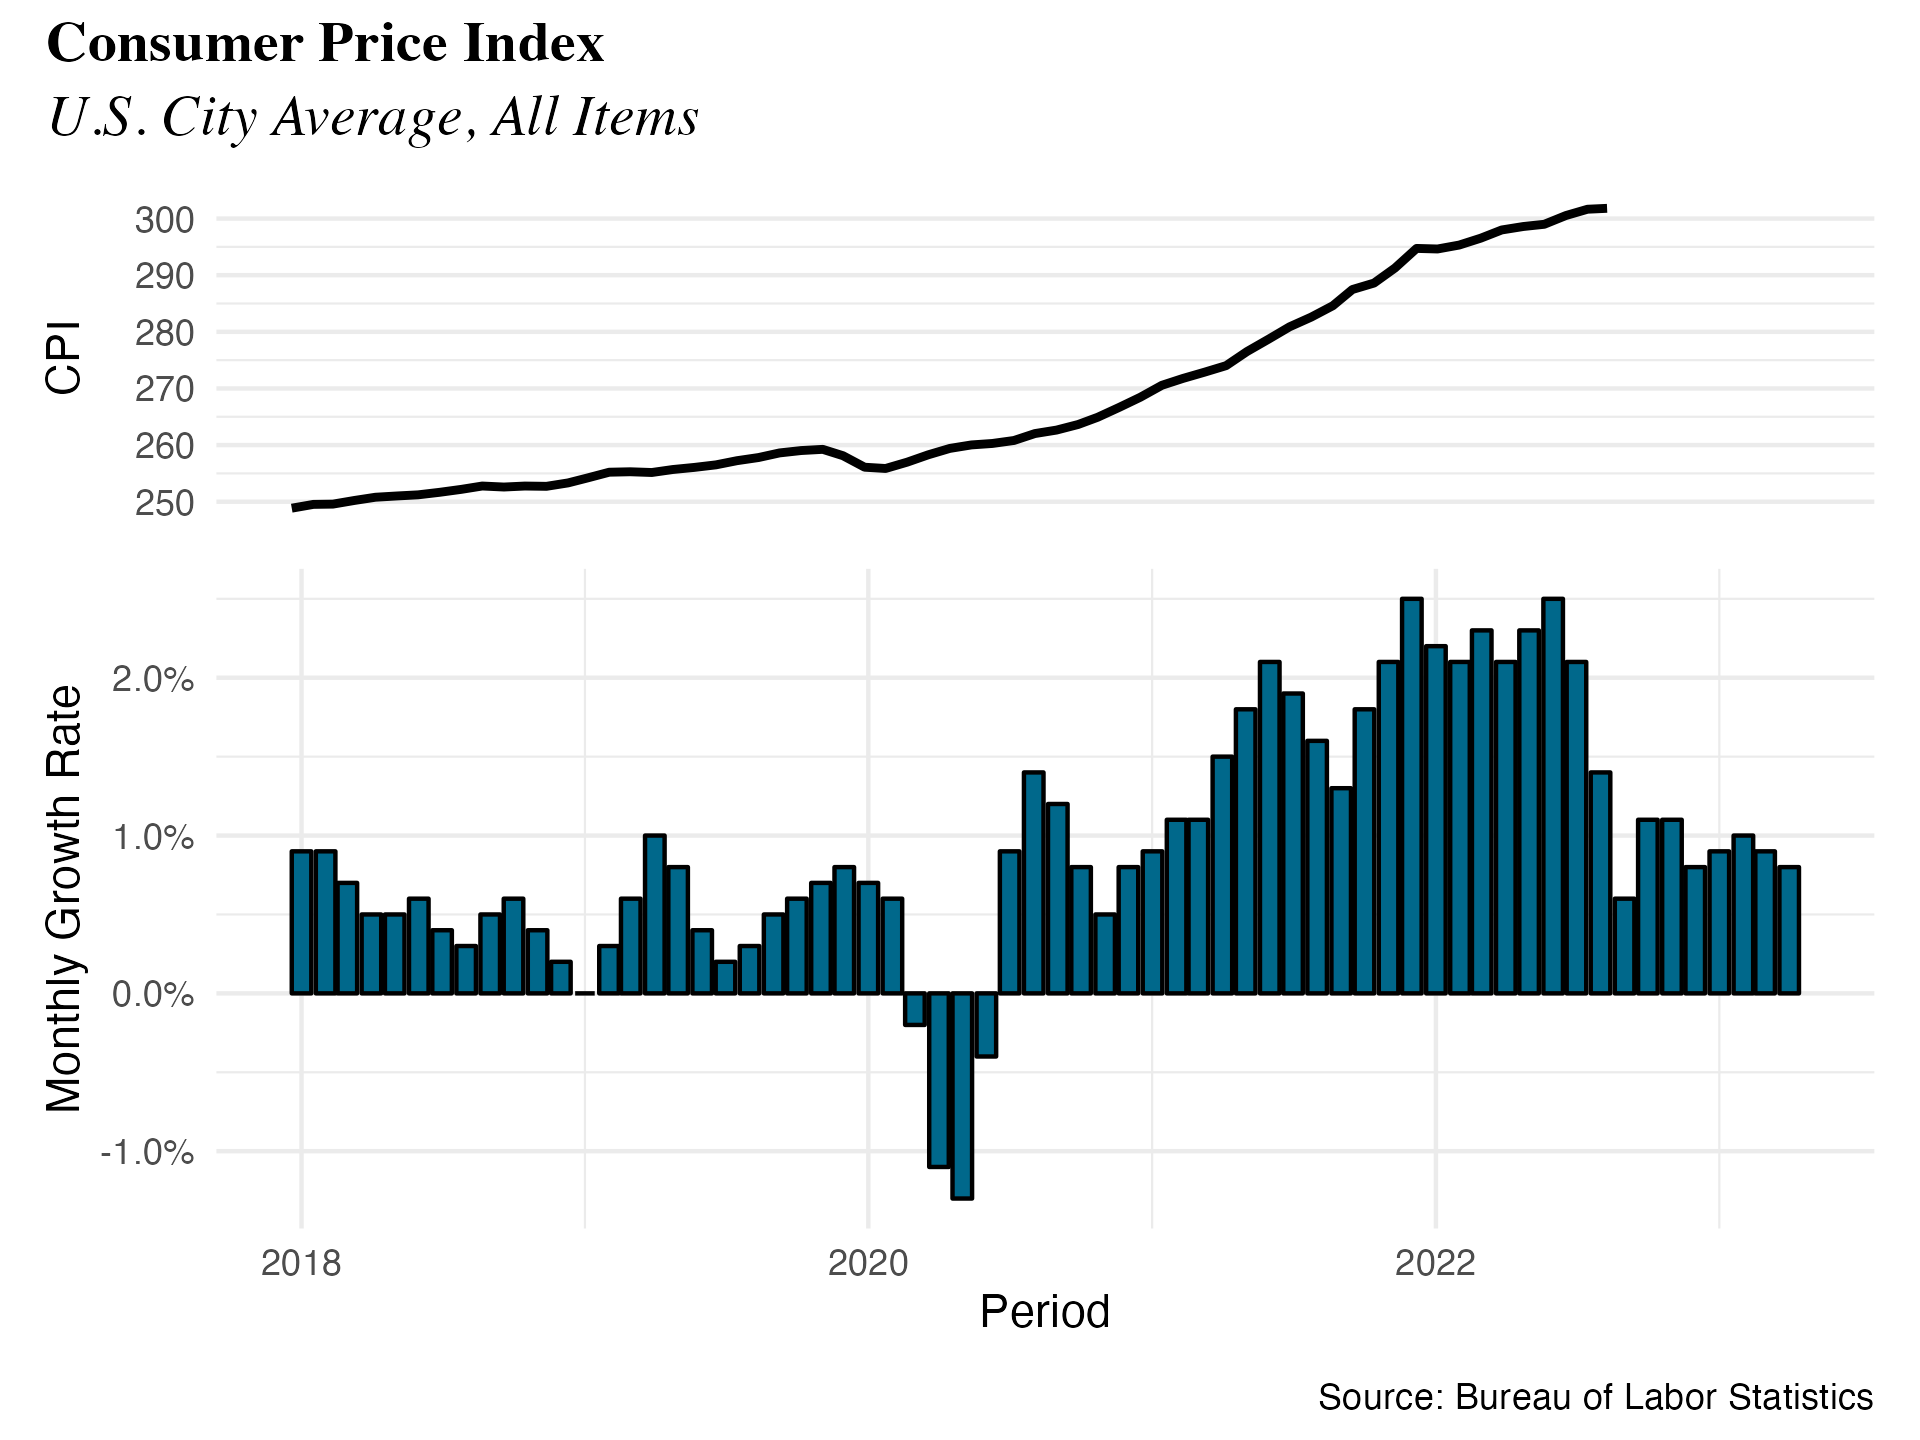
- The Federal Reserve’s long-term inflation target of 2% was significantly exceeded in 2022, with the core CPI for the U.S. reaching 6.2%.
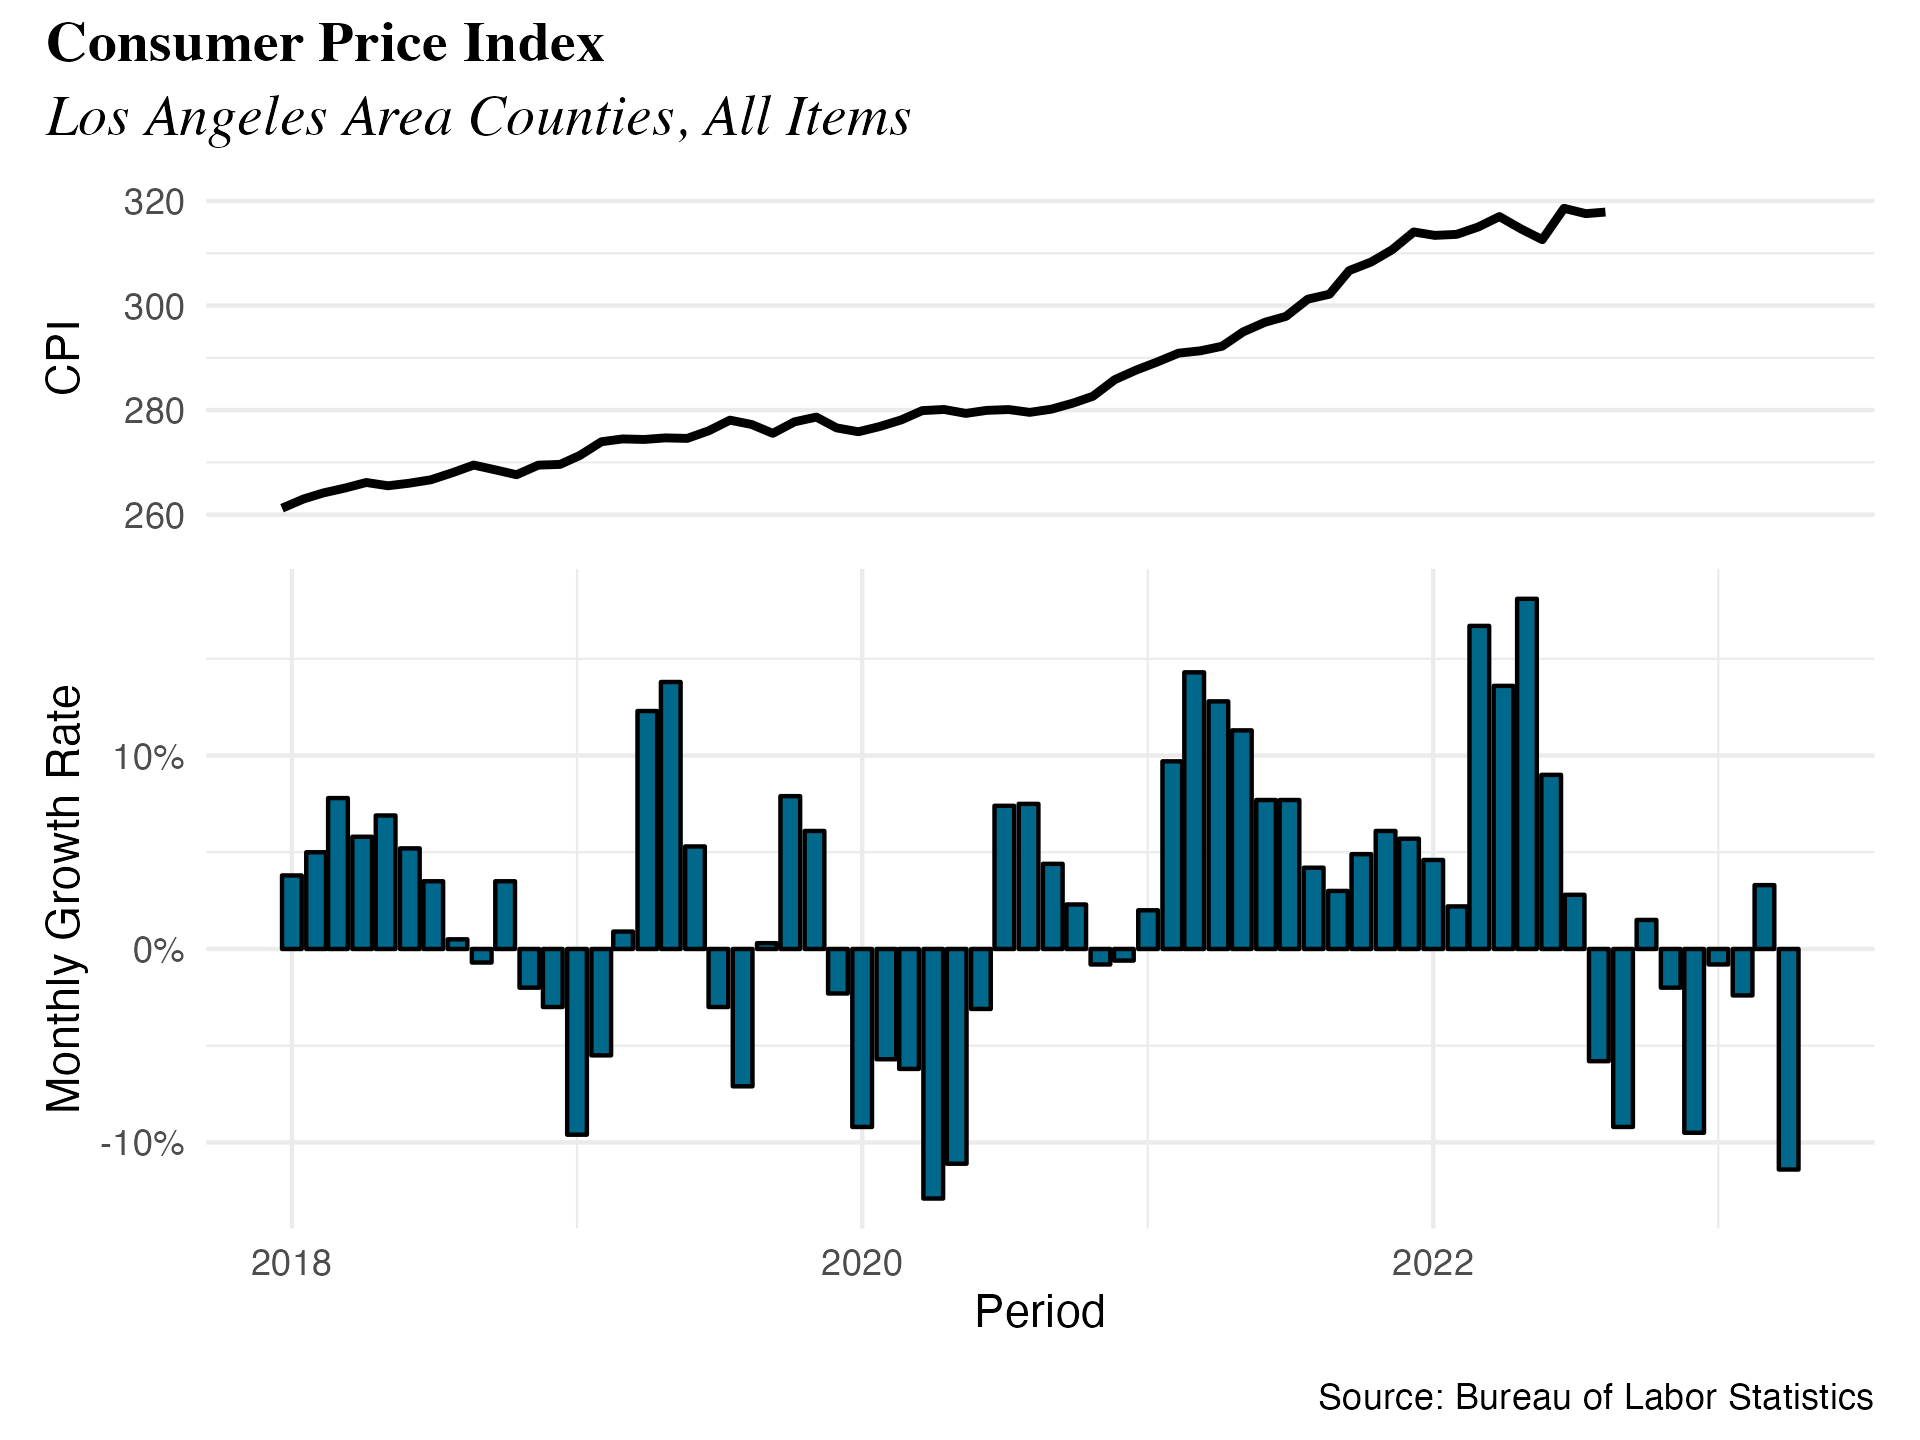
The main measure of inflation is the Consumer Price Index (CPI). This index is calculated by taking the change in prices paid by urban consumers for a fixed basket of goods and services, which is representative of what a typical consumer purchases. In 2022, the CPI for the Los Angeles Area increased by 7.51%. The overall U.S. inflation in 2022 increased by the same percentage, at 7.60%.
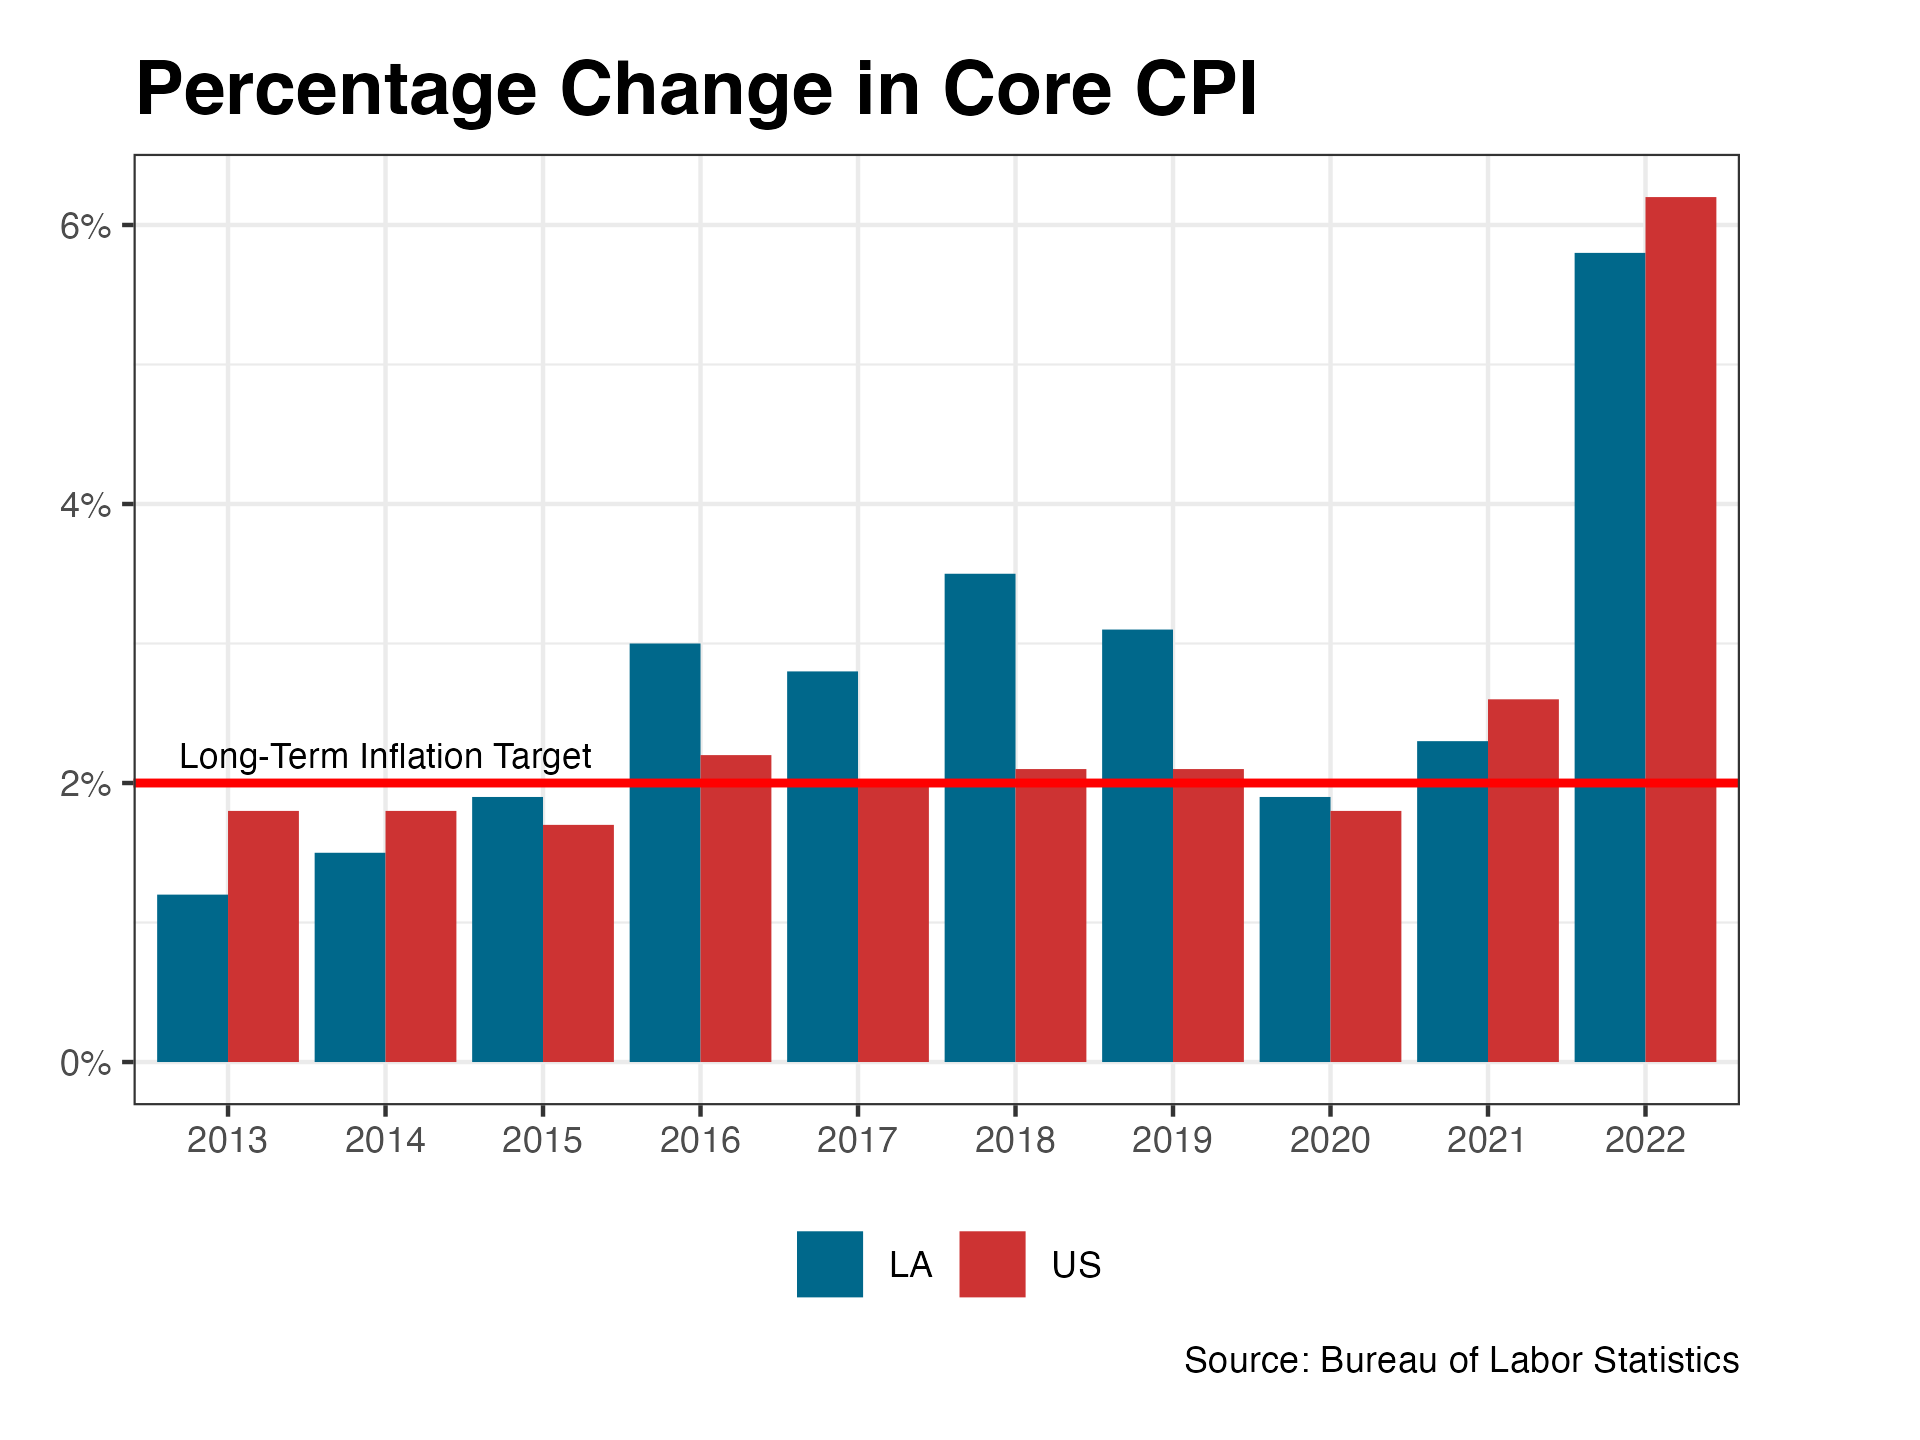
Core CPI is often thought of as the best measure of inflation. It resolves issues and concerns regarding volatility by removing food and energy from the basket of goods and services. By this measure, inflation was 5.8% in the Los Angeles area for 2022. Los Angeles consistently had a higher core CPI than the US from 2015 to 2020, but the trend did not persist in 2021-2022. The core CPI value for the U.S. was 0.4% higher than the value for Los Angeles in 2022. The FED hit their long-term inflation target of 2.0% for the first time in 2016 since 2008. The inflation rate increased drastically in 2022 for Los Angeles, hitting high above the FED’s target. It rose from 2.3% in 2021 to 5.8% in 2022. The FED was highly above their 2.0% benchmark in 2022 with the core CPI for the U.S. being 6.2%.
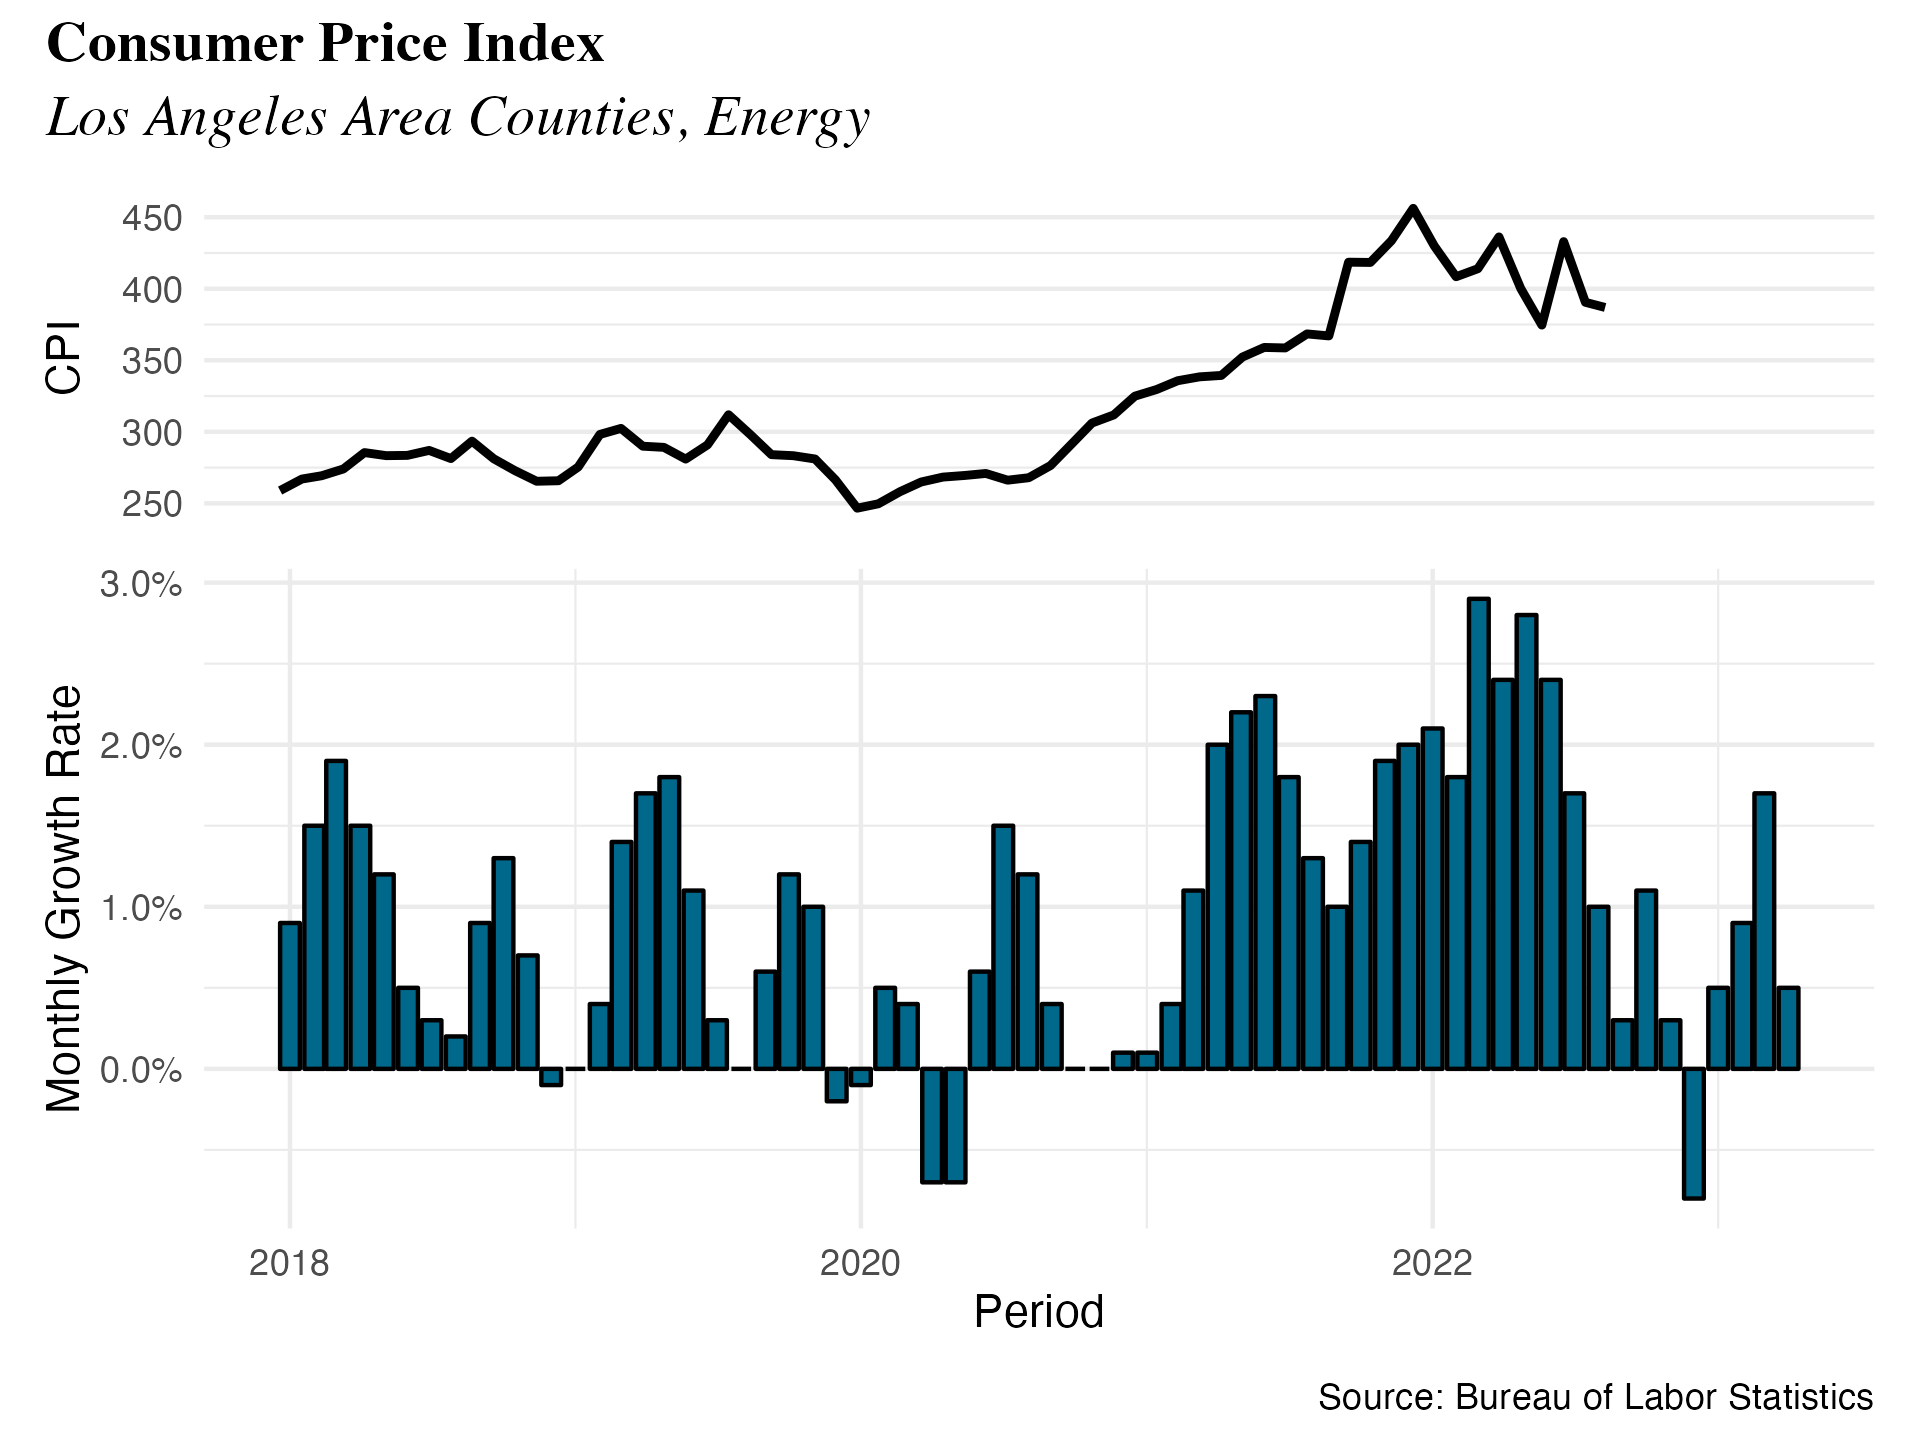
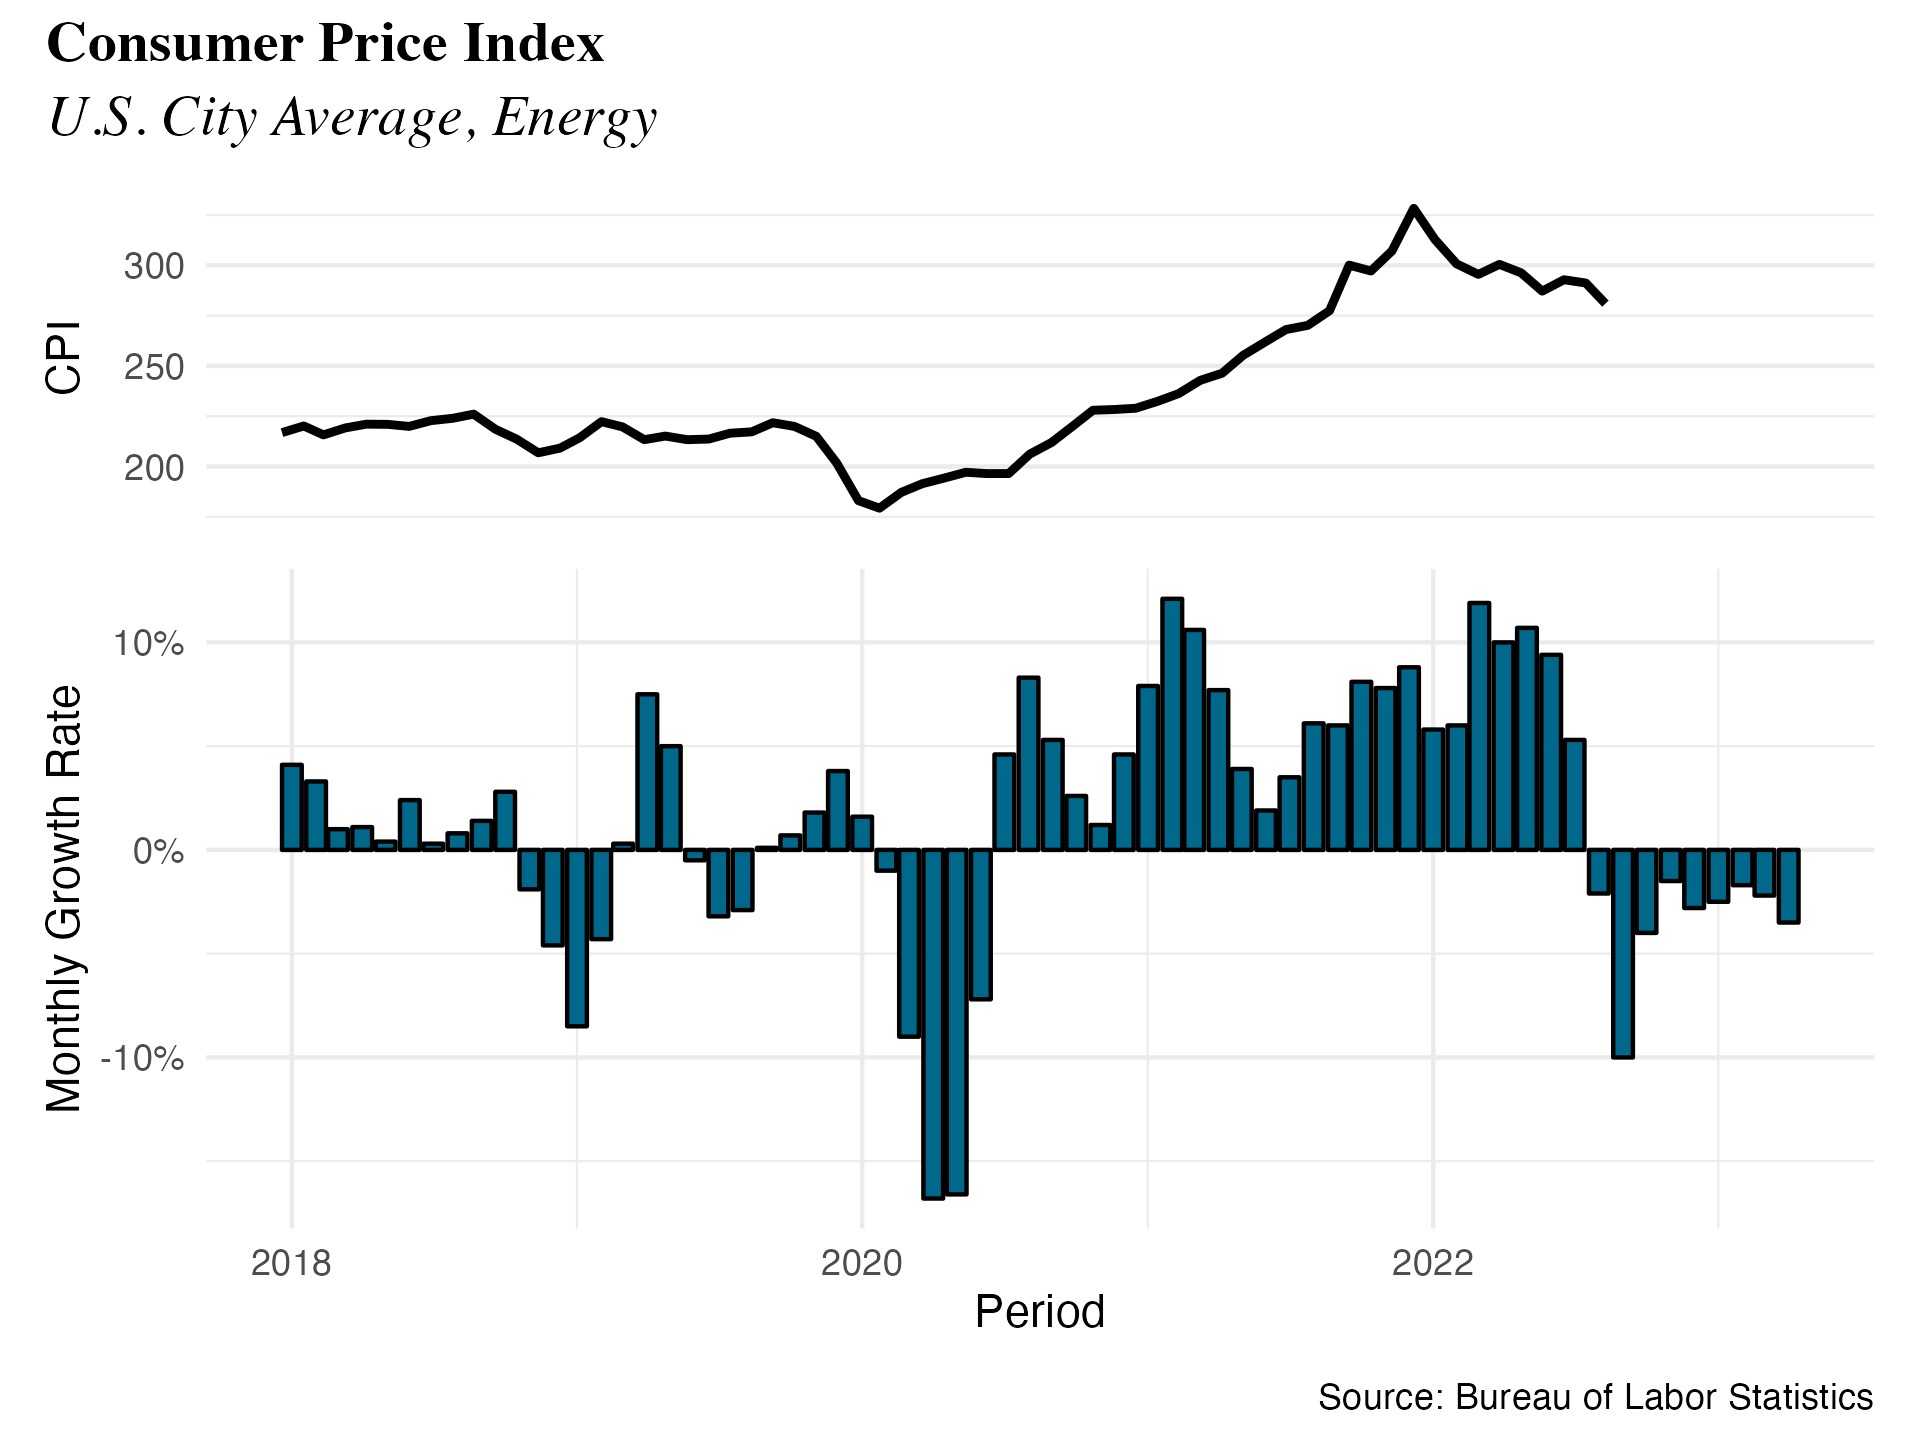
In the Los Angeles Area, the quarterly percentage change for the CPI for energy experienced a decline of 9.52% at the end of 2022, while the corresponding change for the entire United States was a decline of 2.82%.