6 Community
6.1 Demographics
Key Points:
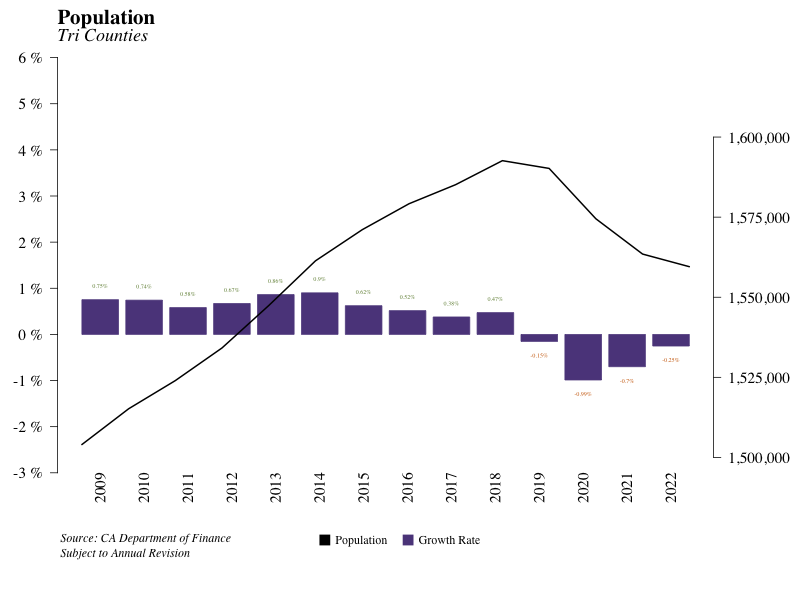
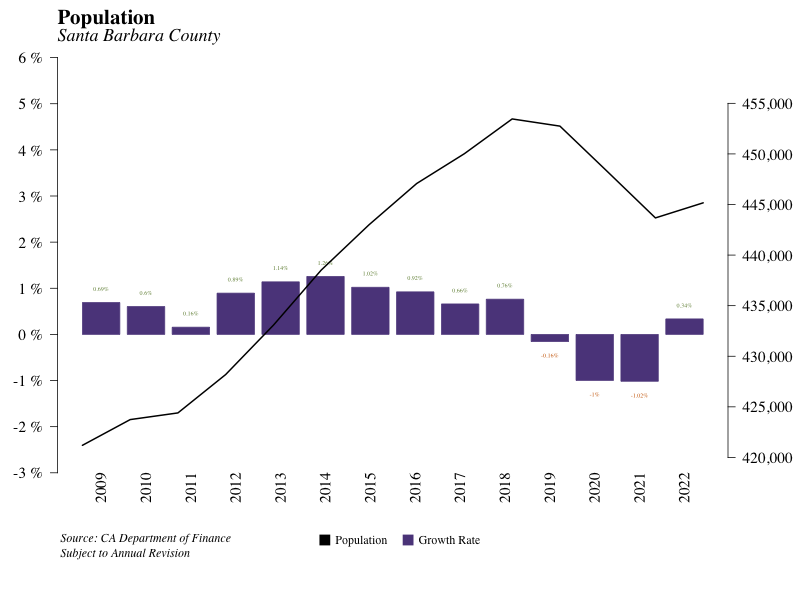
- Santa Barbara County’s population began to grow this year, reversing a three-year trend of population decline. However, the tri-county area as a whole is experiencing its fourth straight year of population decline.
- Net migration to Santa Barbara County has been steadily decreasing since 2016, with the largest decrease in the recorded data occurring in 2021.
- Santa Barbara’s white population is declining, while populations of other ethnicities are increasing.
6.1.1 Local Demographics
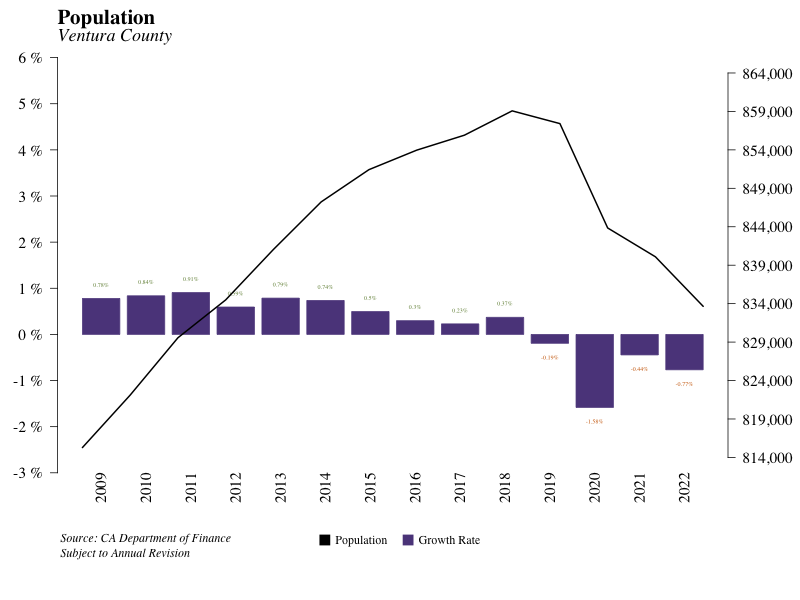
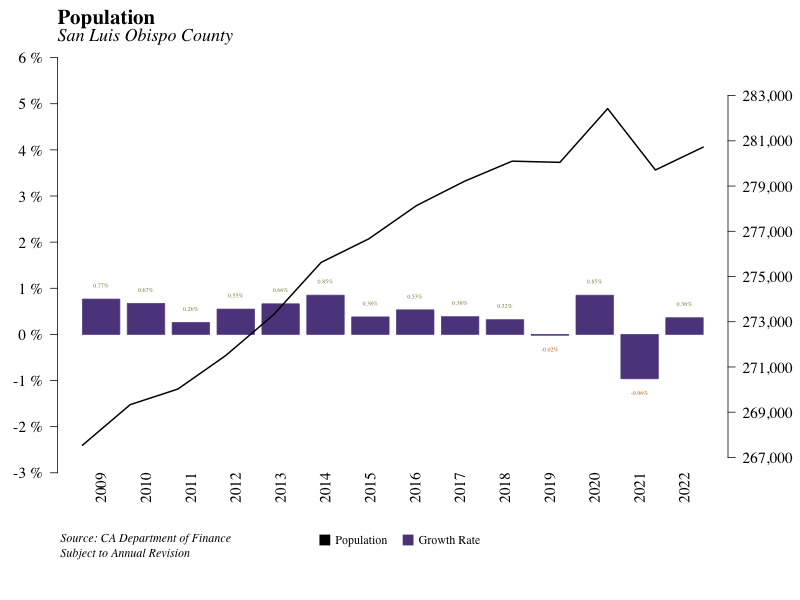
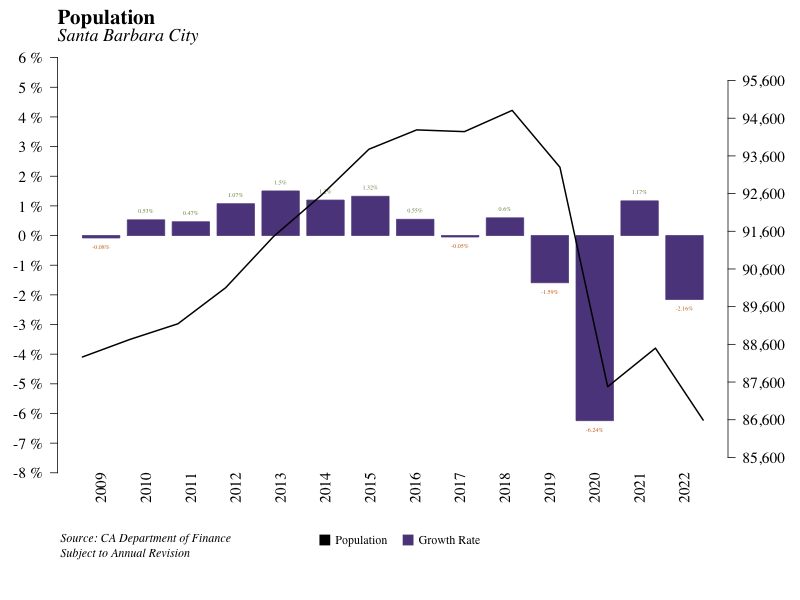
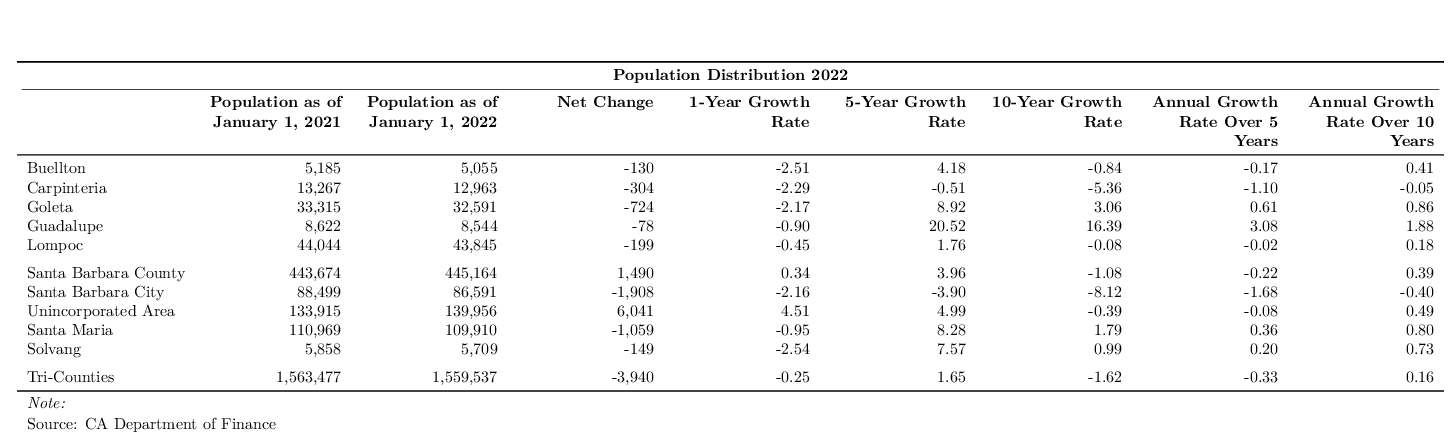
The tri-counties area is composed of Santa Barbara County, Ventura County, and San Luis Obispo Counties. In 2023, population growth is negative at -0.25%. Population growth for the tri-counties has not not returned to its peak in the recorded data of about 0.9% in 2013 and 2014. Santa Barbara County recorded positive population growth of 0.34%. Population growth in San Luis Obispo County was positive at 0.36%. Ventura County experienced negative population growth of -0.77%. The overall decline in the tri-counties population was therefore driven by Ventura County.
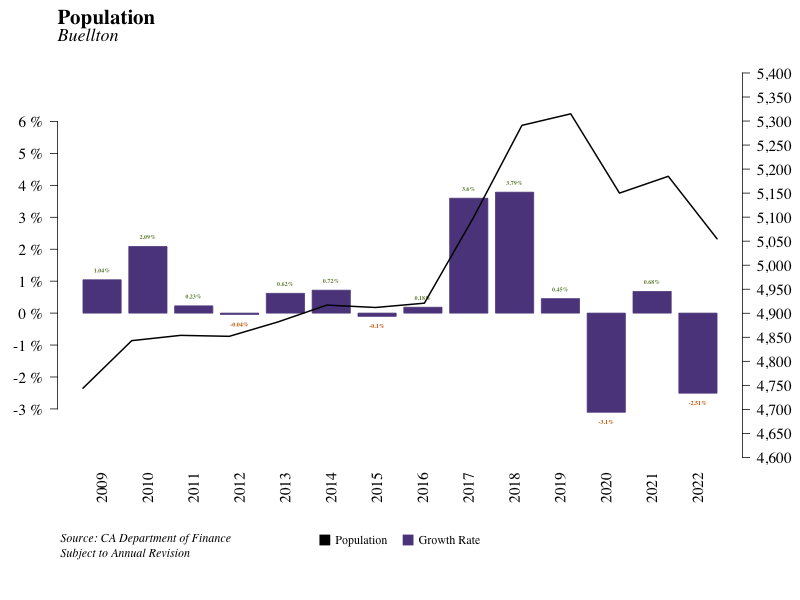
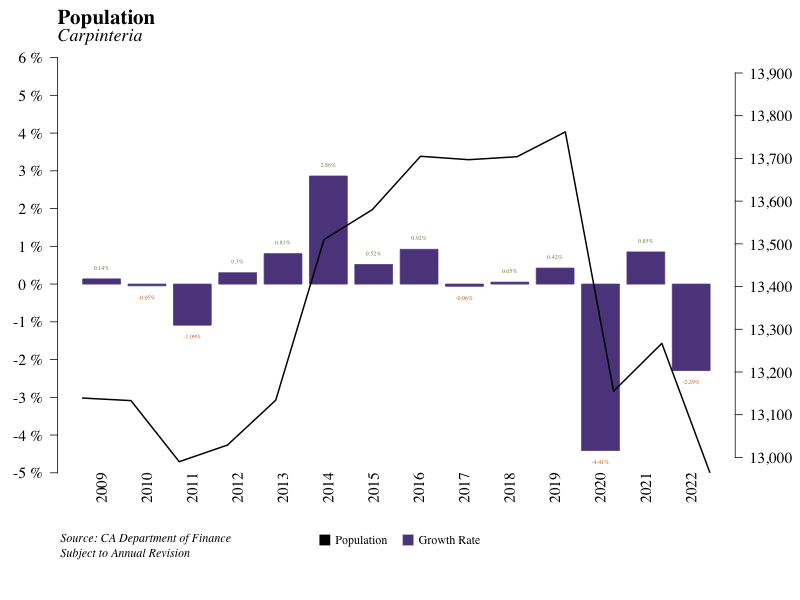
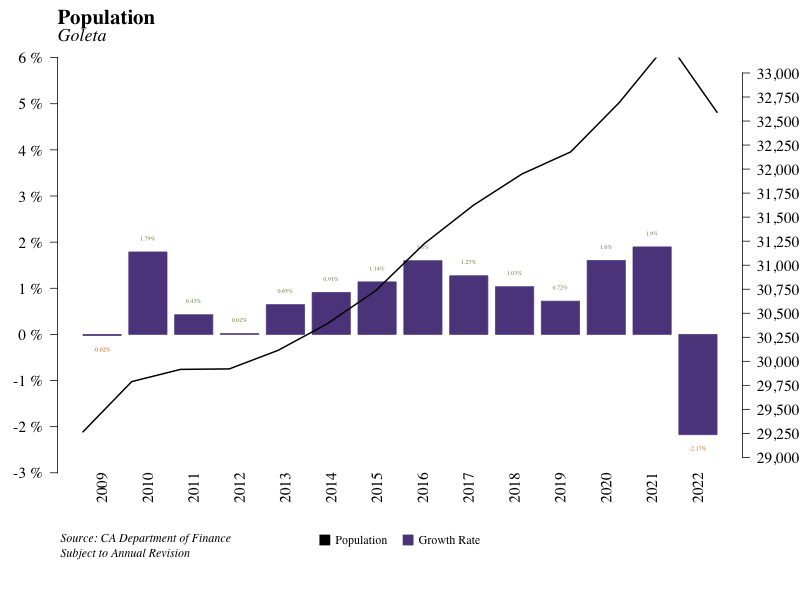
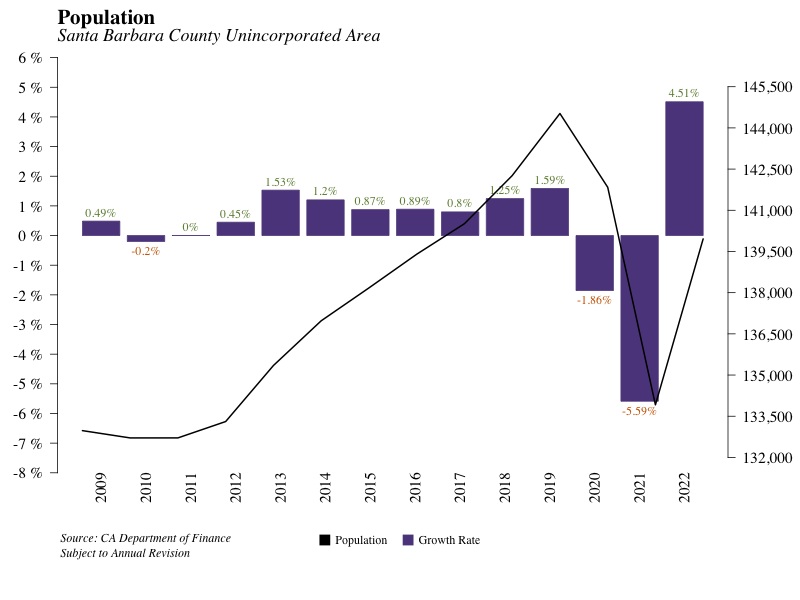
In Santa Barbara County specifically, unincorporated areas experienced the highest growth rate in 2023 at 4.51%. On the other hand, many areas of Santa Barbara County experienced negative growth. These areas include Buellton, Carpinteria, and Goleta. Among cities with a negative growth rate, Solvang faced the lowest growth rate, at -2.54%.
6.1.2 Components of Change
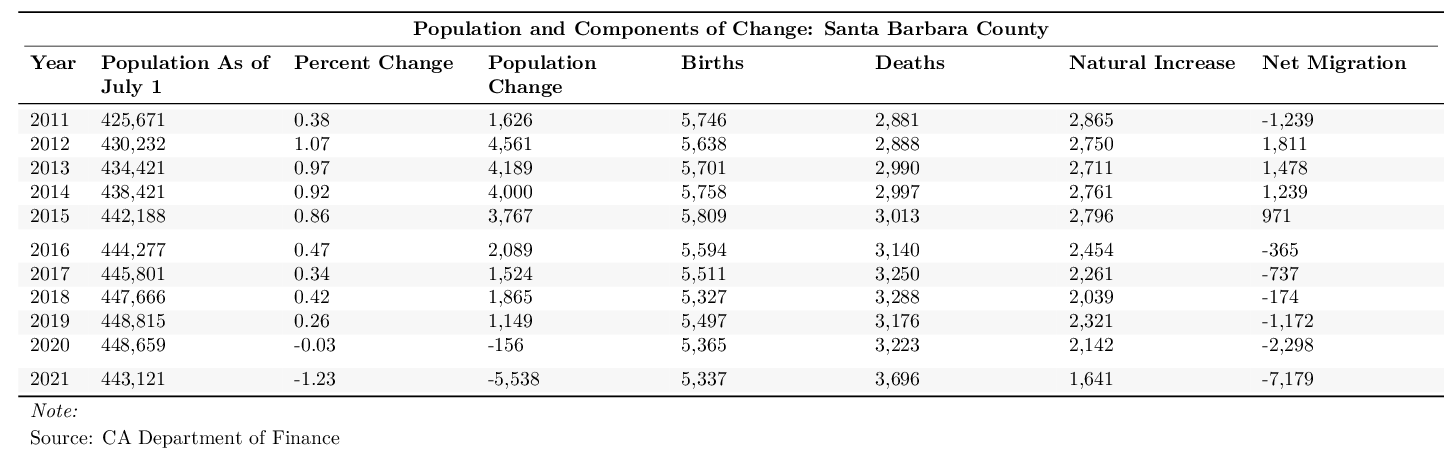
According to data from the California Department of Finance, the population in Santa Barbara County as of July 2022 was lower in July of 2021. The -1.23% population decrease from July 2020 to July 2021 was the largest decrease in the county population since the data began in 2011. While births in the county outnumbered deaths by 1,641 in 2022, net migration was negative at -7,179. Net migration in California as a whole was negative in 2022, with population growth of -0.44%.
6.1.3 Demographic Detail
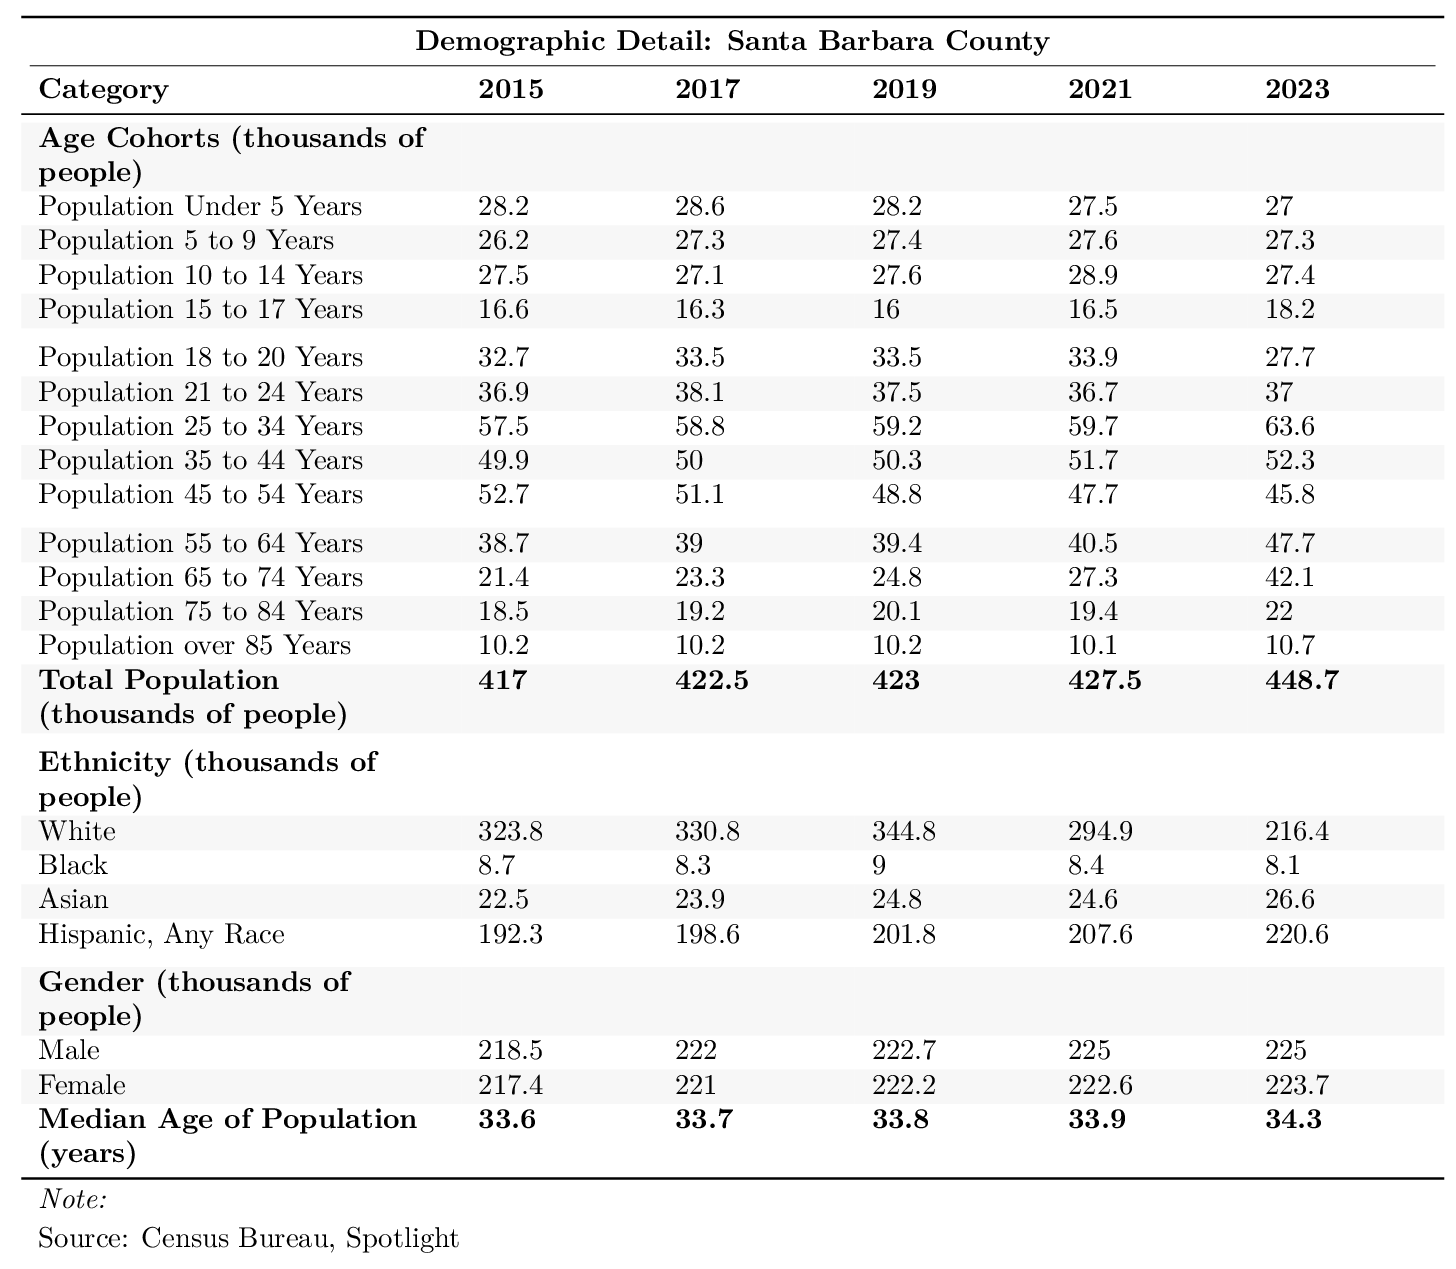
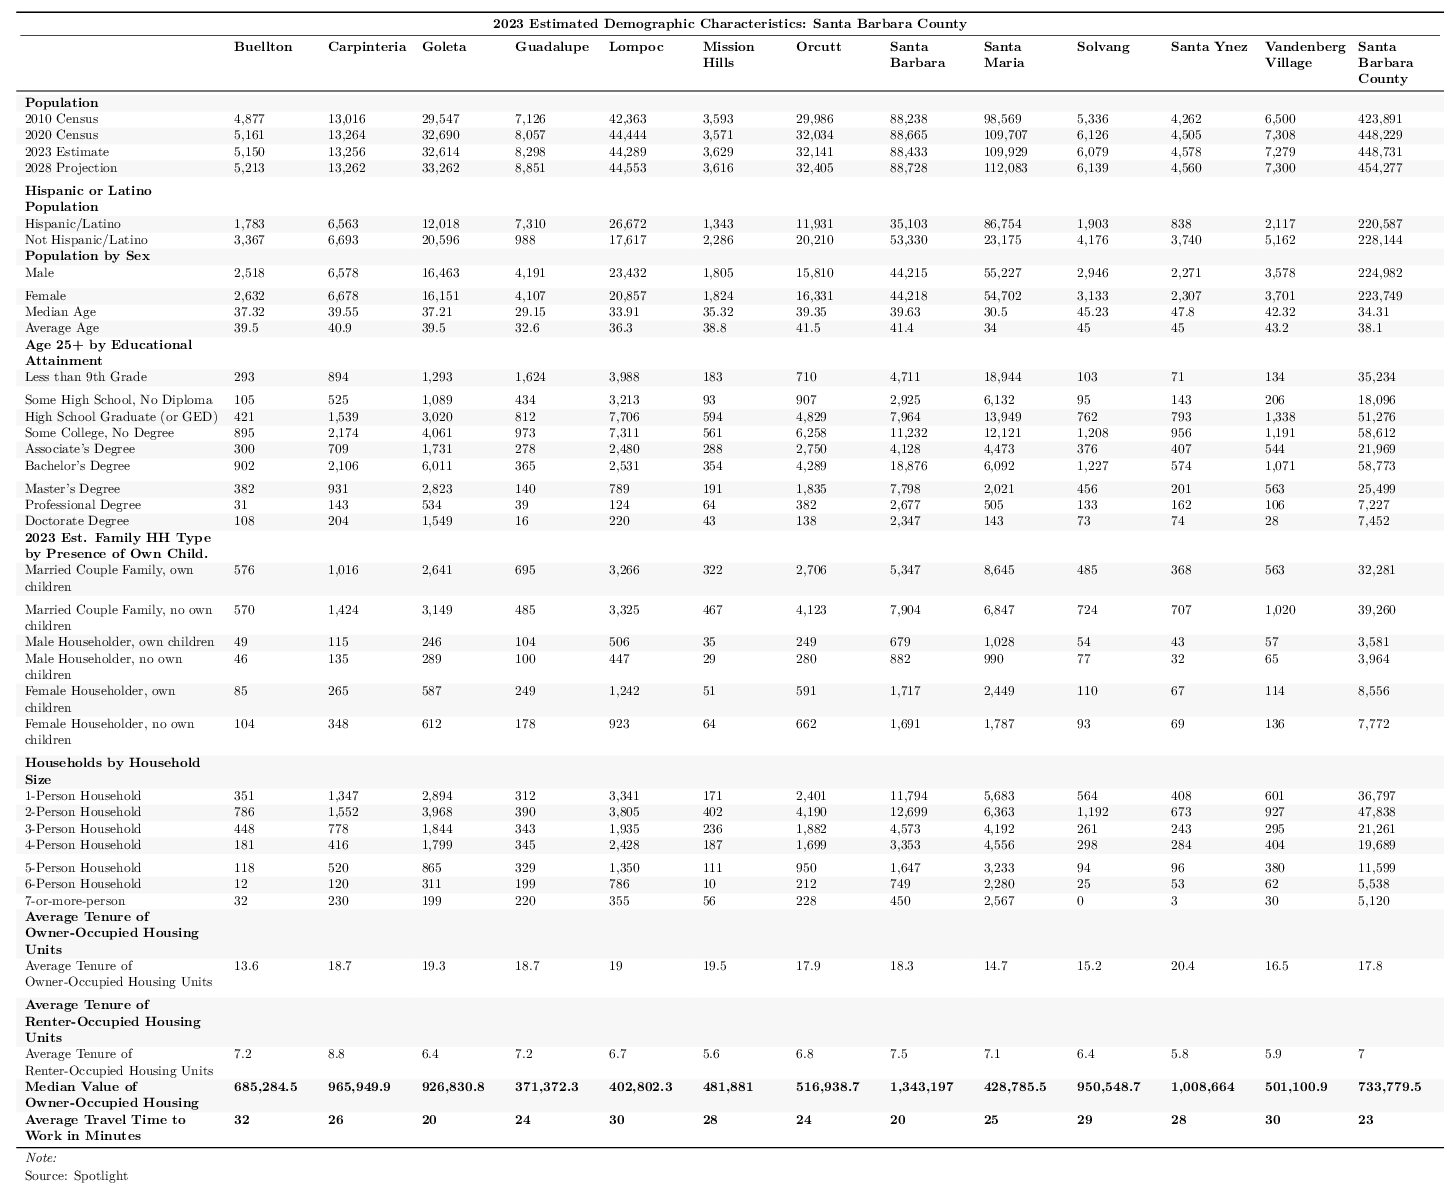
Incorporated areas of Santa Barbara County are expected to see population increase to 448,700 in 2023, up from 427,500 in 2021. Within the increasing population, there is no clear trend of groups of age demographics that are significantly increasing or decreasing. Similarly, gender groups do not indicate significant differences. However, change of population is seen more clearly in ethnicities in Santa Barbara County. The white population has decreased since 2016, while the Black, Asian and Hispanic populations have increased.
6.1.4 Median Age
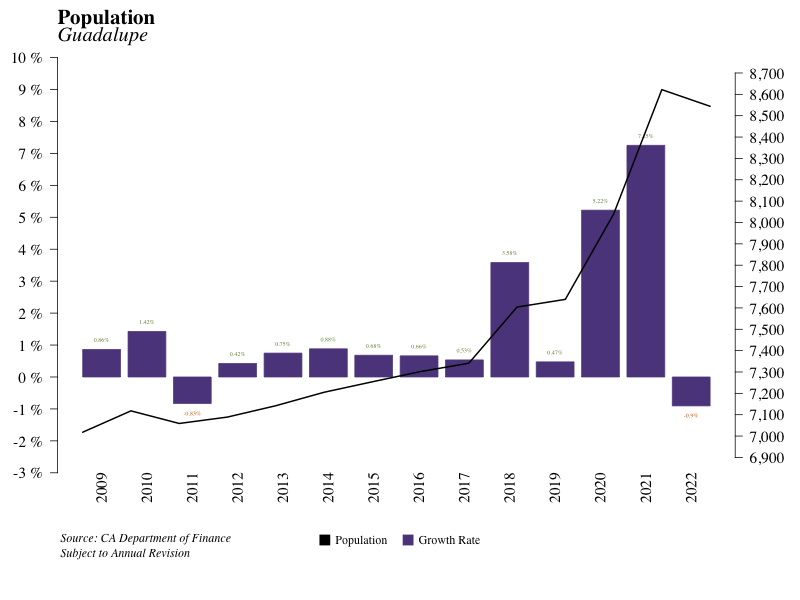
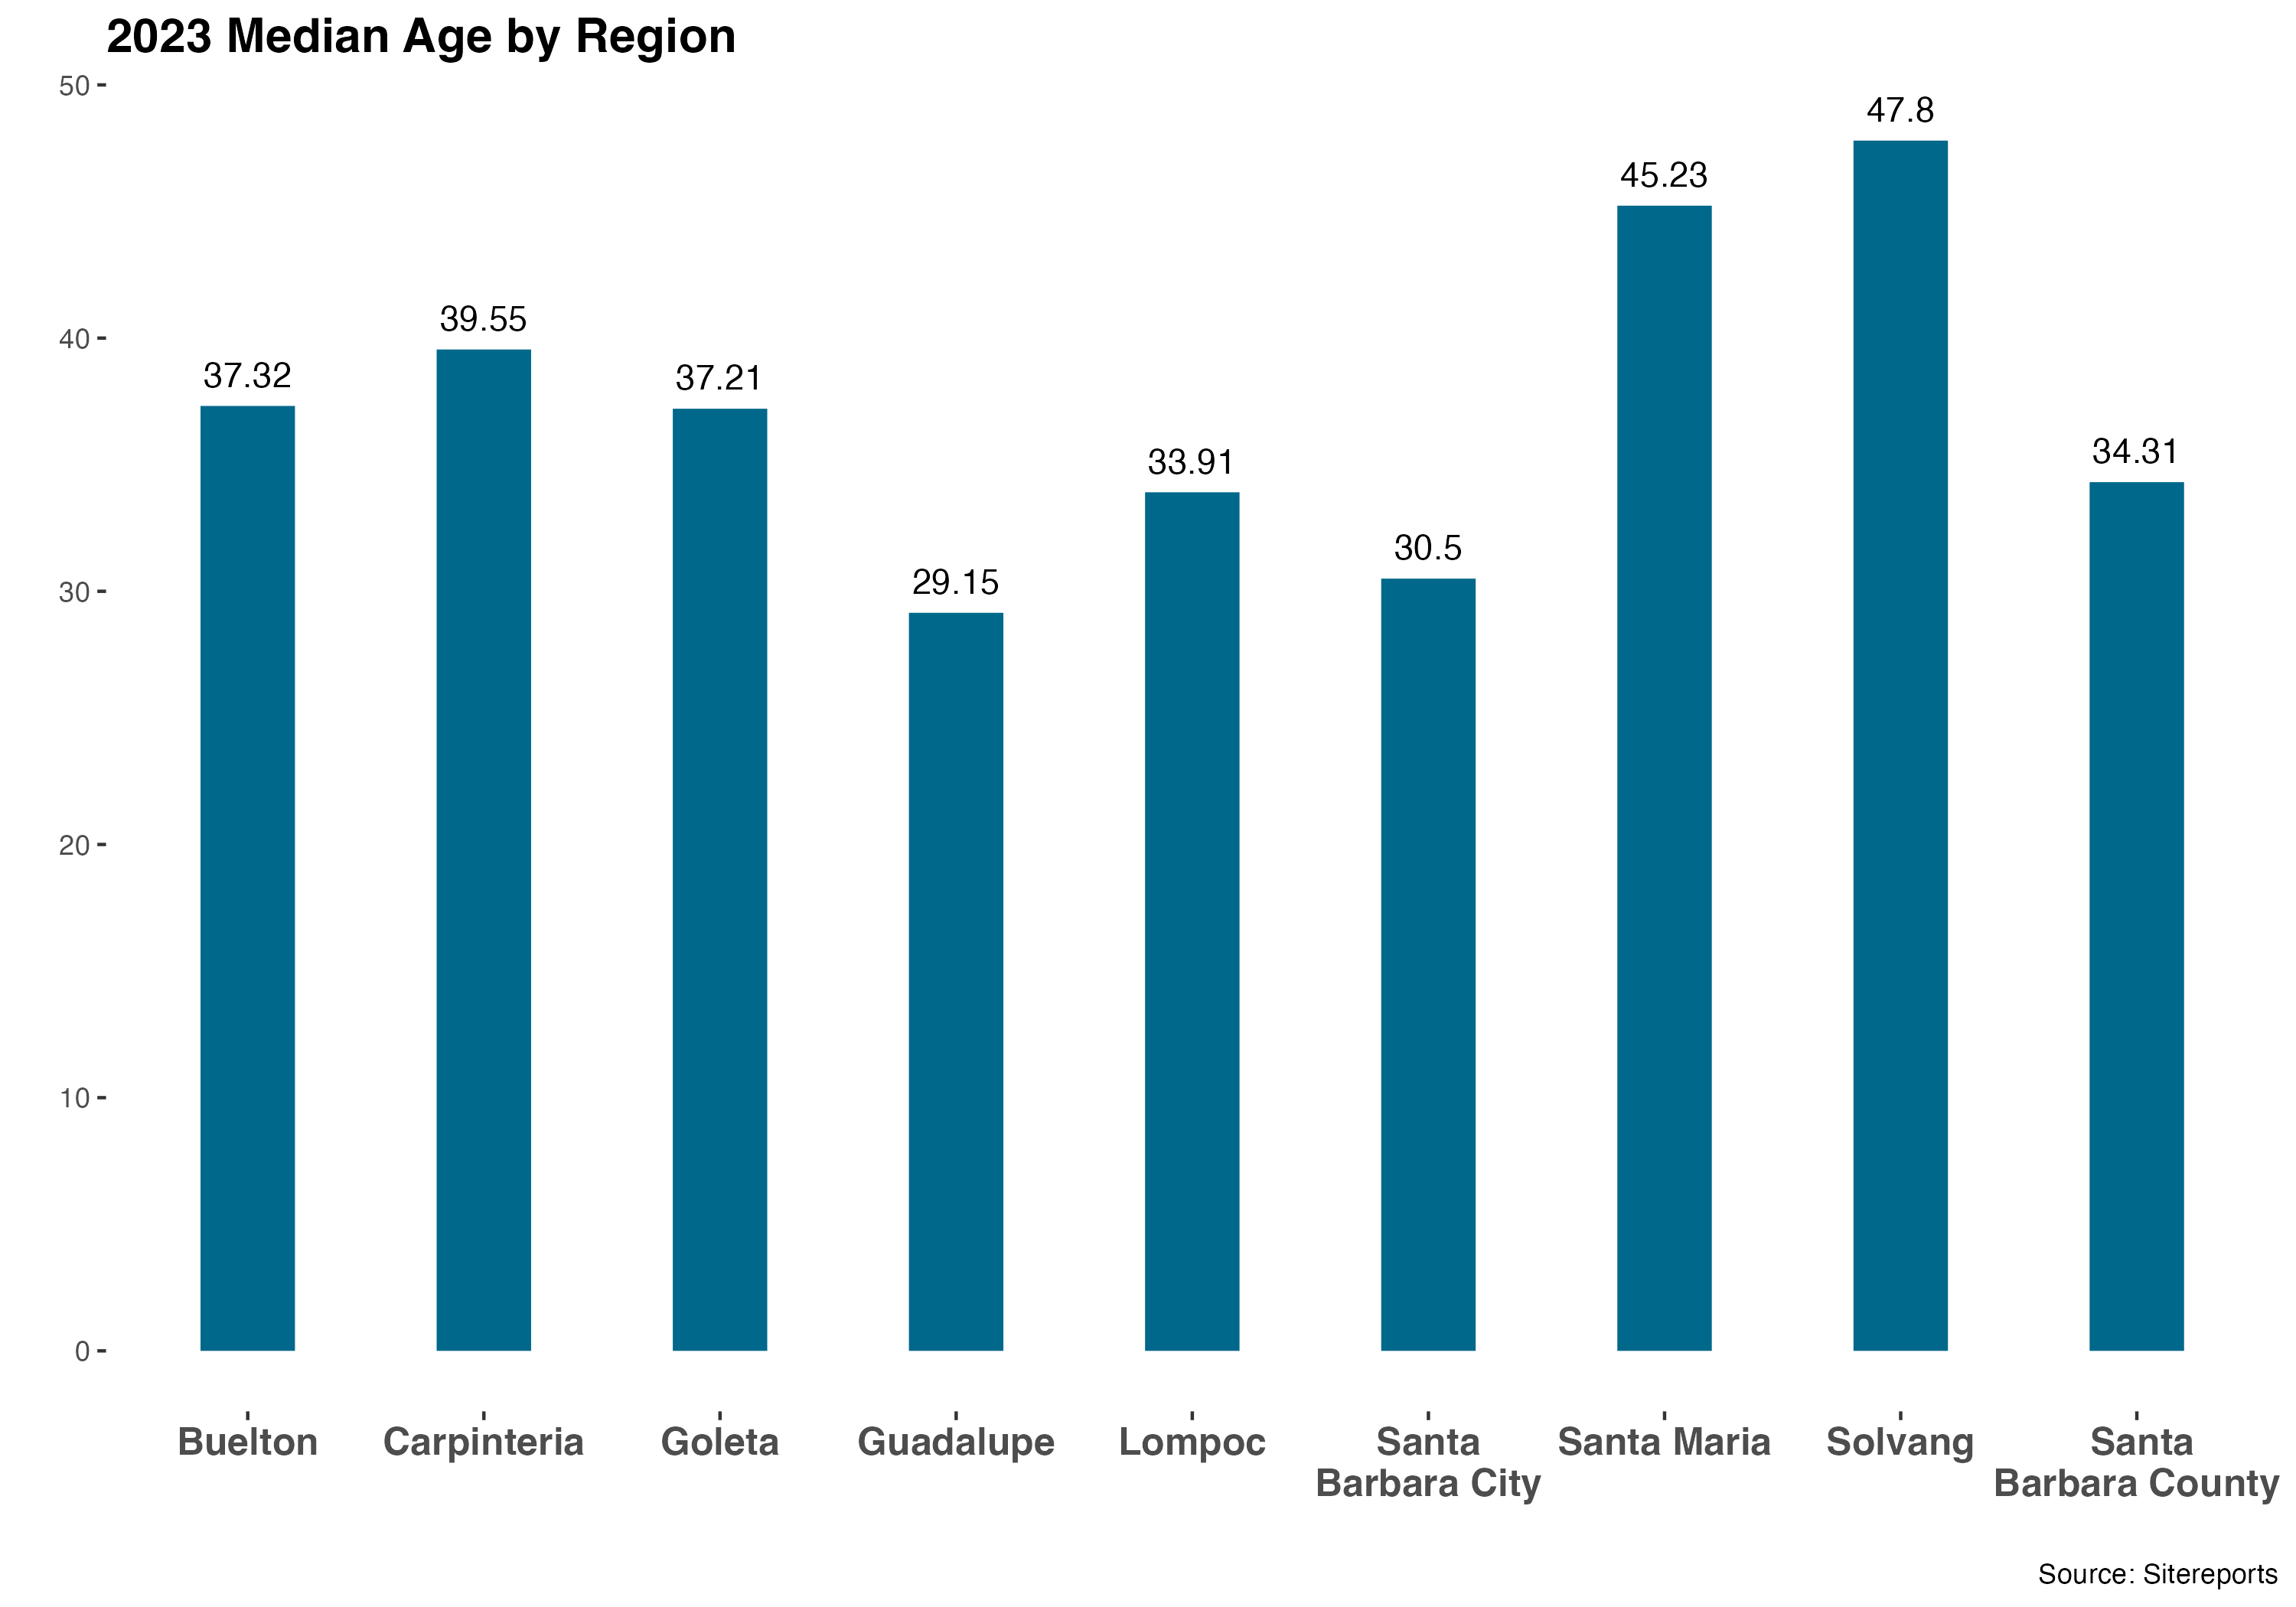
The median age in the recorded areas of Santa Barbara County is expected to be 34.3 in 2023. Guadalupe has the lowest median age, at 29.15 years old, and Solvang has the highest median age at 47.8 years old.
6.1.5 Housing
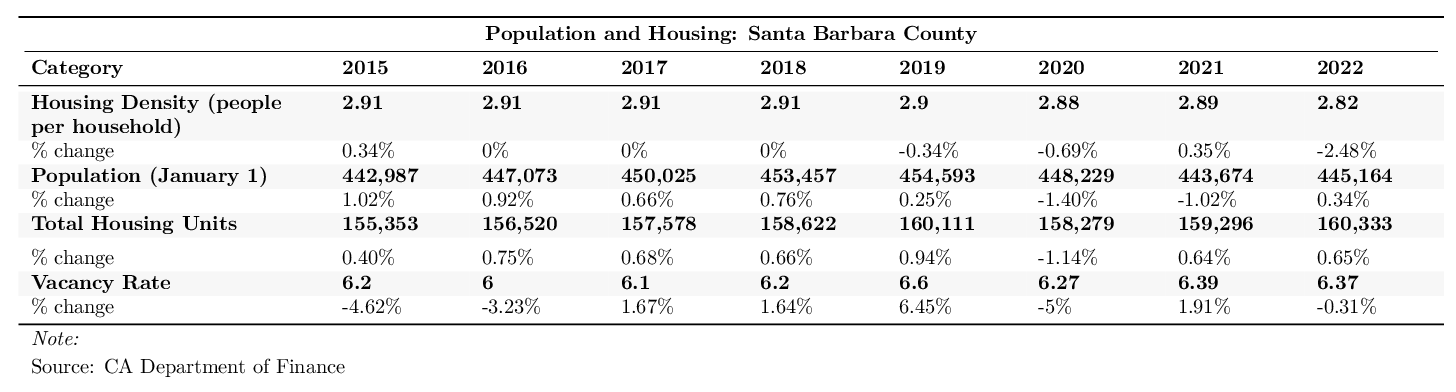
According to the Department of Finance, there are a total of 160,333 housing units in Santa Barbara County in 2023. This is a 0.65% increase from the housing unit count of 159,296 last year in 2022. By comparison, the population increased by 0.34% from 2022 to 2023. Furthermore, the vacancy rate decreased by 0.31% from 6.39 to 6.37 in the past year. Housing density has decreased from 2.89 people per household in 2022 to 2.82 people per household in 2023.
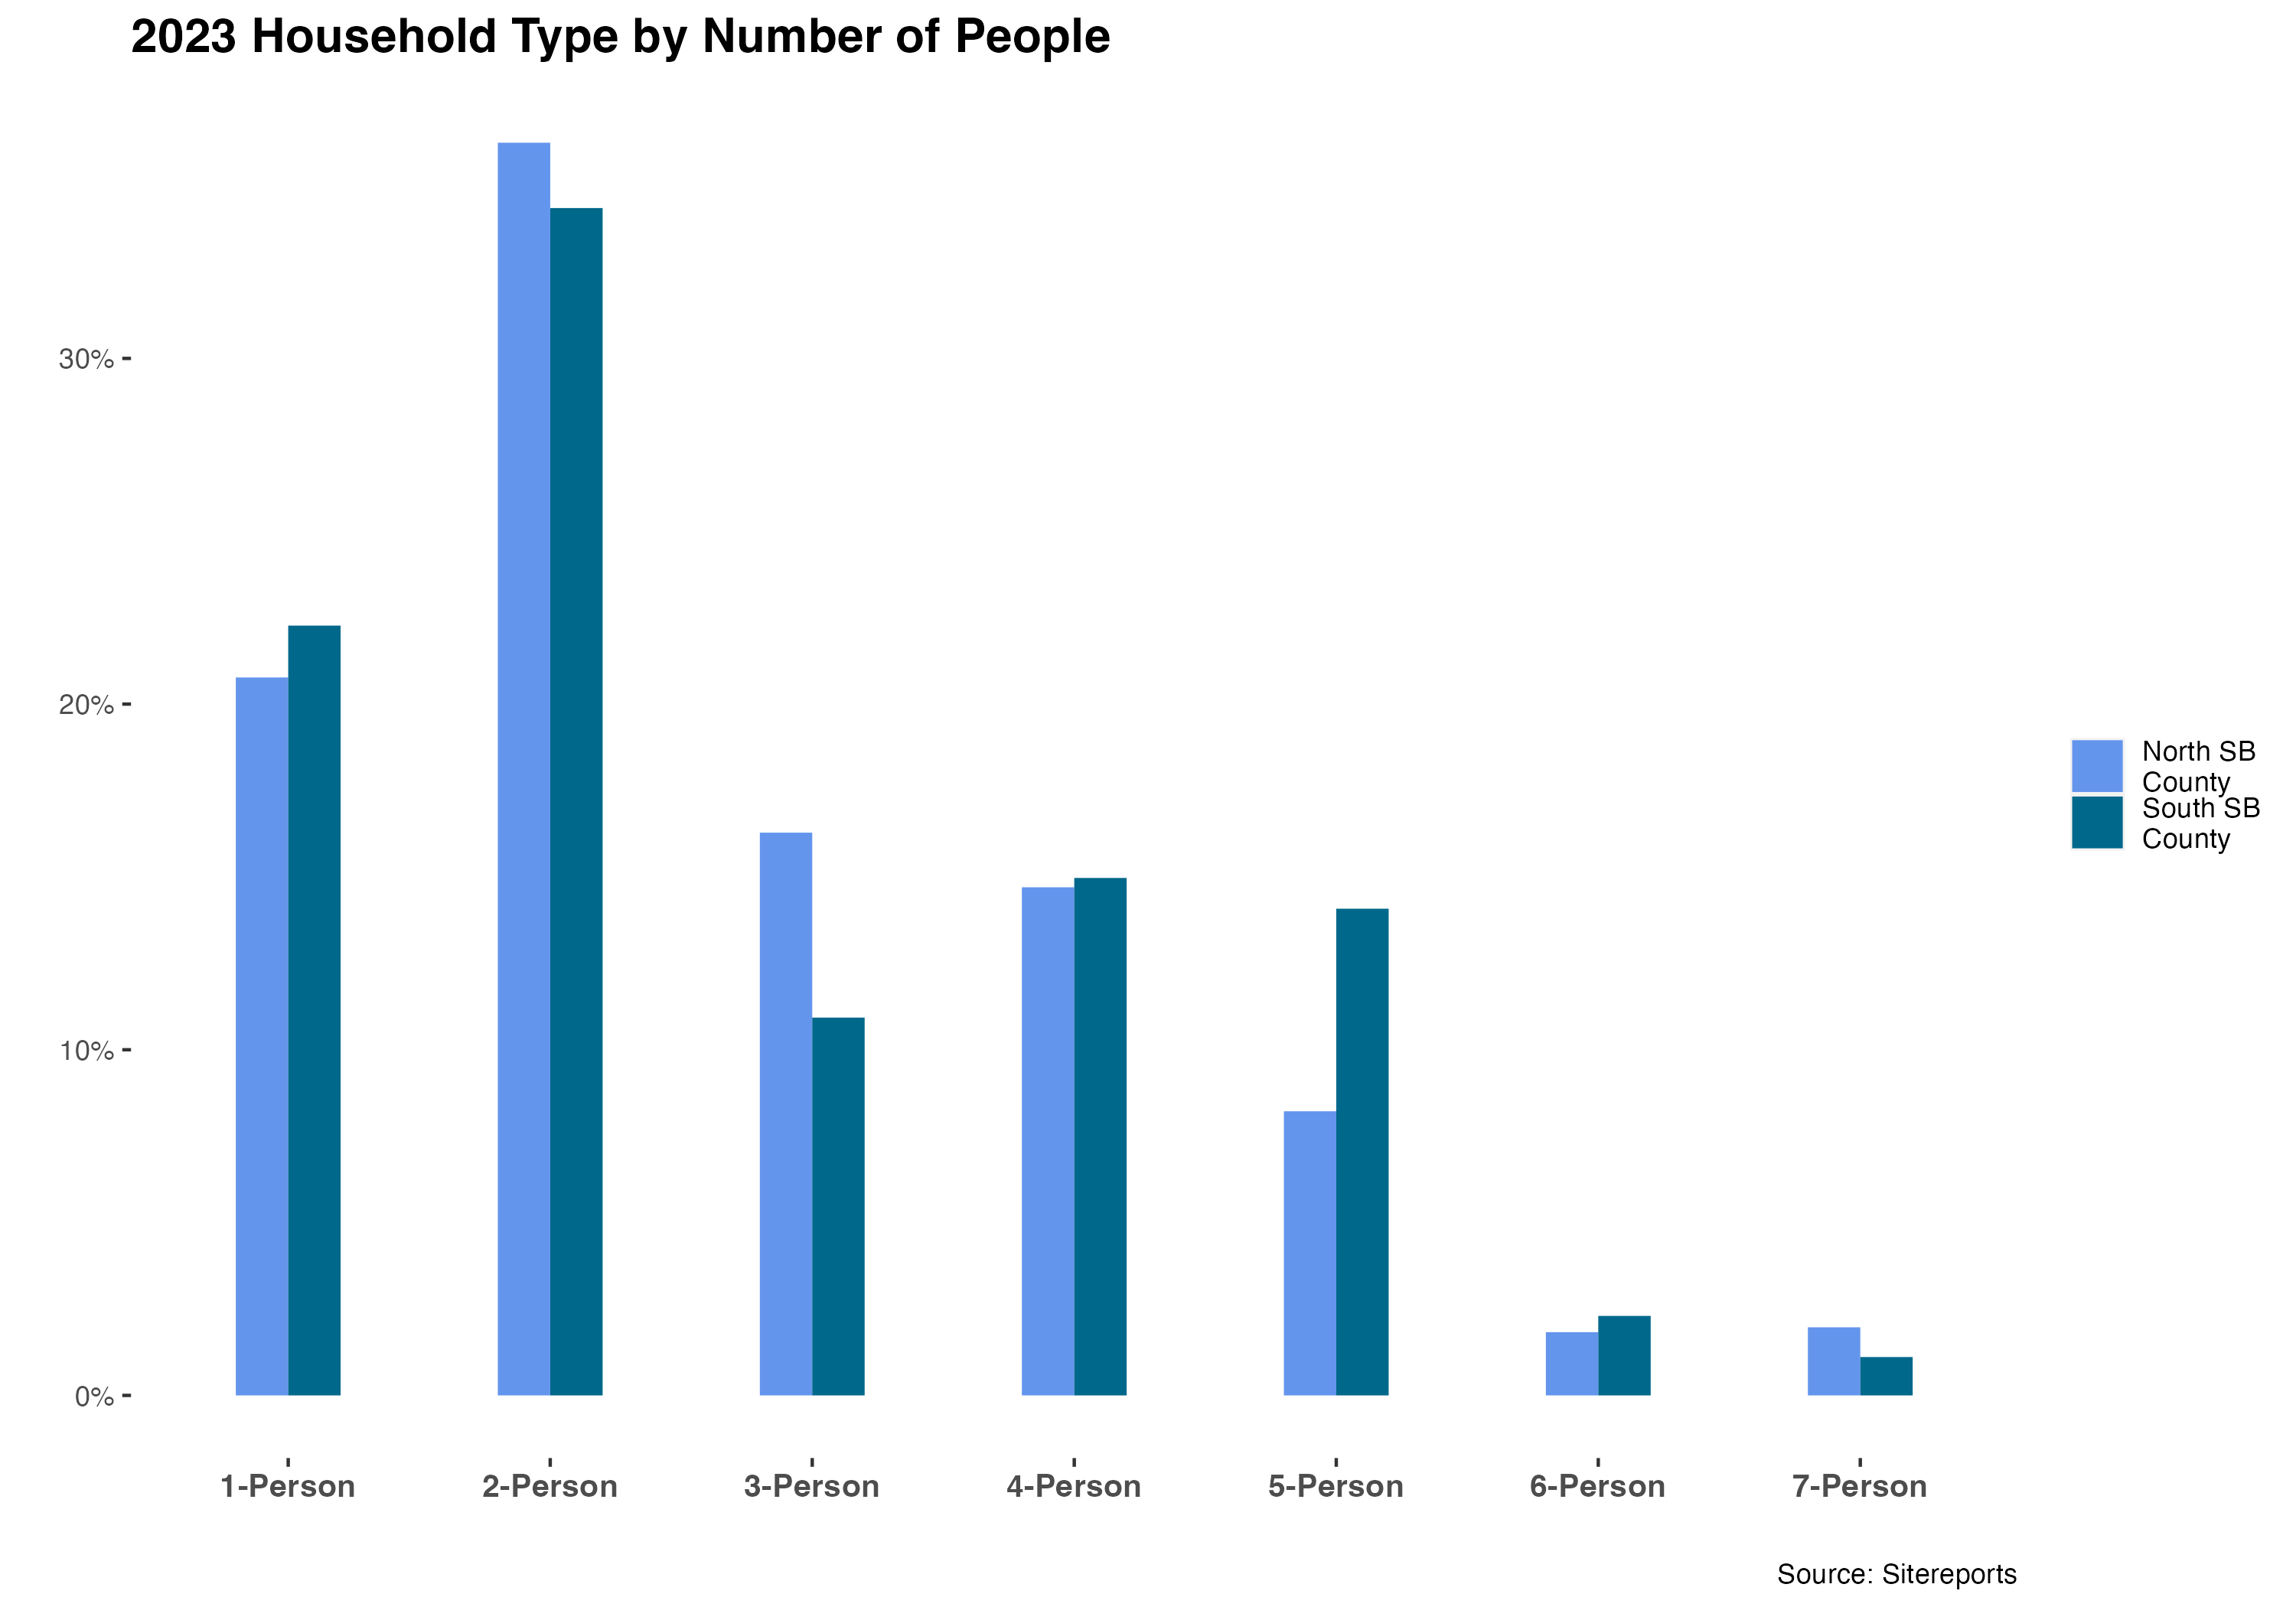
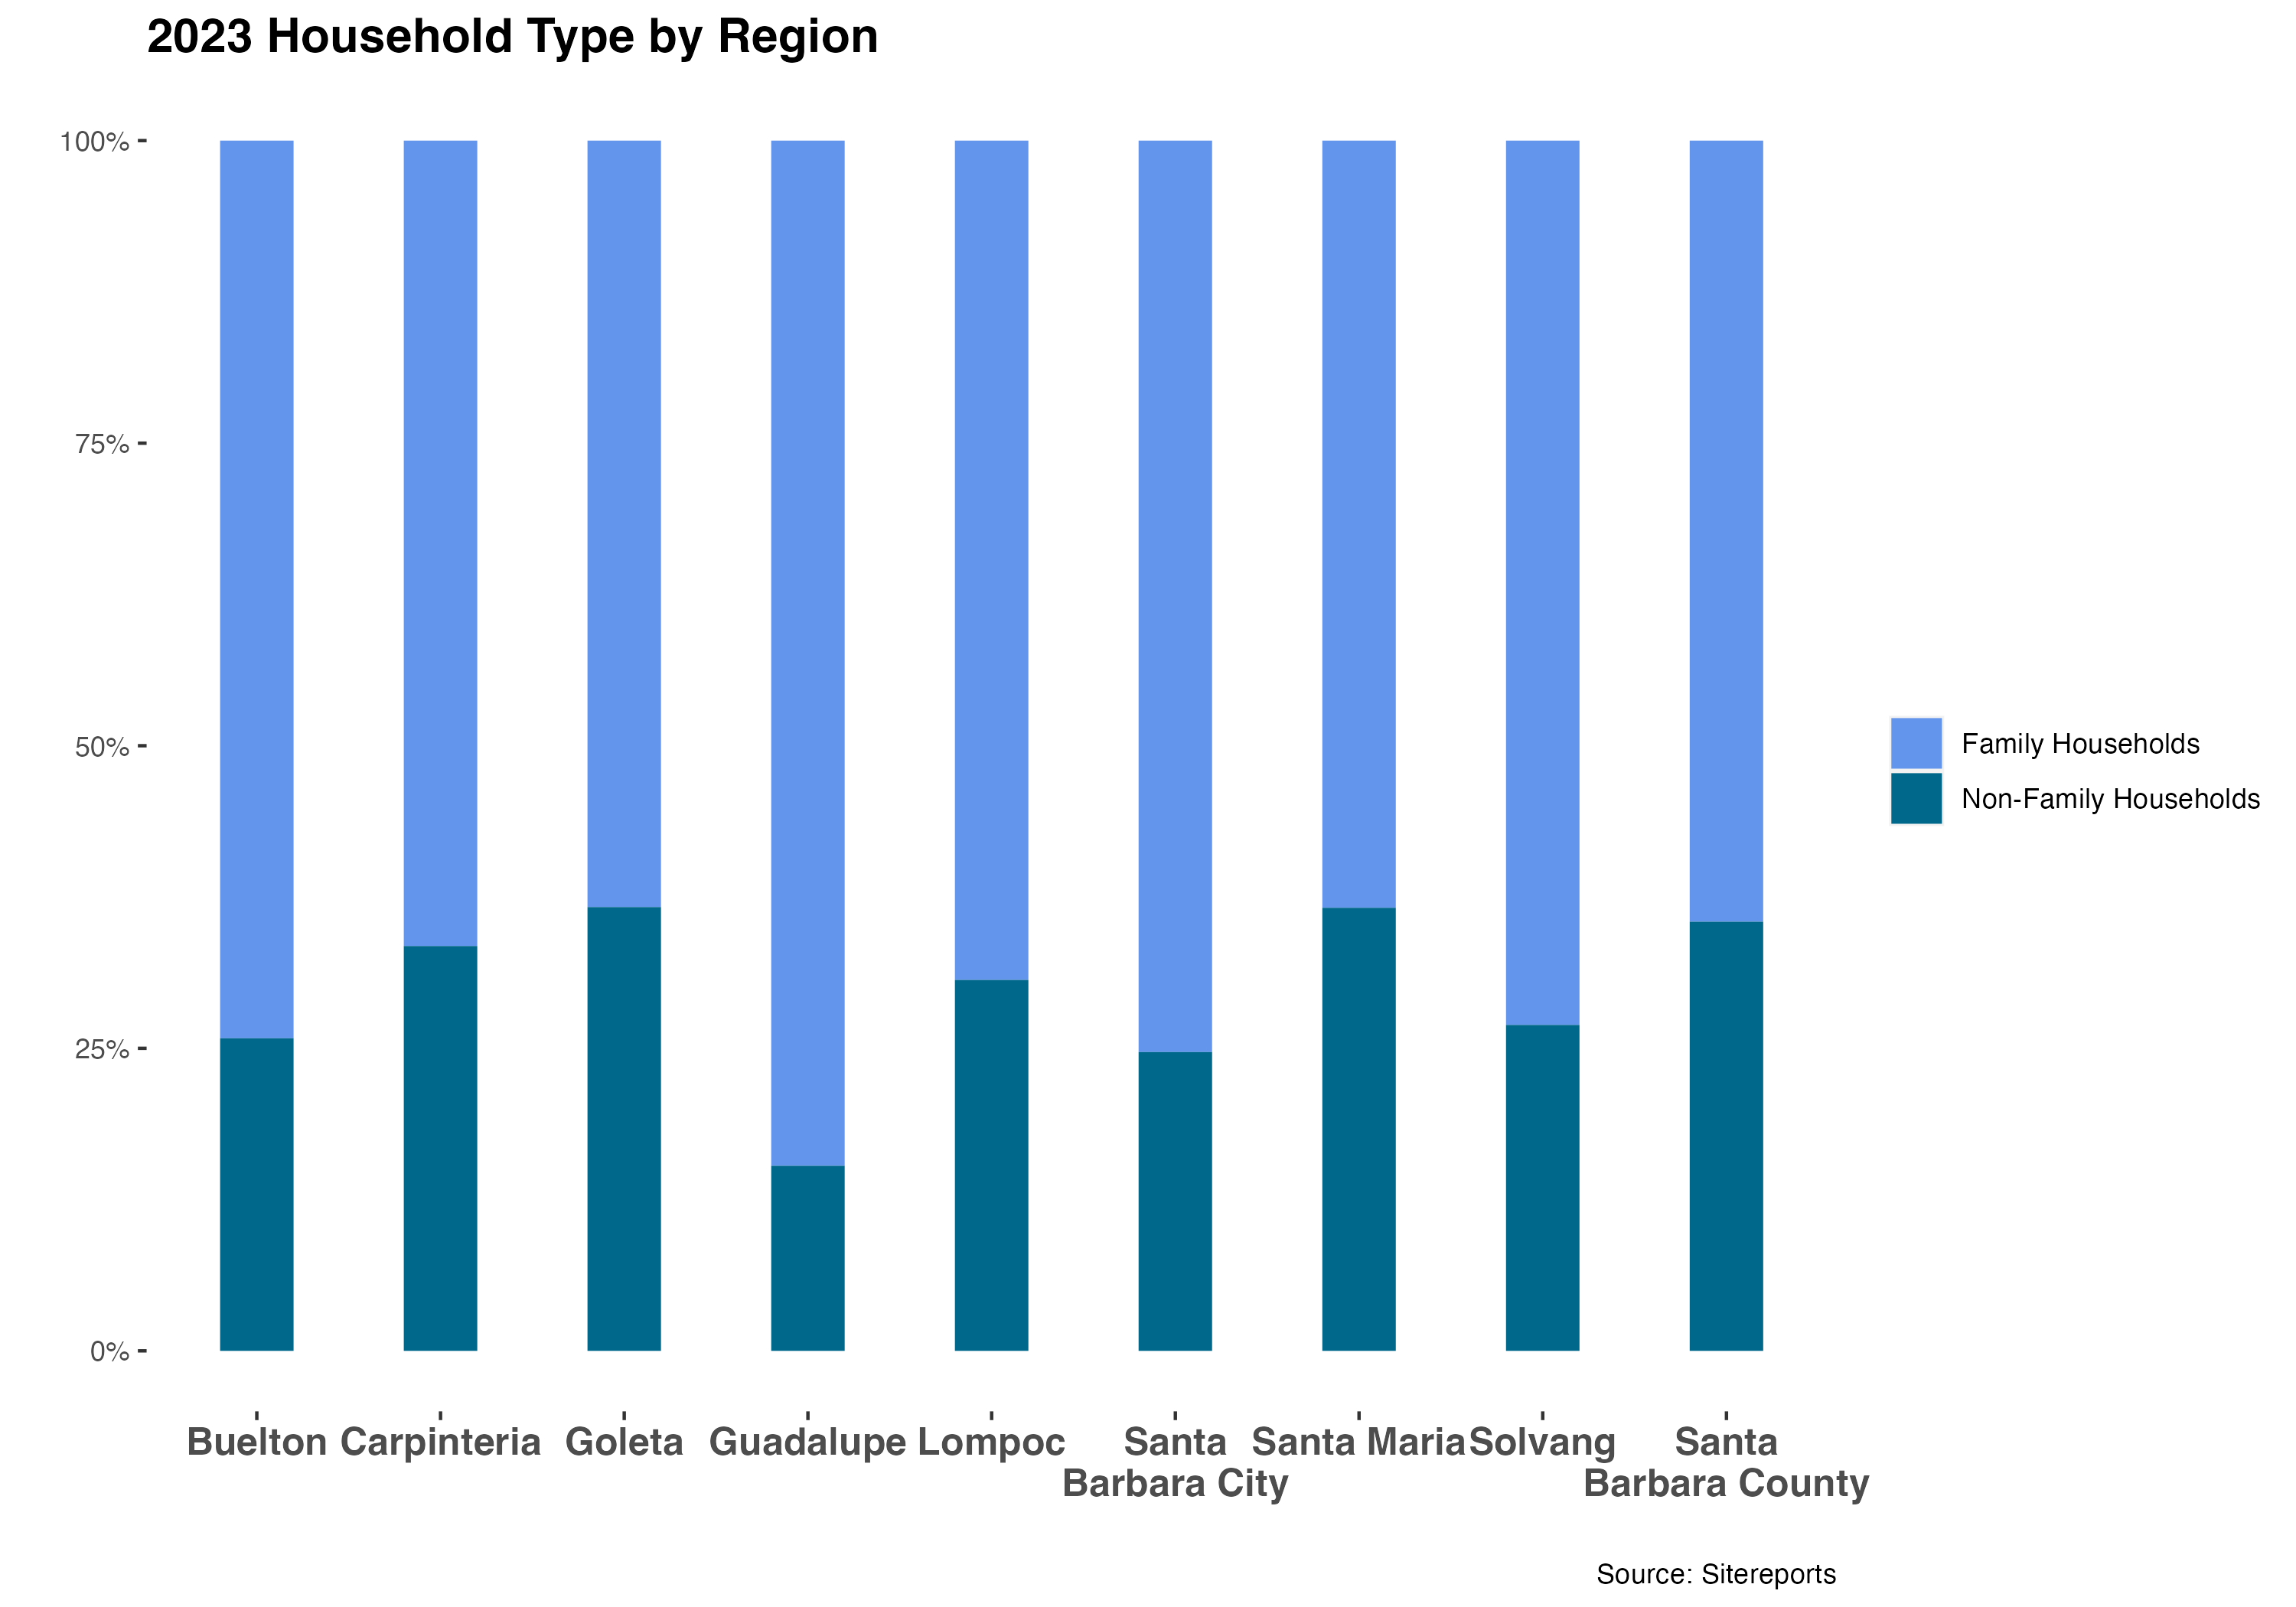
South Santa Barbara County has a higher percentage of one- and two-person households than North Santa Barbara County, while North Santa Barbara County has higher percentages of three-, four-, five-, six-, and seven-person households. Two-person households are the most common all across Santa Barbara County, accounting for over 30% of households in both North and South Santa Barbara County. Family households outnumber non-family households in every city in Santa Barbara County, with the smallest percentage of non-family households in Guadalupe.
6.2 Crime
Key Points:
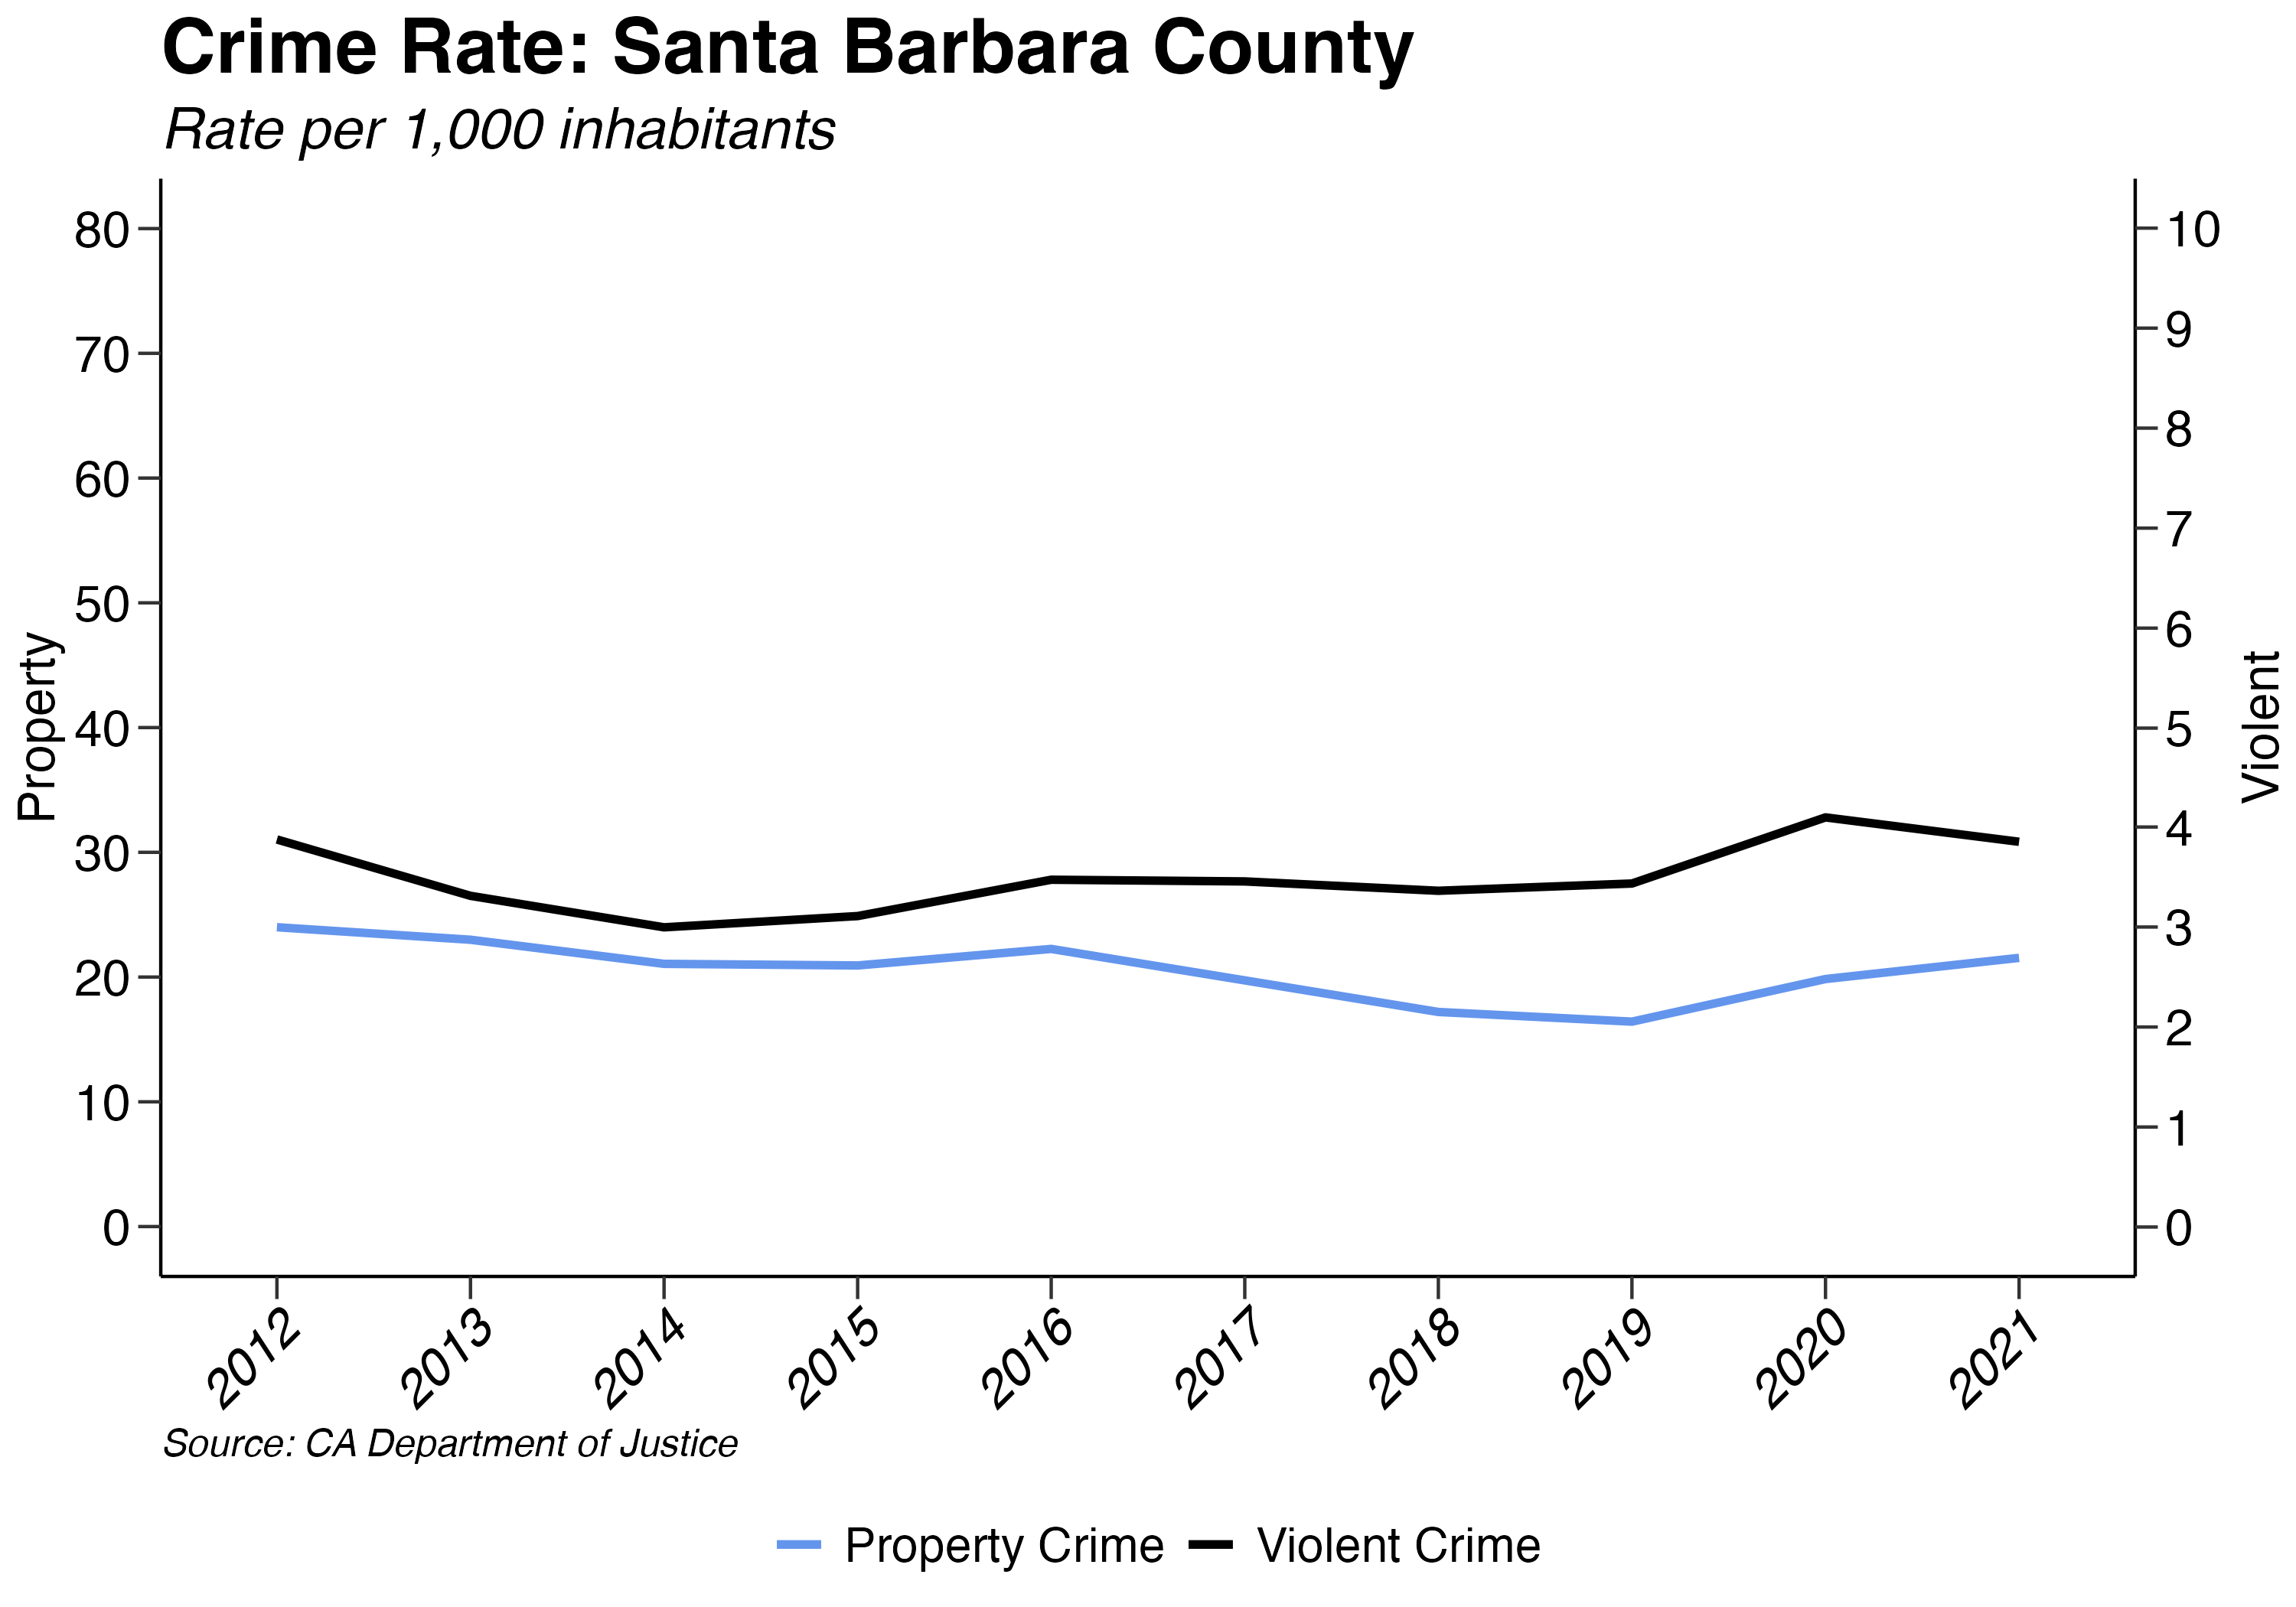
- Santa Barbara County’s violent crime rate decreased from 4.1 to 3.86 crimes per 1,000 persons from 2020 to 2021.
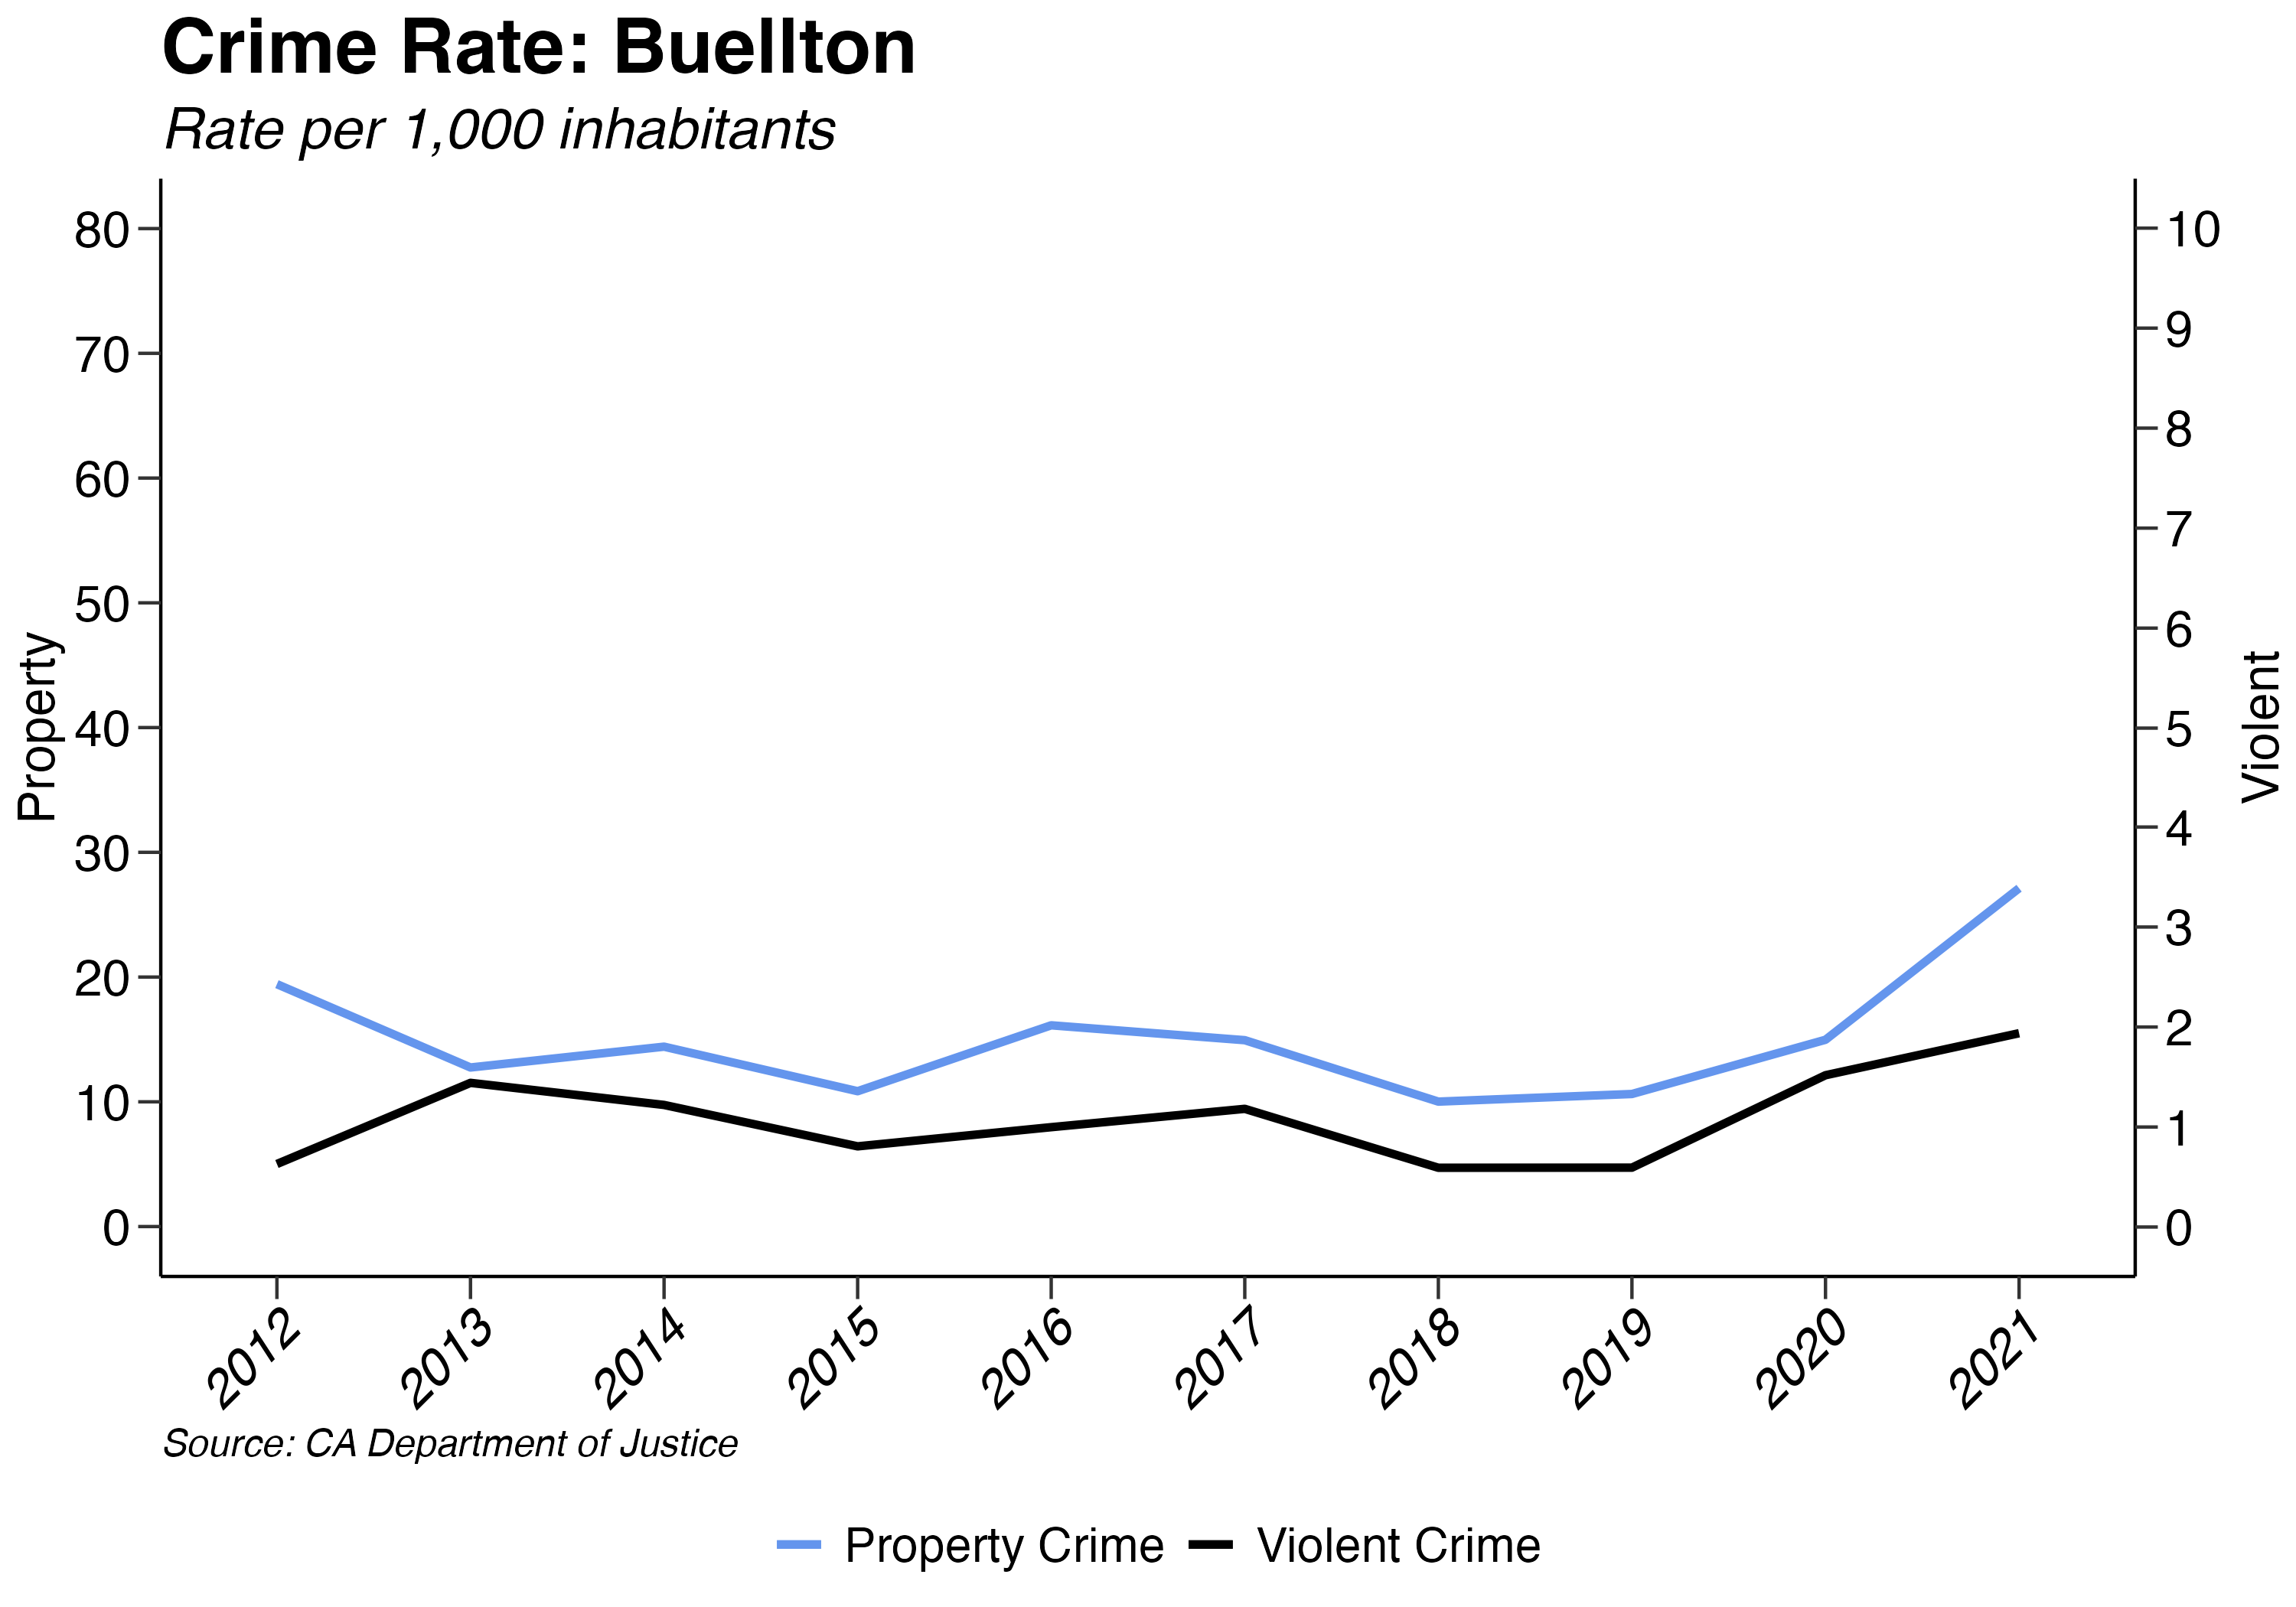
- Guadalupe had the lowest property crime rate and Buellton the highest in 2021.
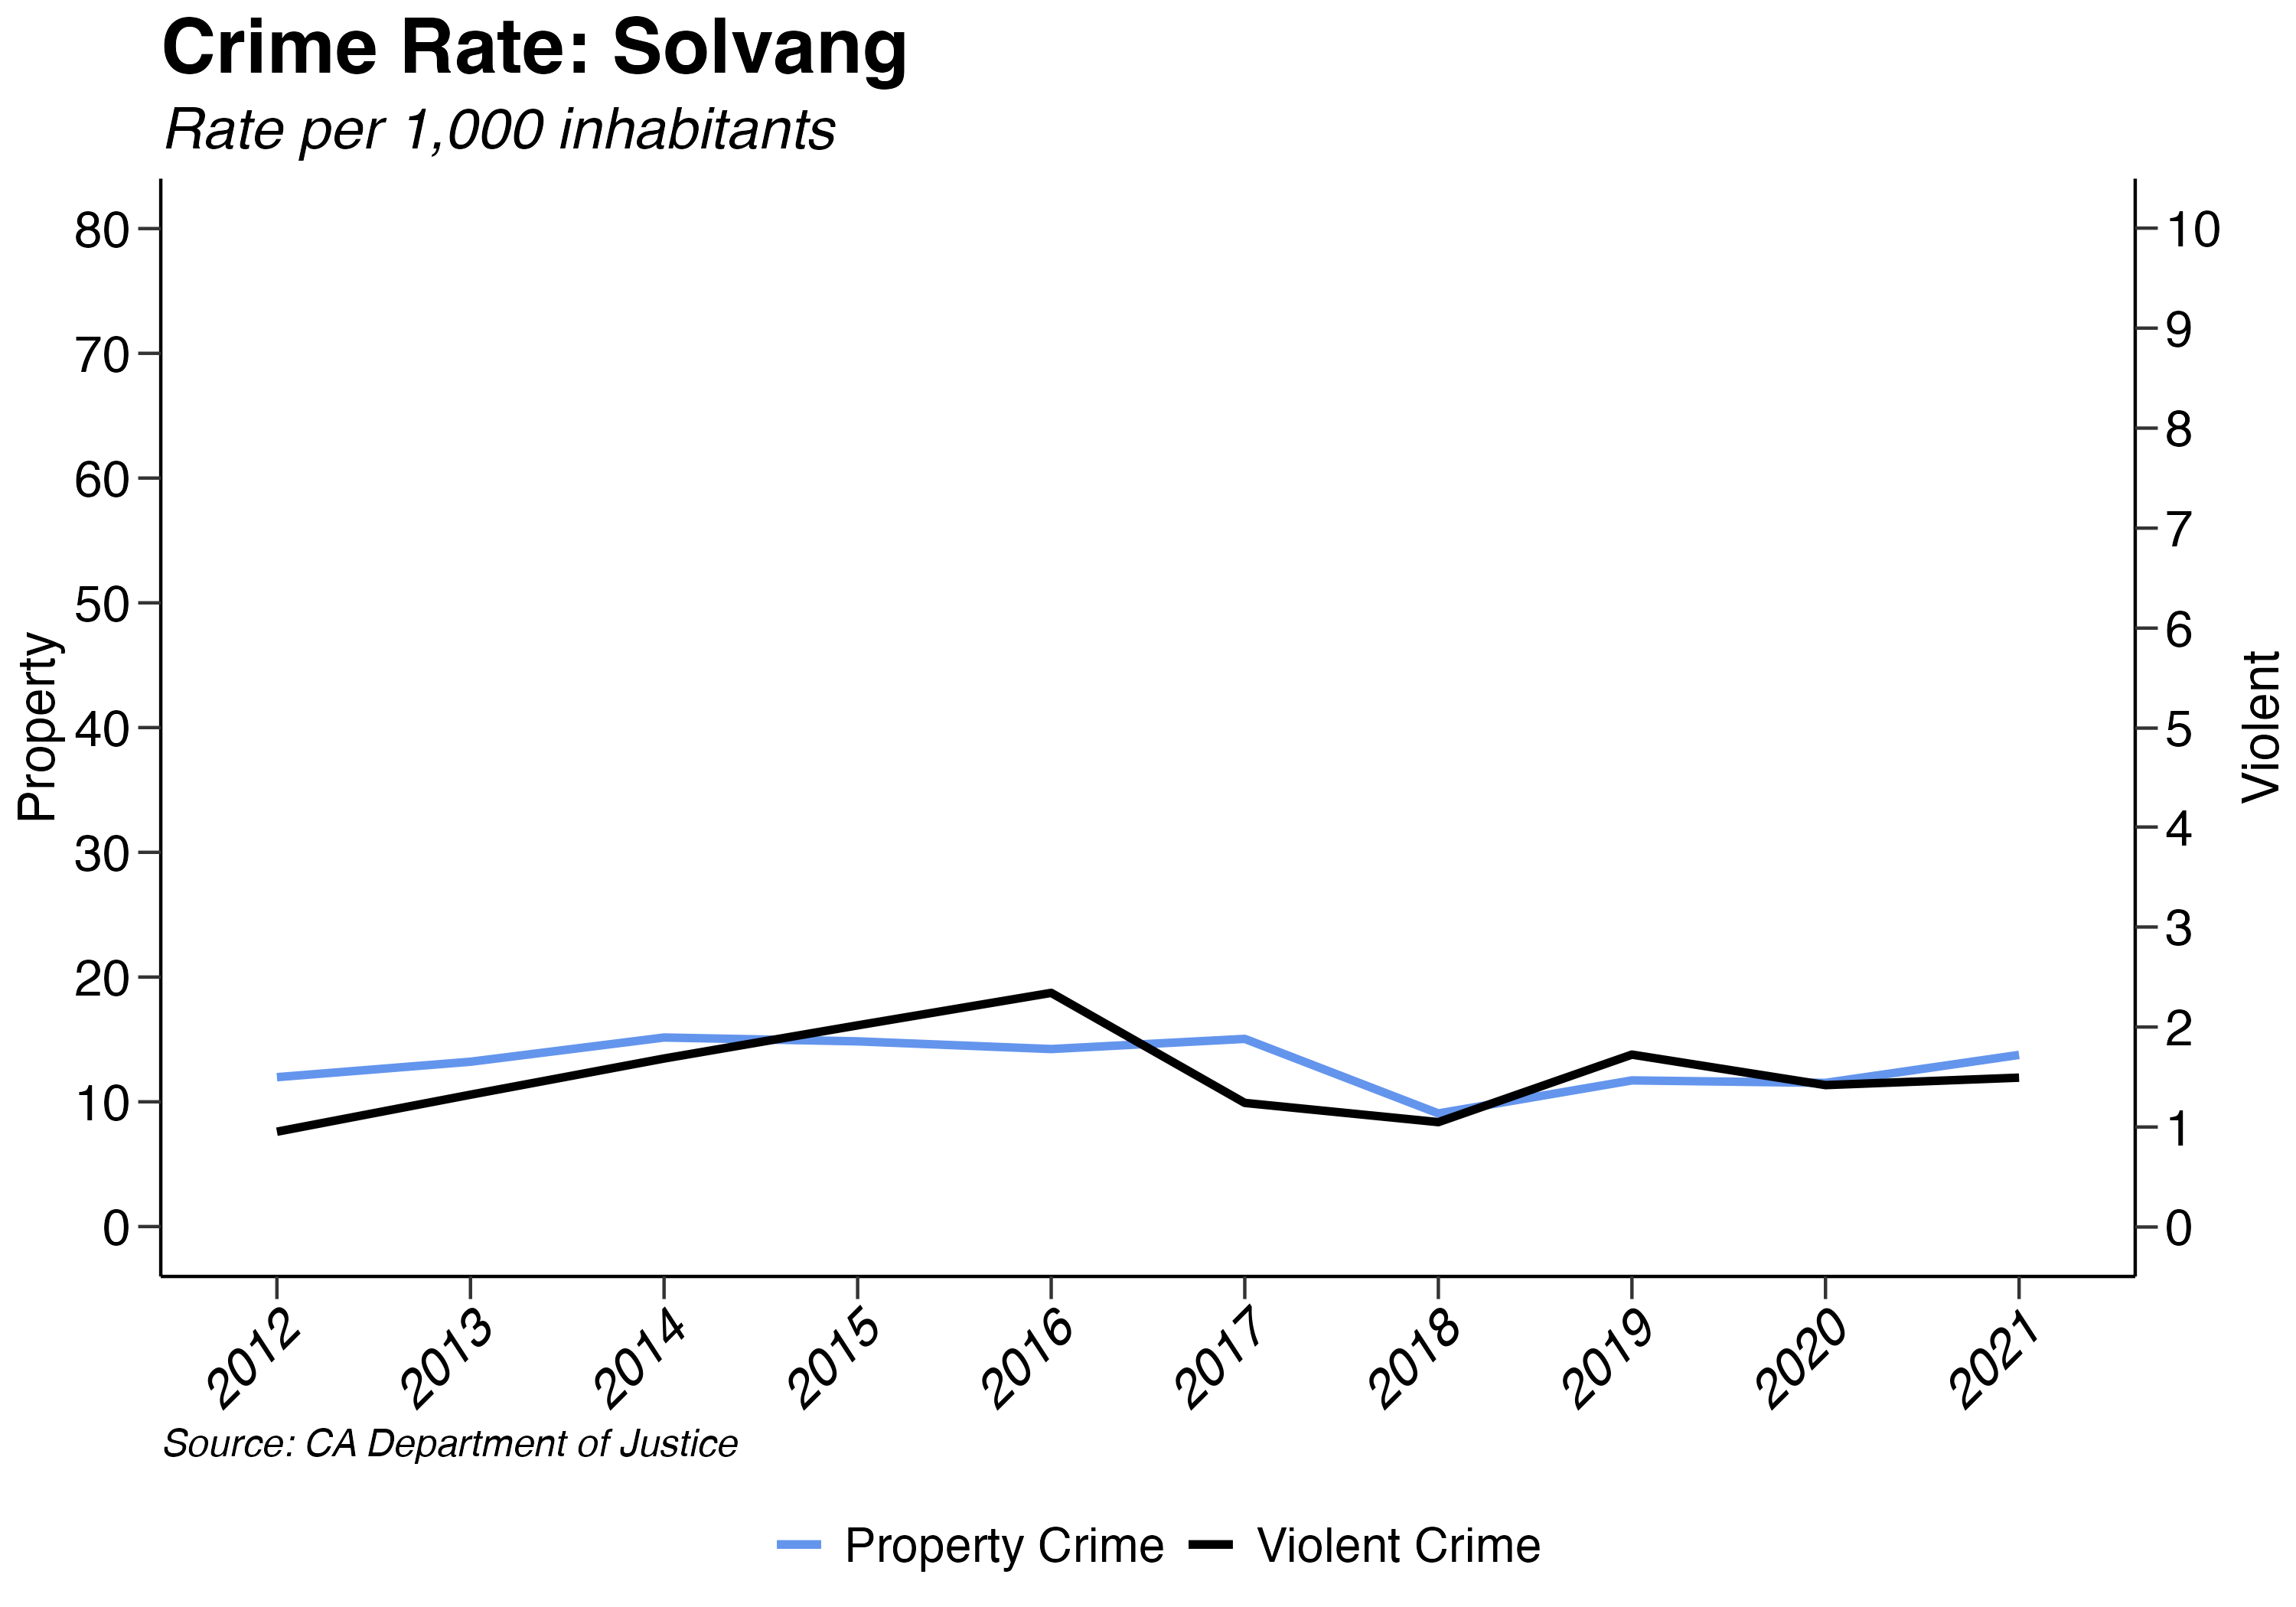
- Solvang had the lowest violent crime rate and Lompoc the highest in 2021.
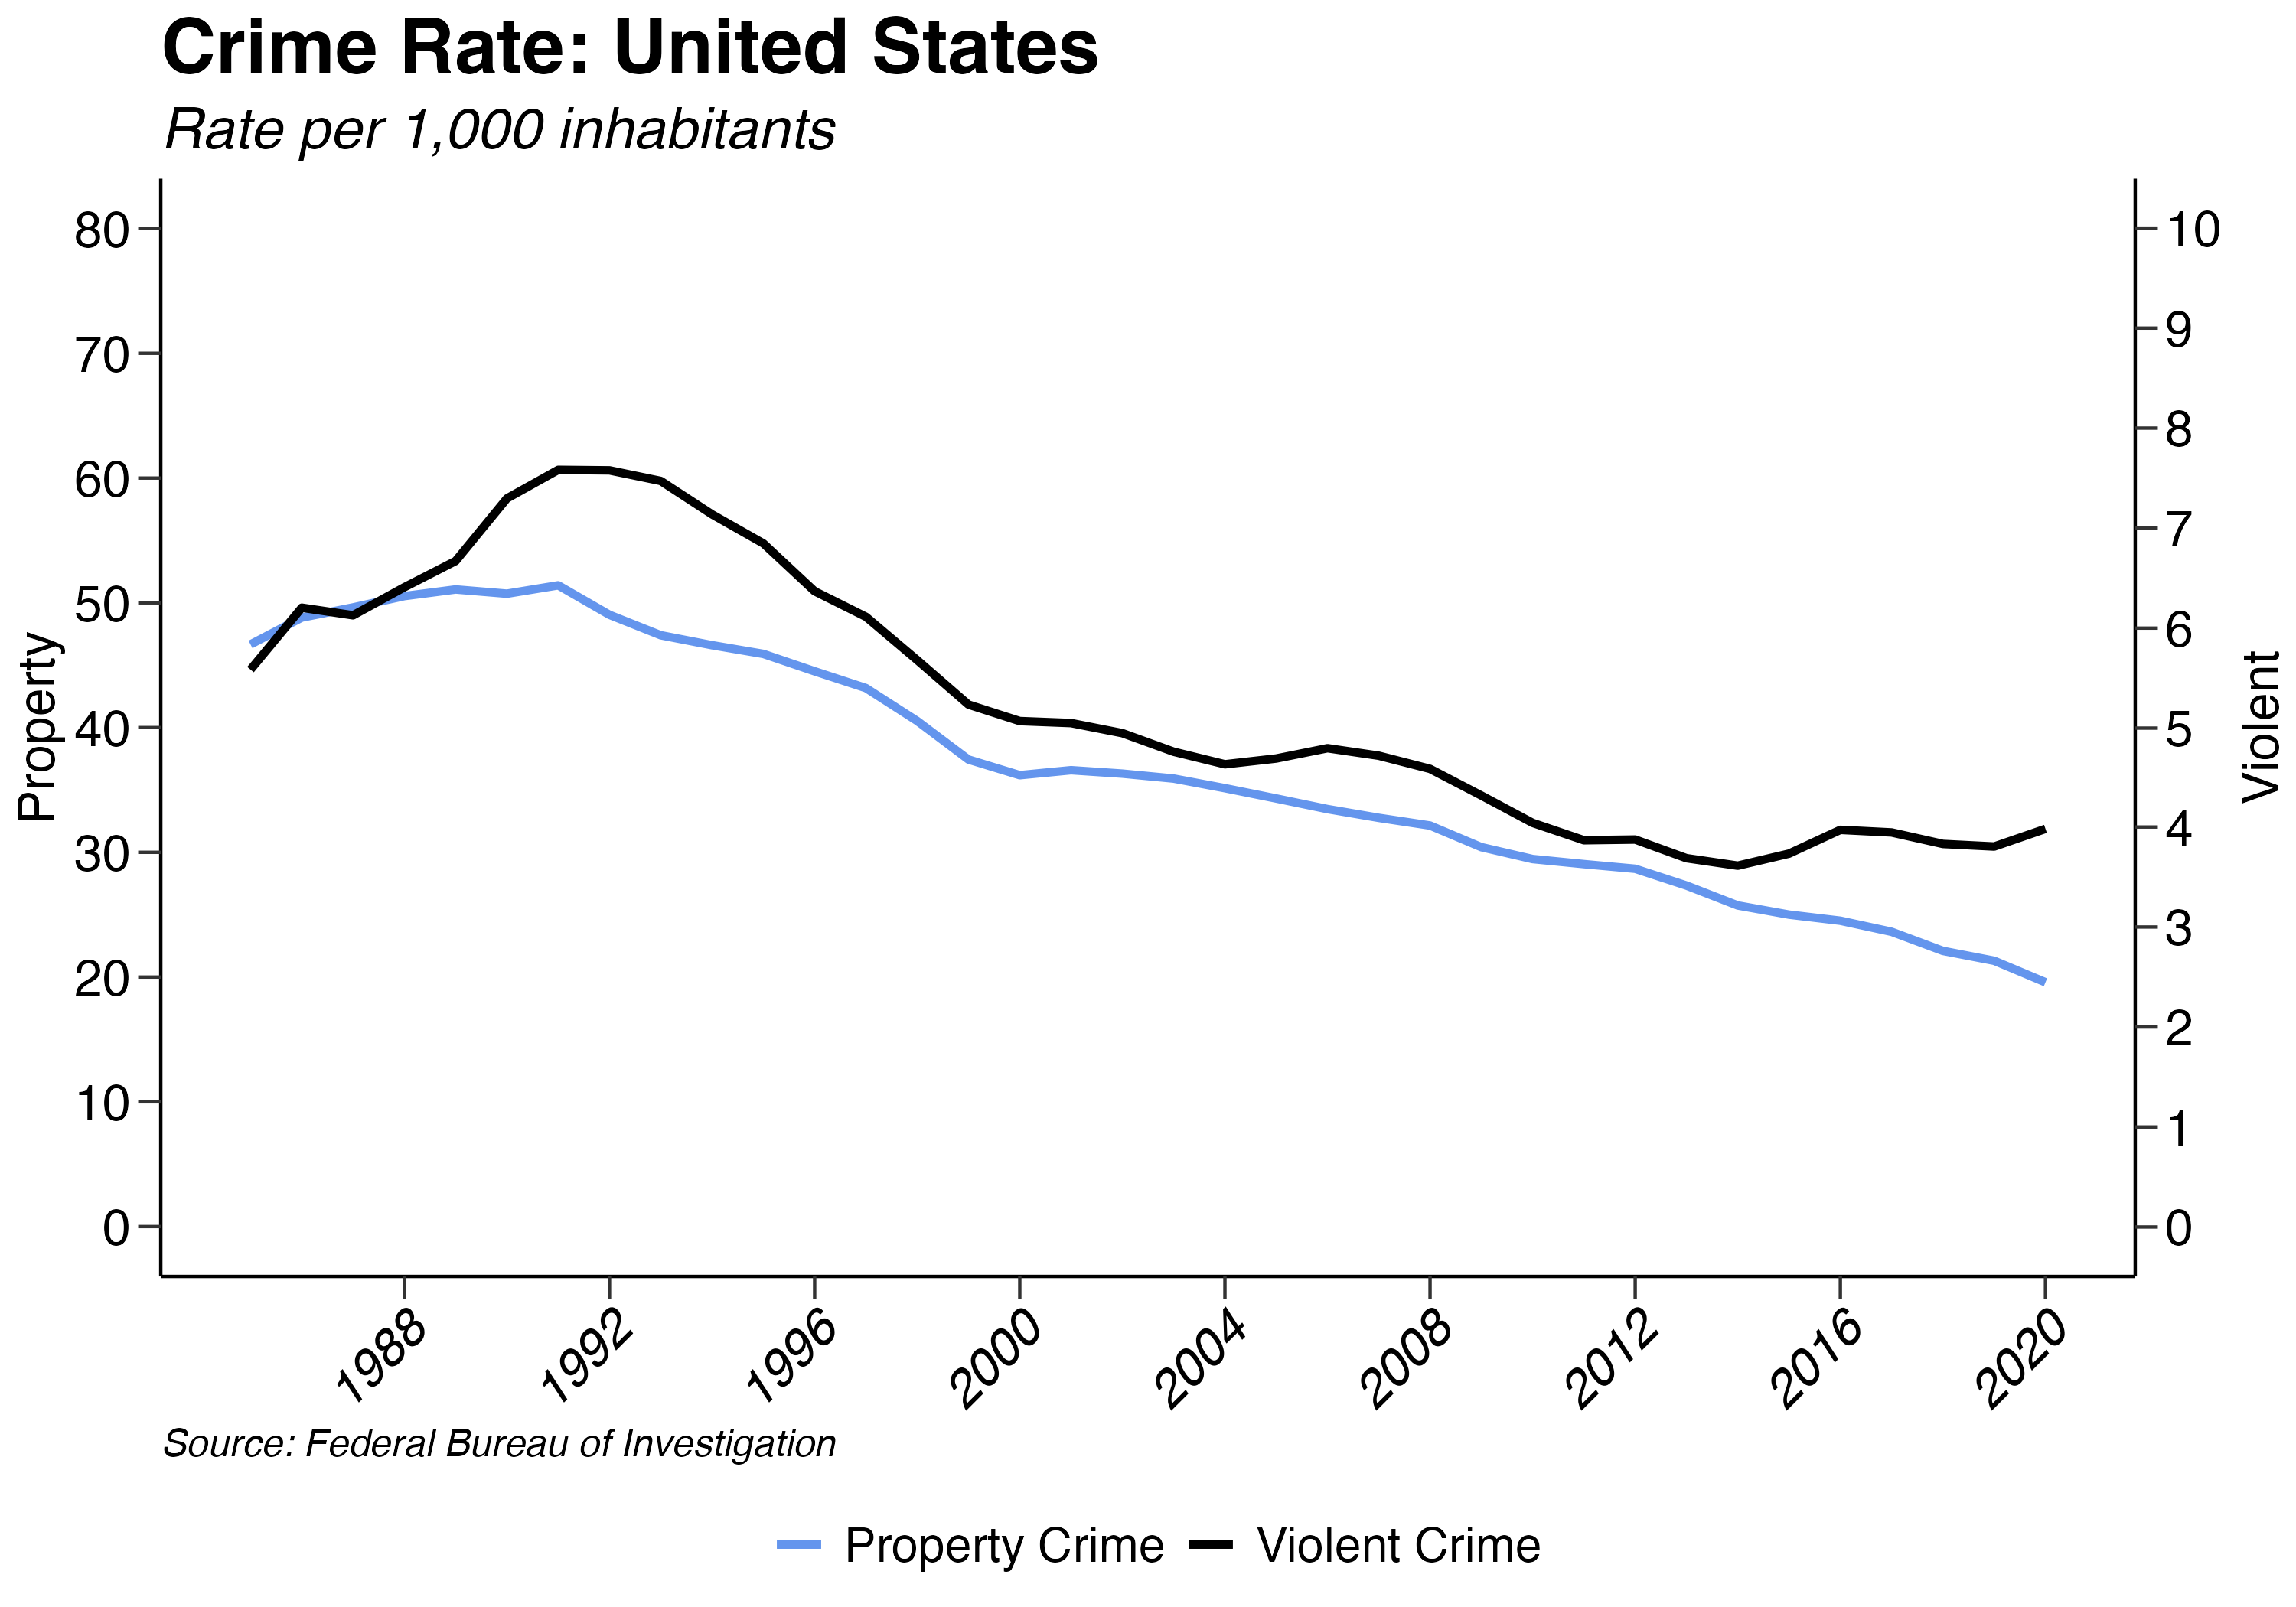
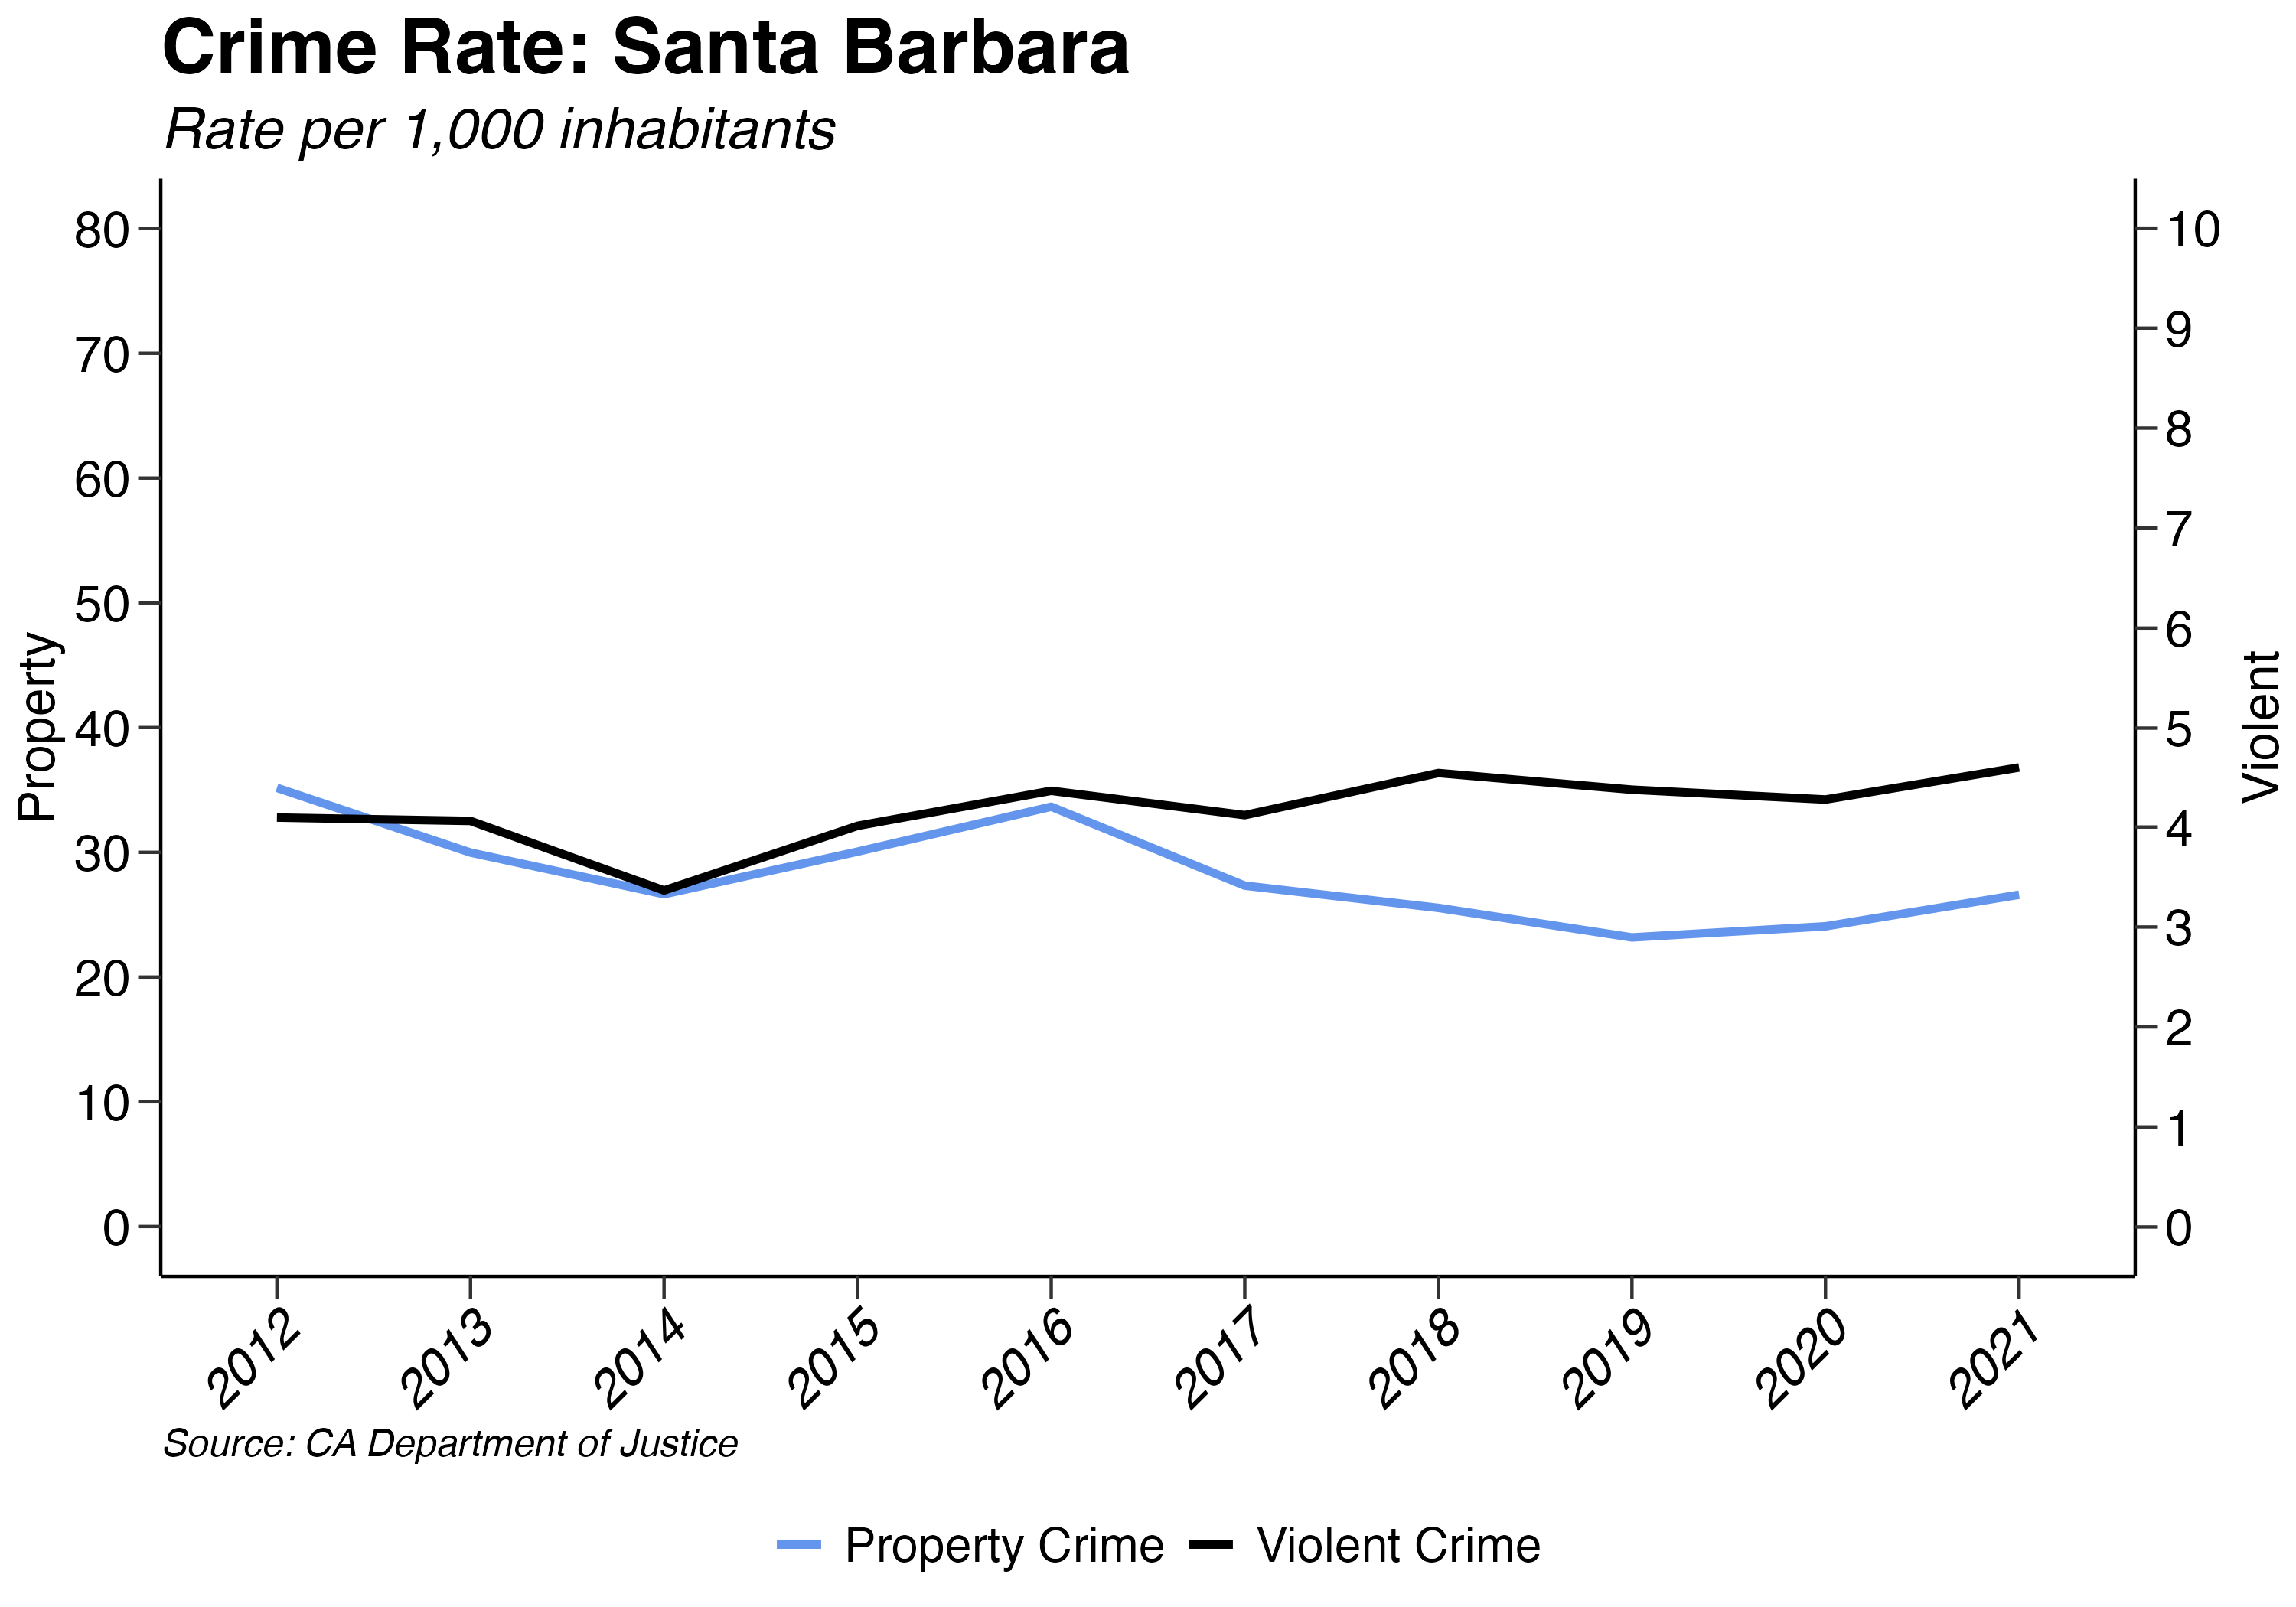
Over the past 10 years (2012-2021), both property and violent crime rates have declined county wide by -10.23% and -0.59%, respectively. Compared to the United States, Santa Barbara County had 1.96 greater property crimes per 1,000 persons in 2021, with property crime rates of 19.58 and 21.54, respectively. In terms of violent crime rates, the United States had 3.98 and Santa Barbara County 3.86 crimes per 1,000 persons in 2021. In what follows, we discuss these trends and further break down the composition of crime.
6.2.1 Property Crime
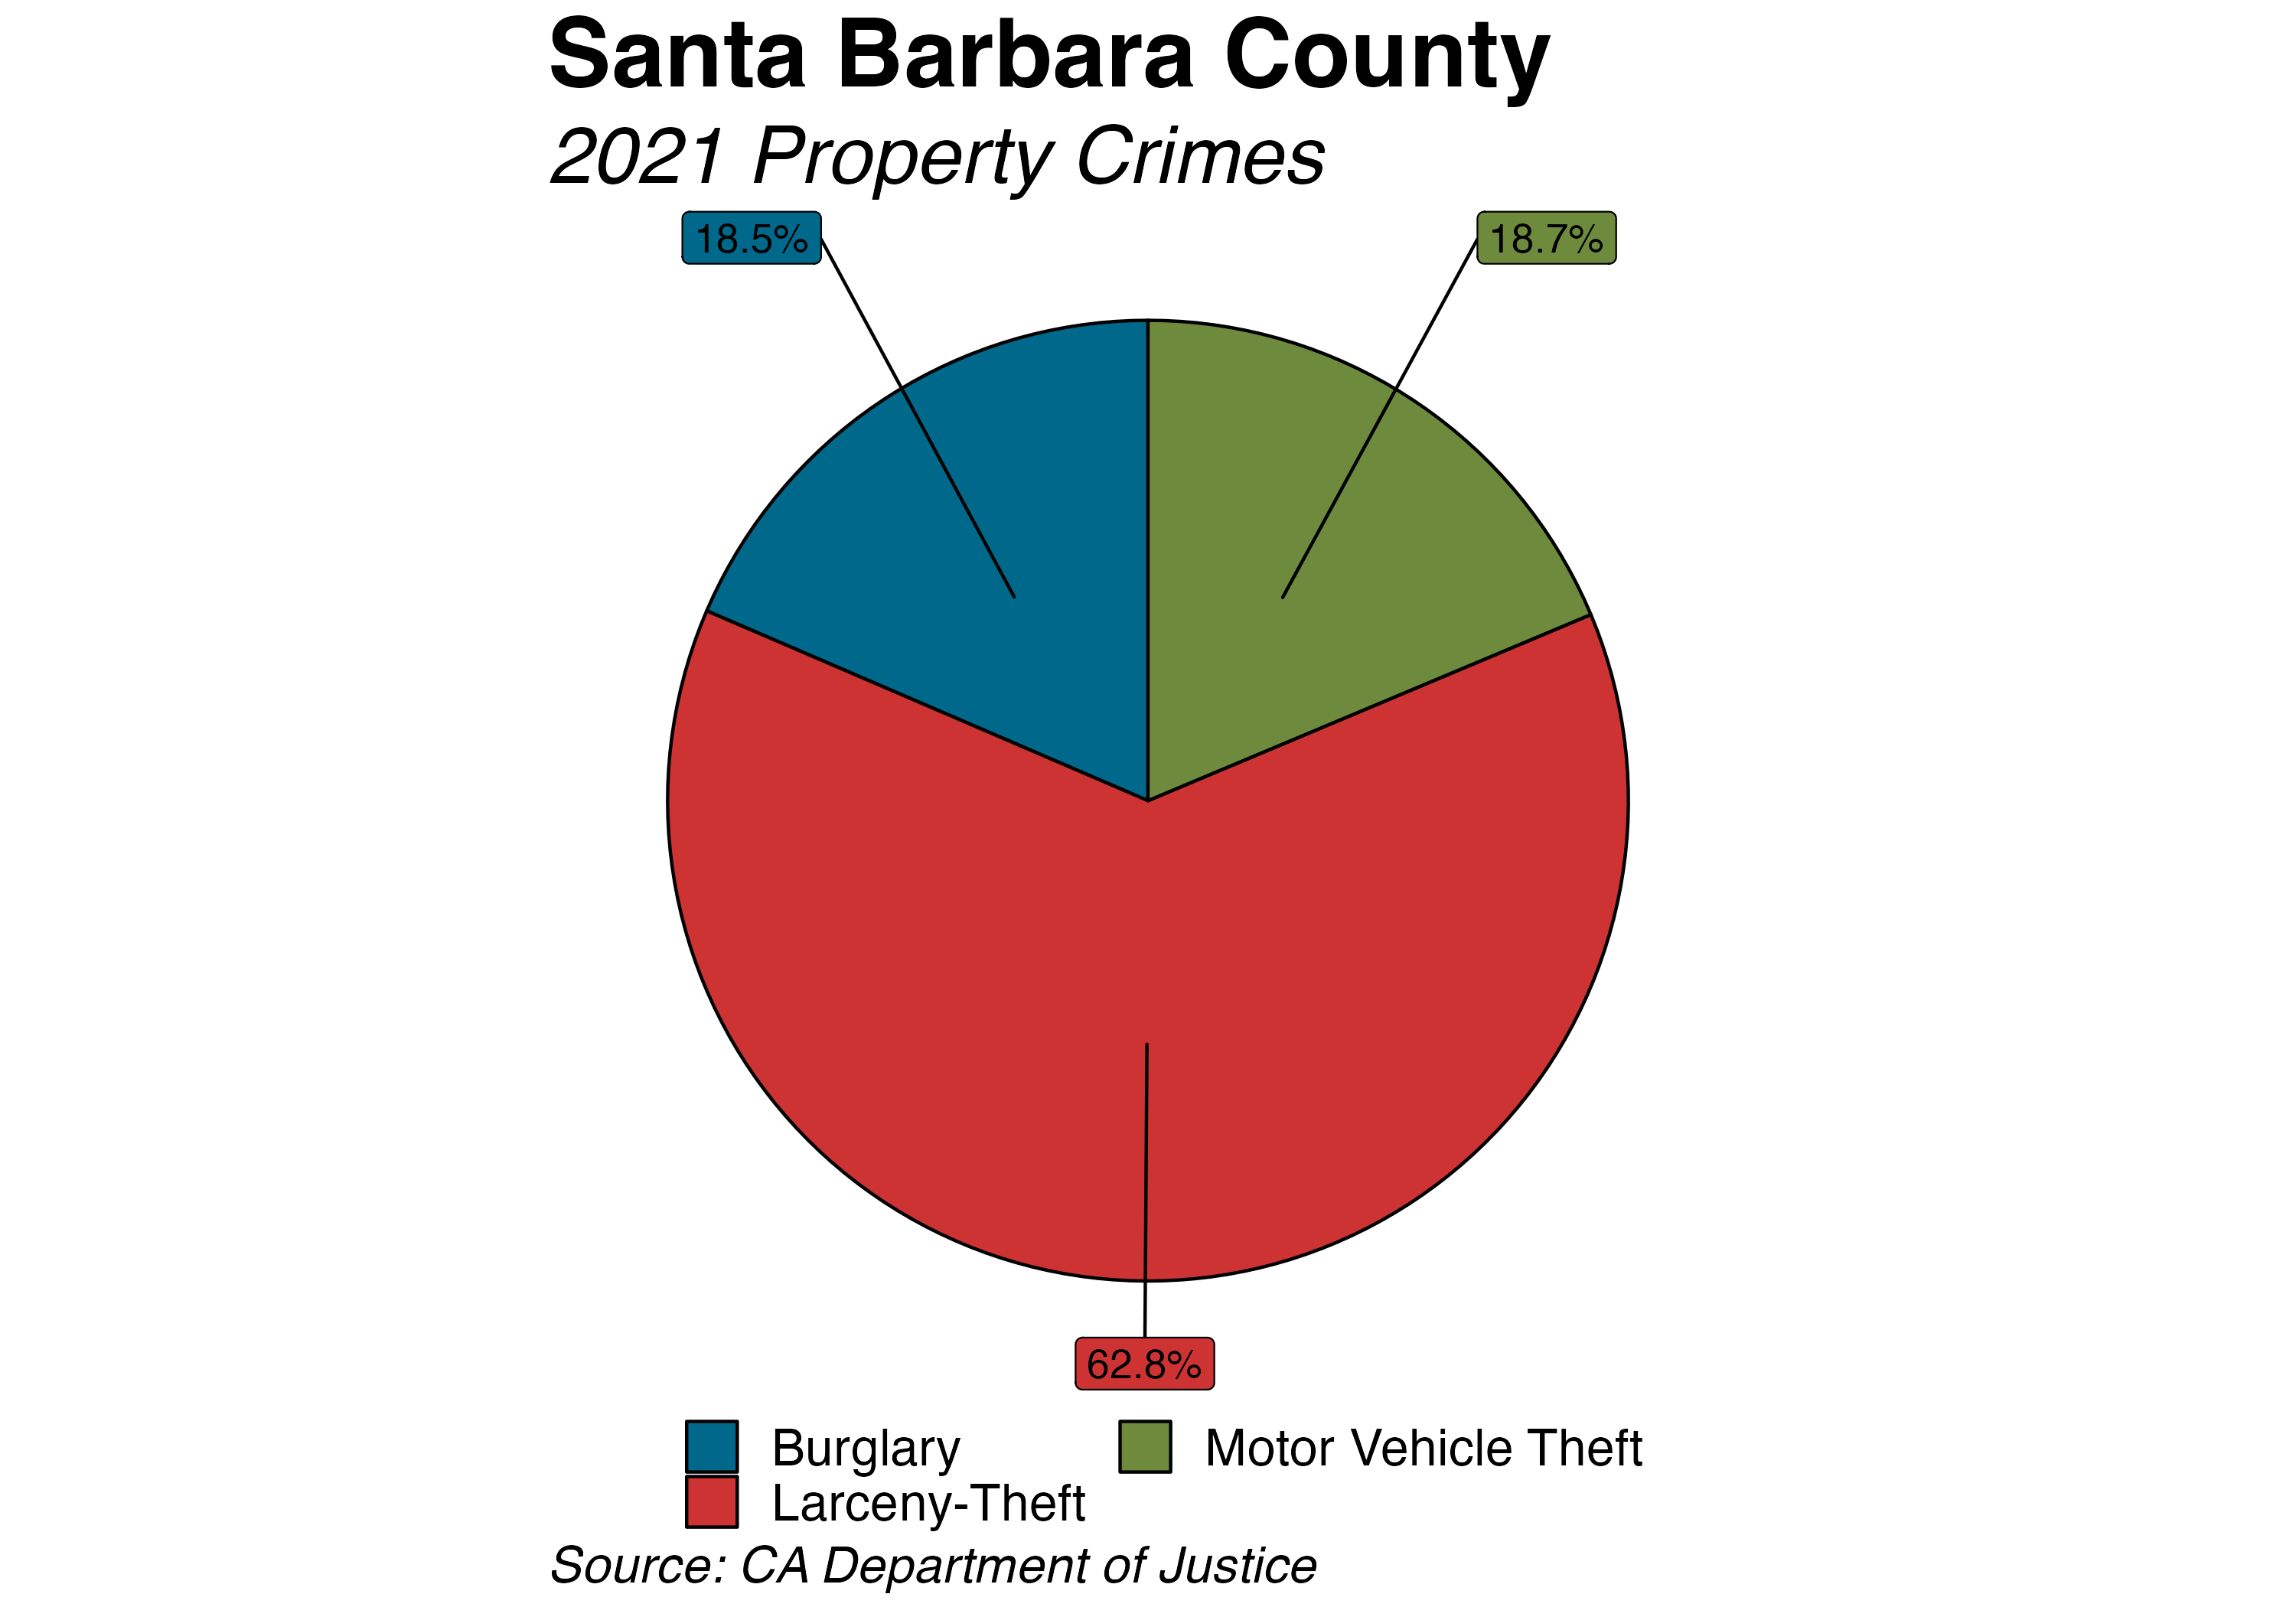
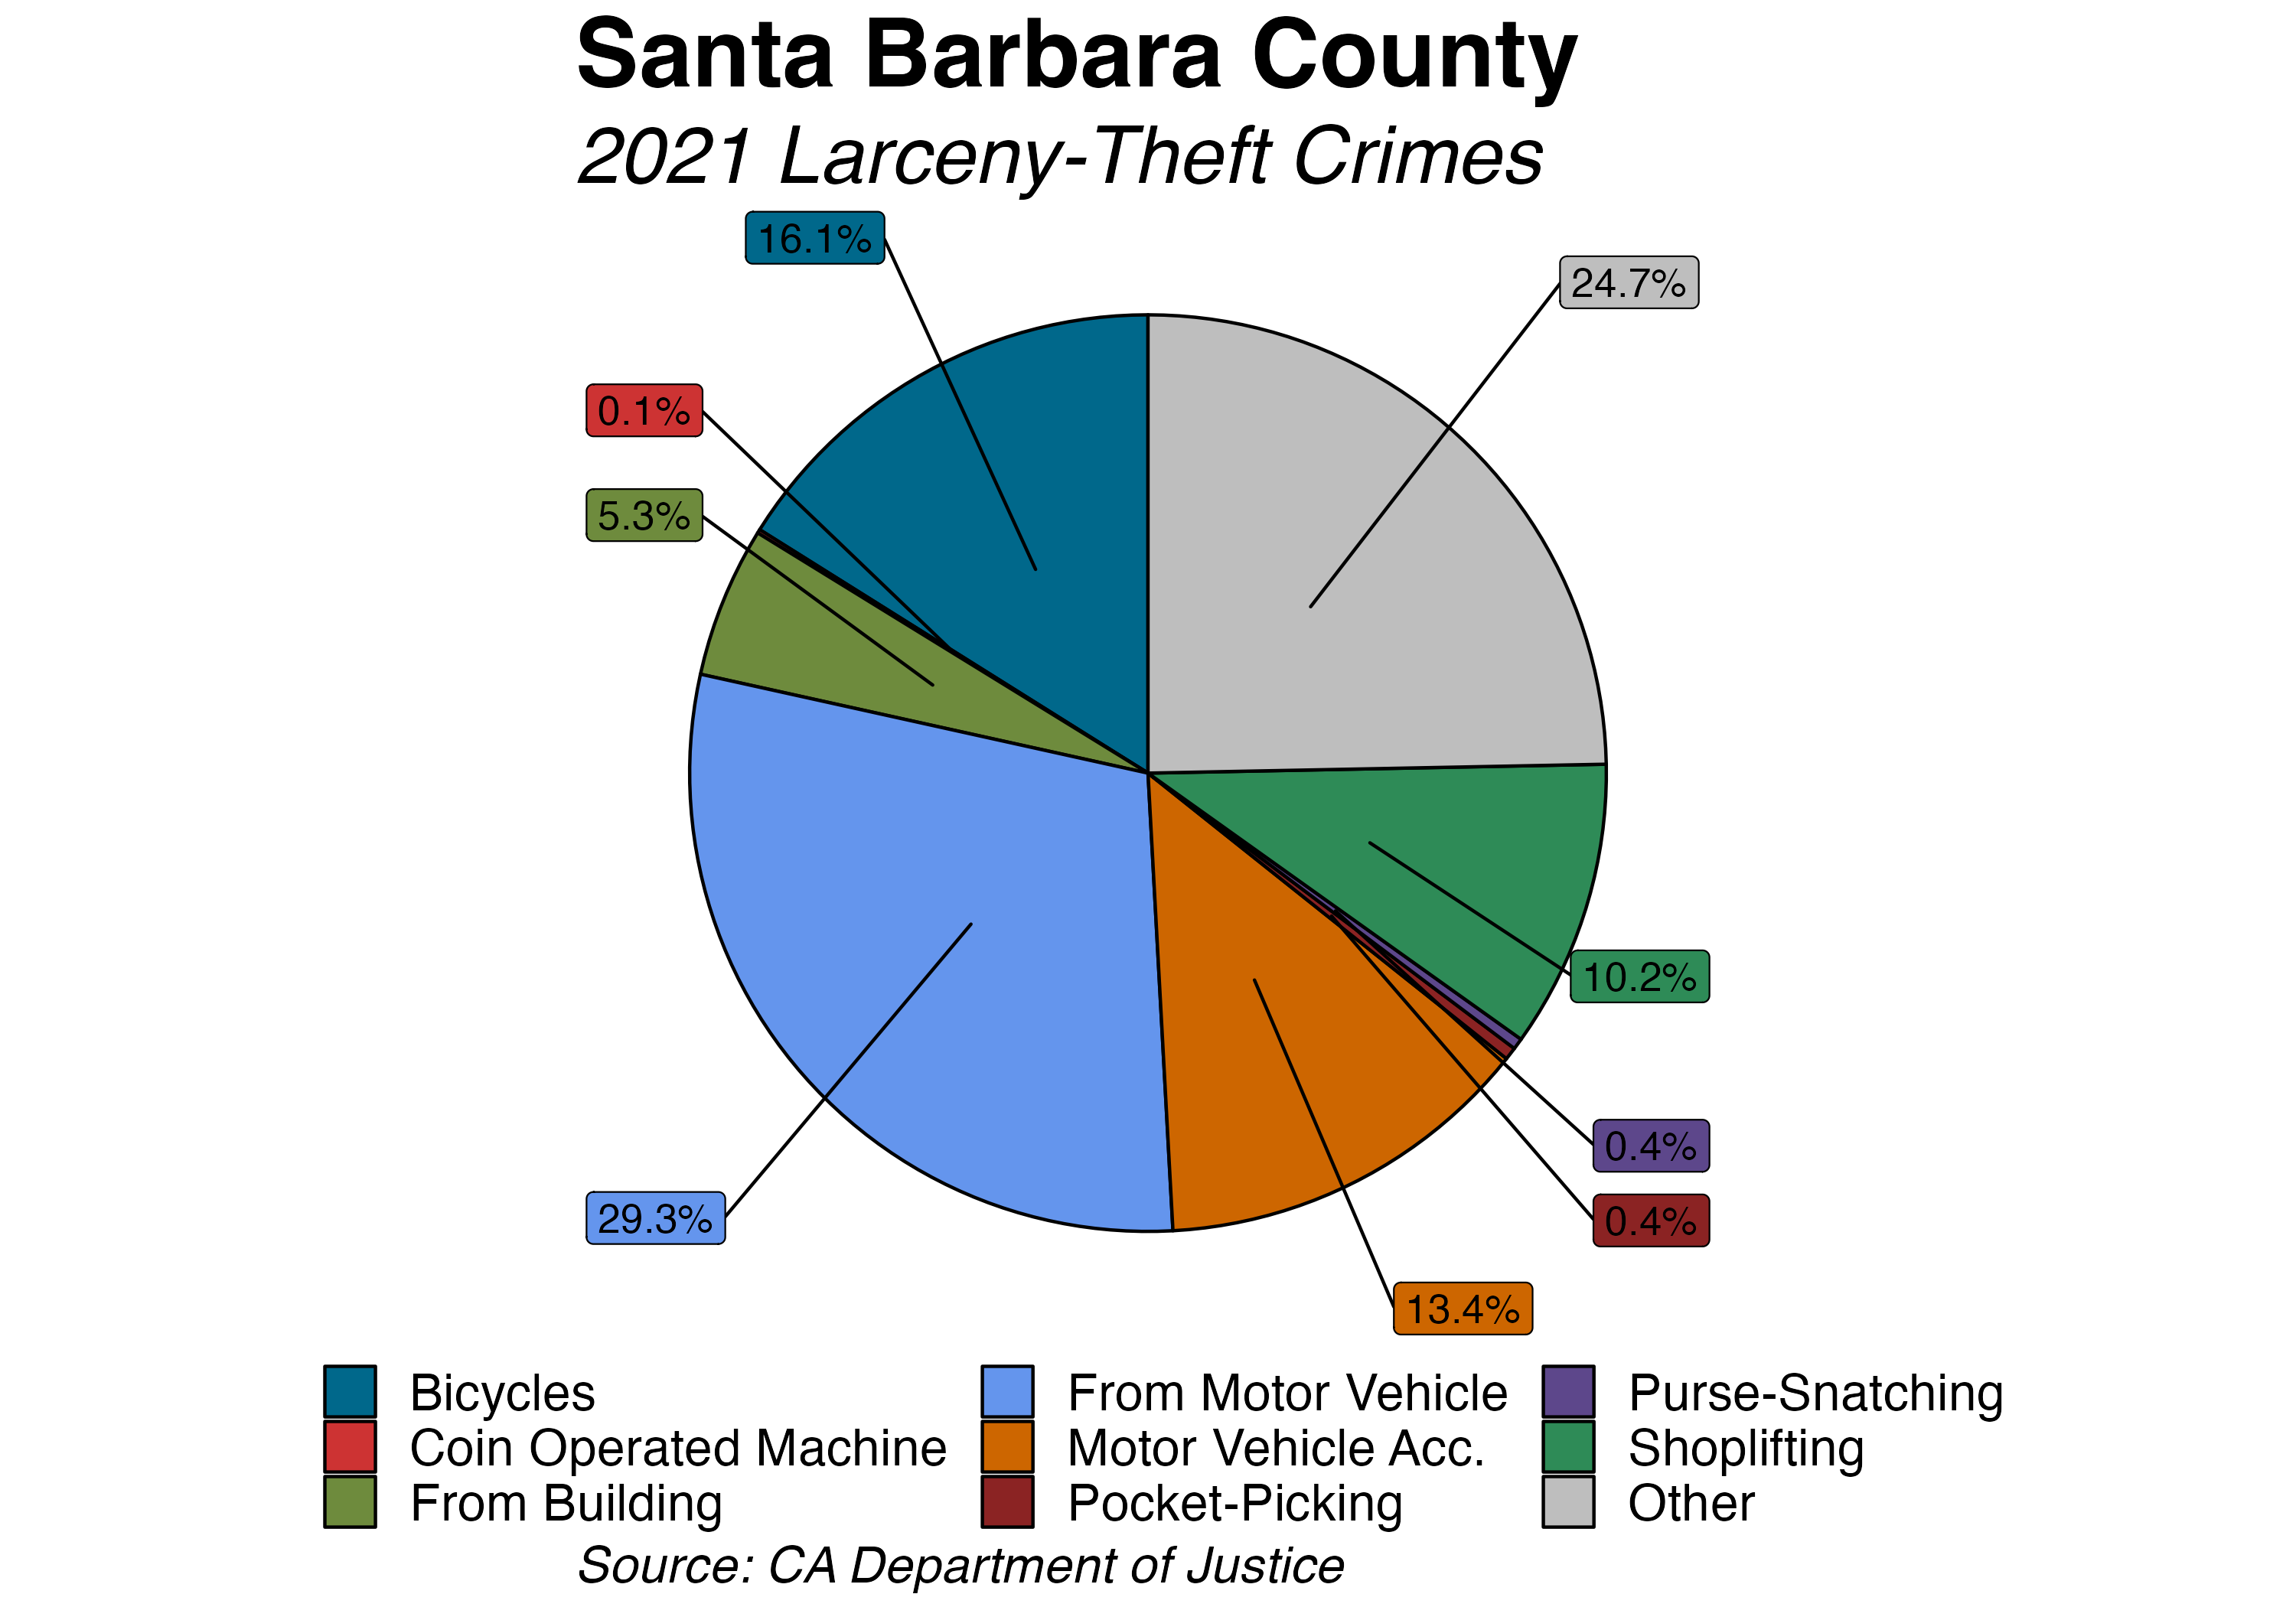
As defined by the California Department of Justice, property crime is divided into three separate categories: burglary, motor vehicle theft, and larceny-theft. Larceny-theft made up 62.8% of property crimes in 2021, totaling 6,055 crimes. The high percentage of this type of crime is most likely attributed to the ease with which individuals can steal and resell items, such as theft of motor vehicle parts, shoplifting, and bicycle theft. Motor vehicle theft, which totaled 1,800 and constituted 18.67% of the all property crime, is the second most perpetrated type. Burglary made up the smallest category at 18.53%.
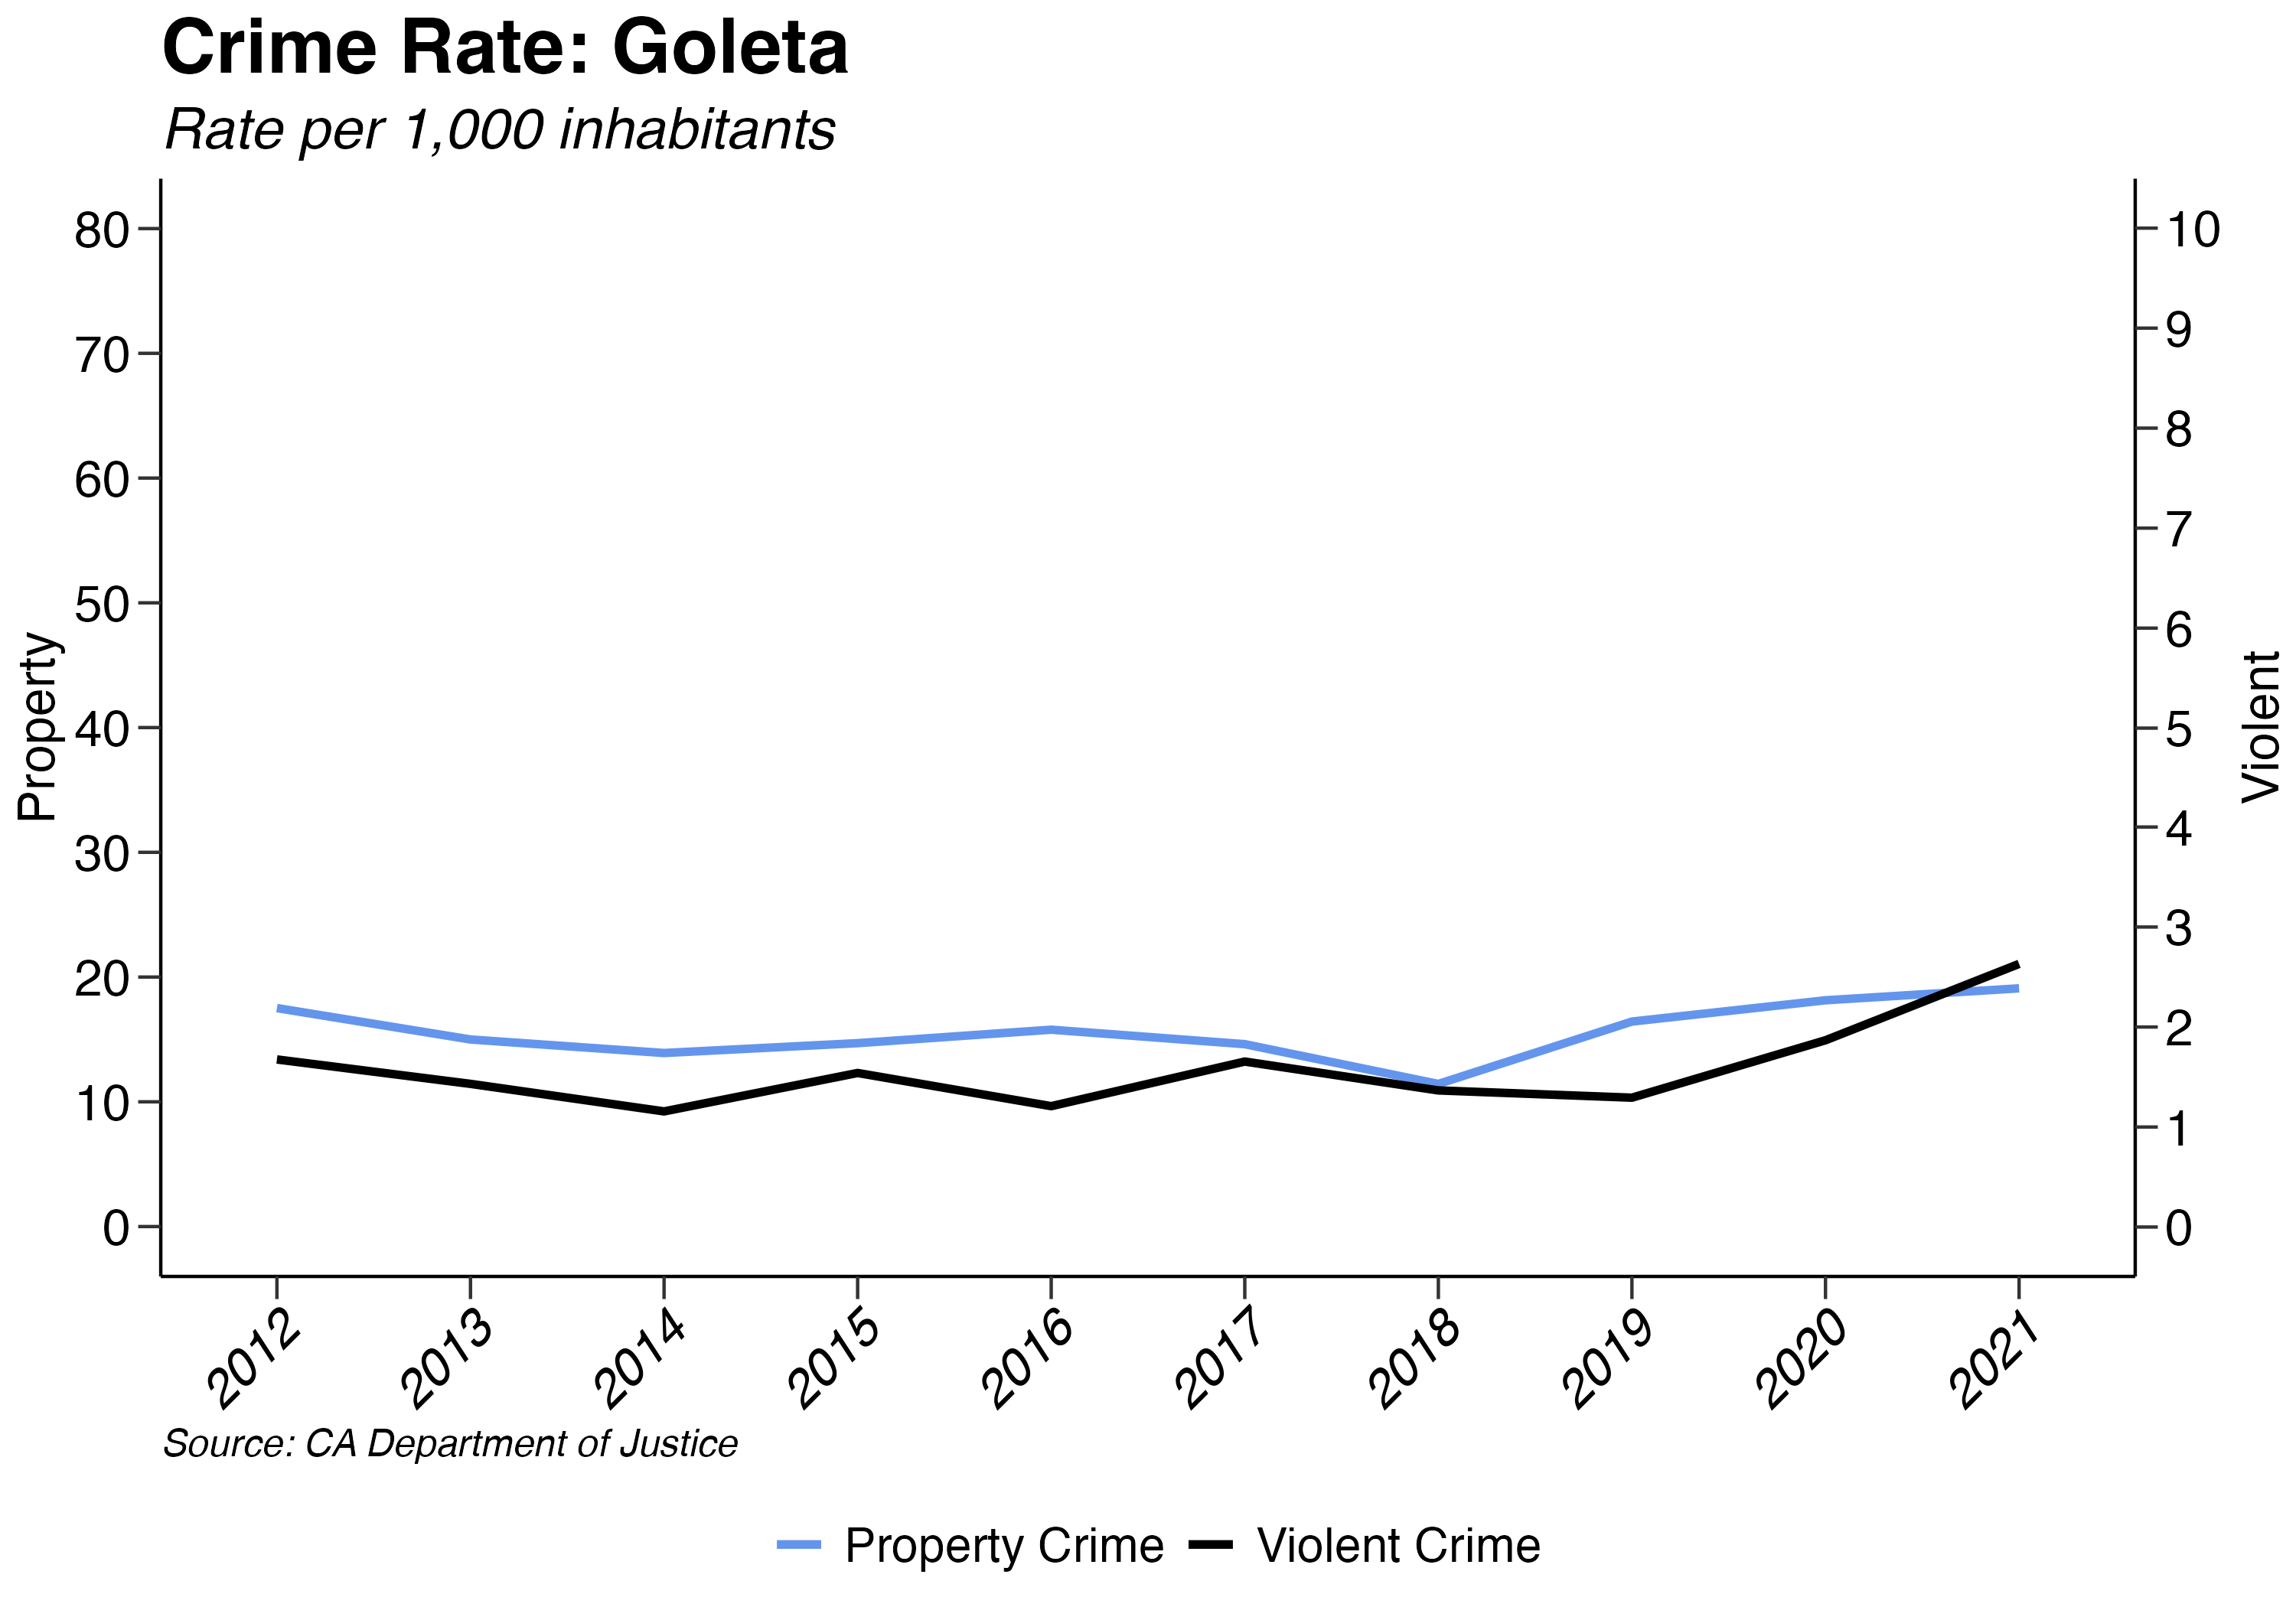
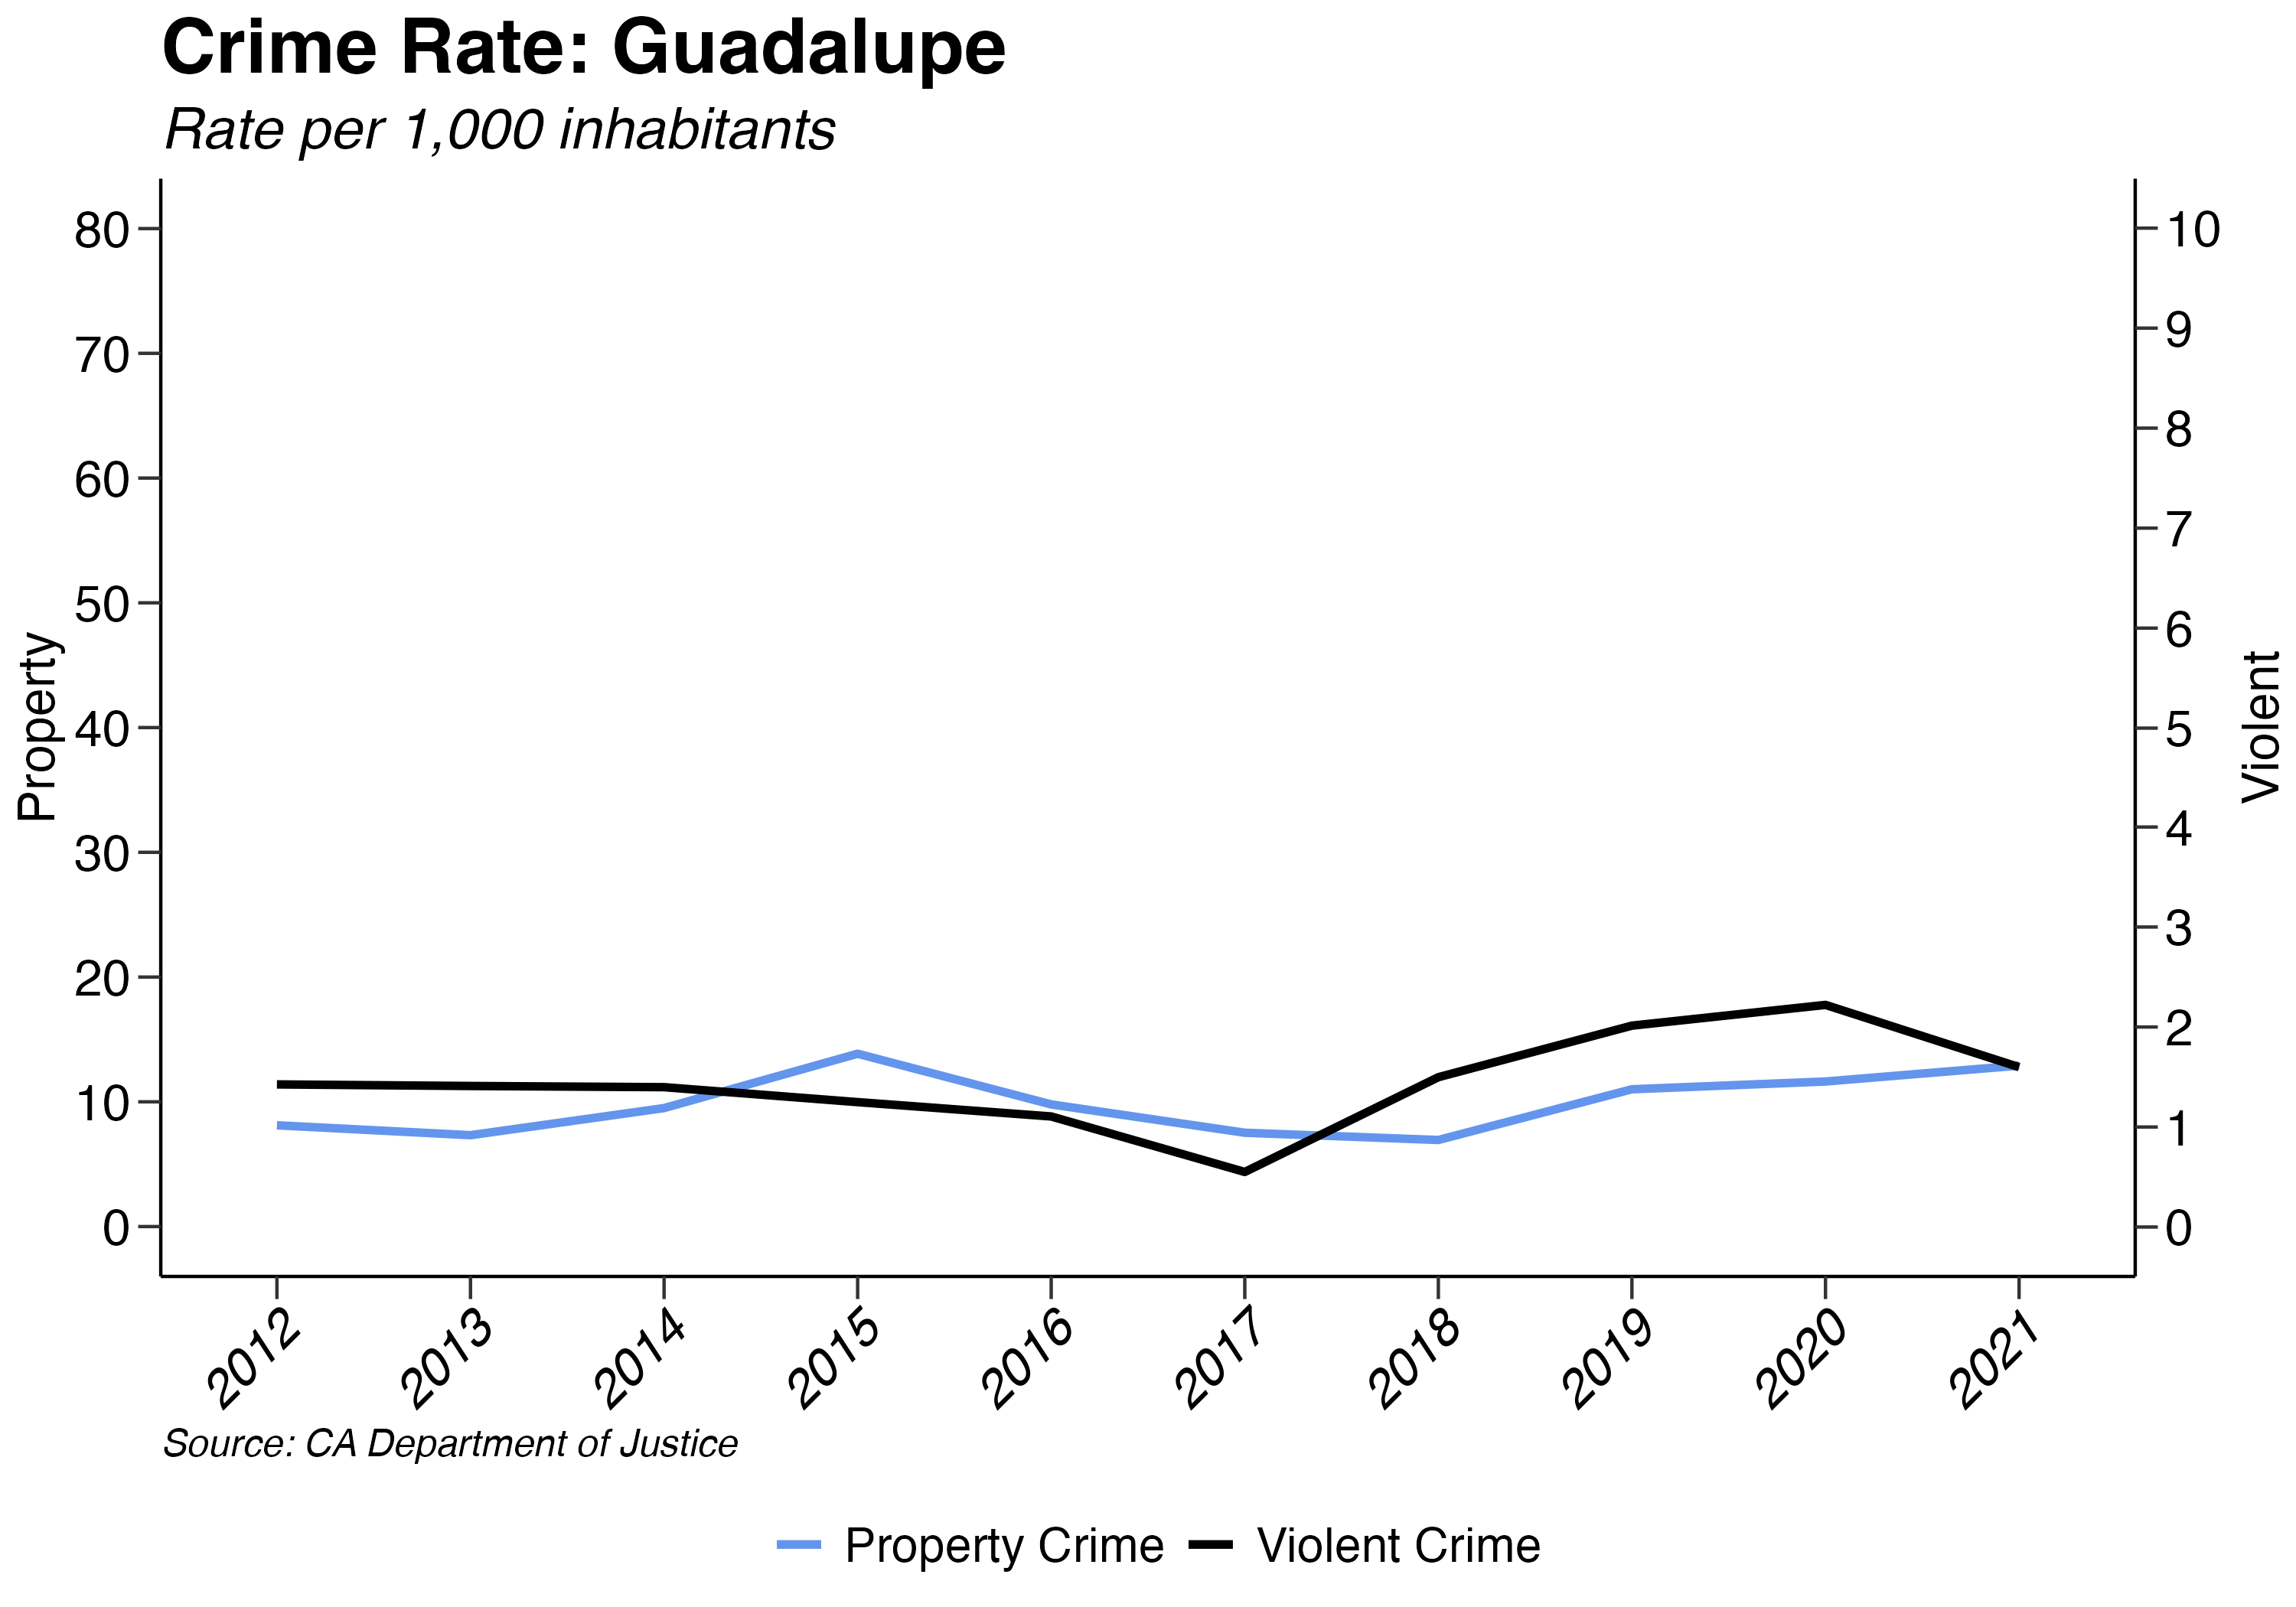
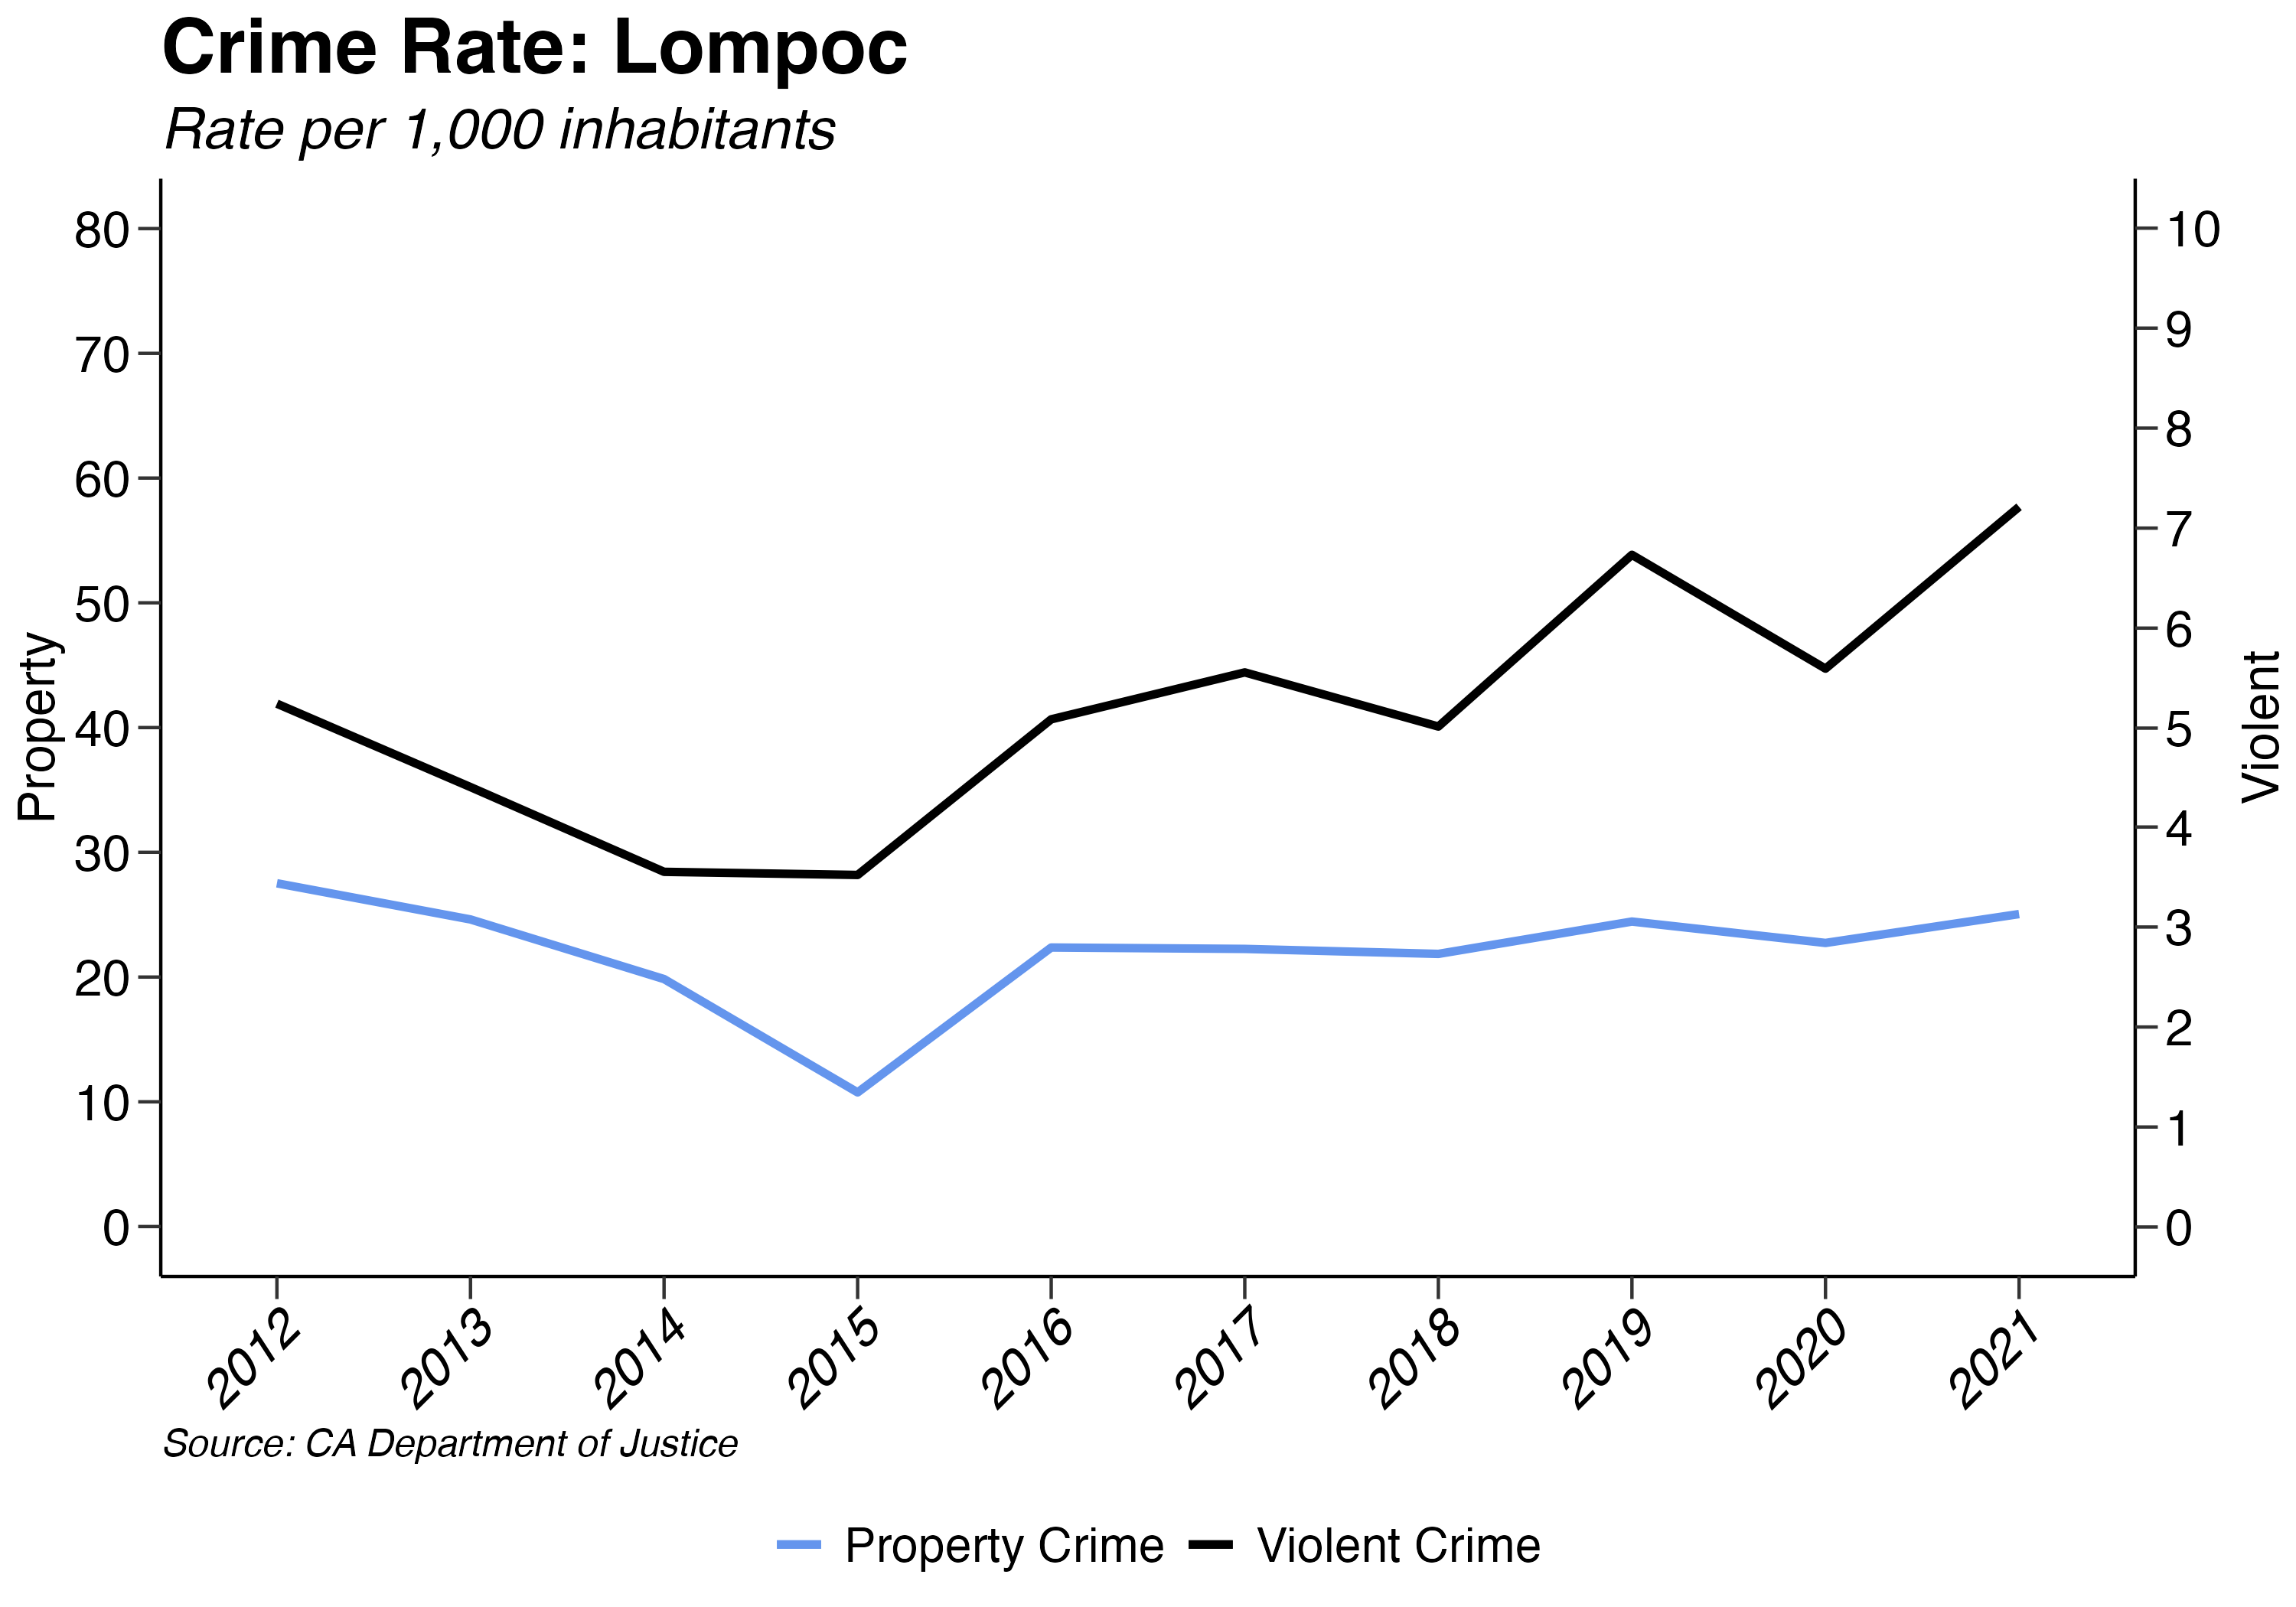
Santa Barbara County’s property crime rates increased by 8.56% in 2021, continuing an upward trend. Lompoc had the largest decrease, with property crimes falling by -6.49%. Guadalupe maintained the lowest property crime rate at 12.9 and Buellton the highest property crime rate at 27.12 in the county in 2021.
6.2.2 Violent Crime
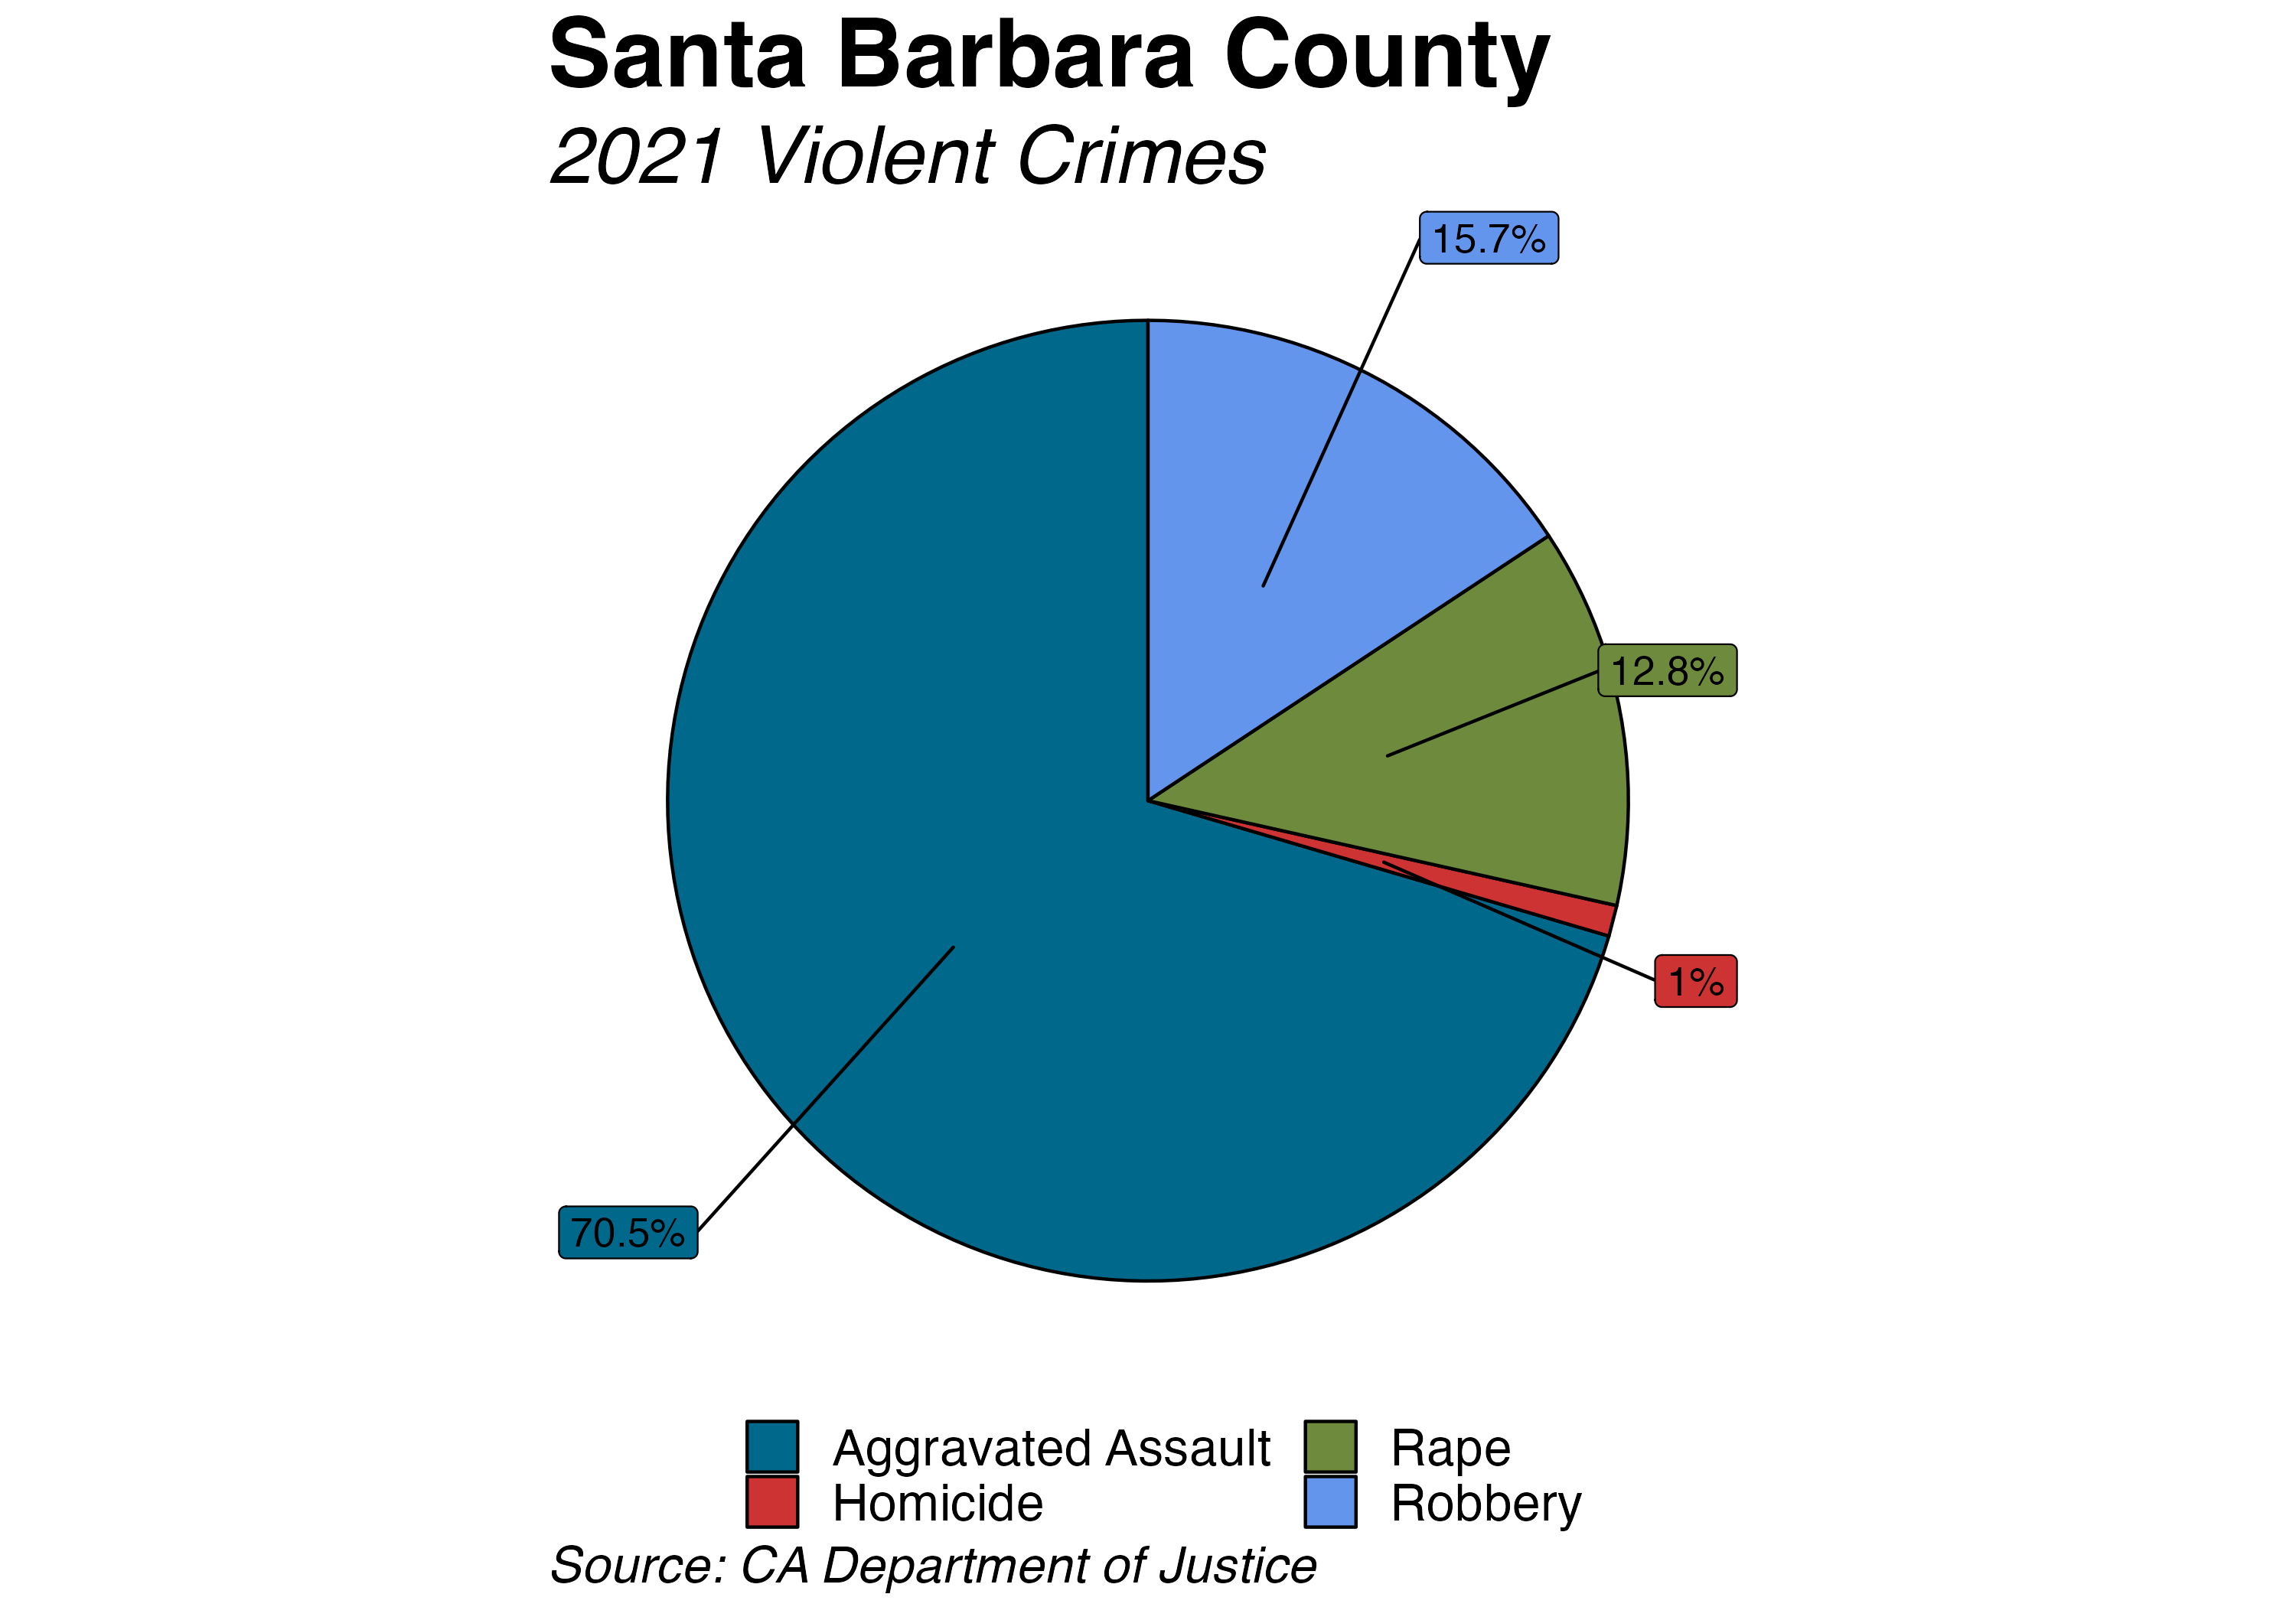
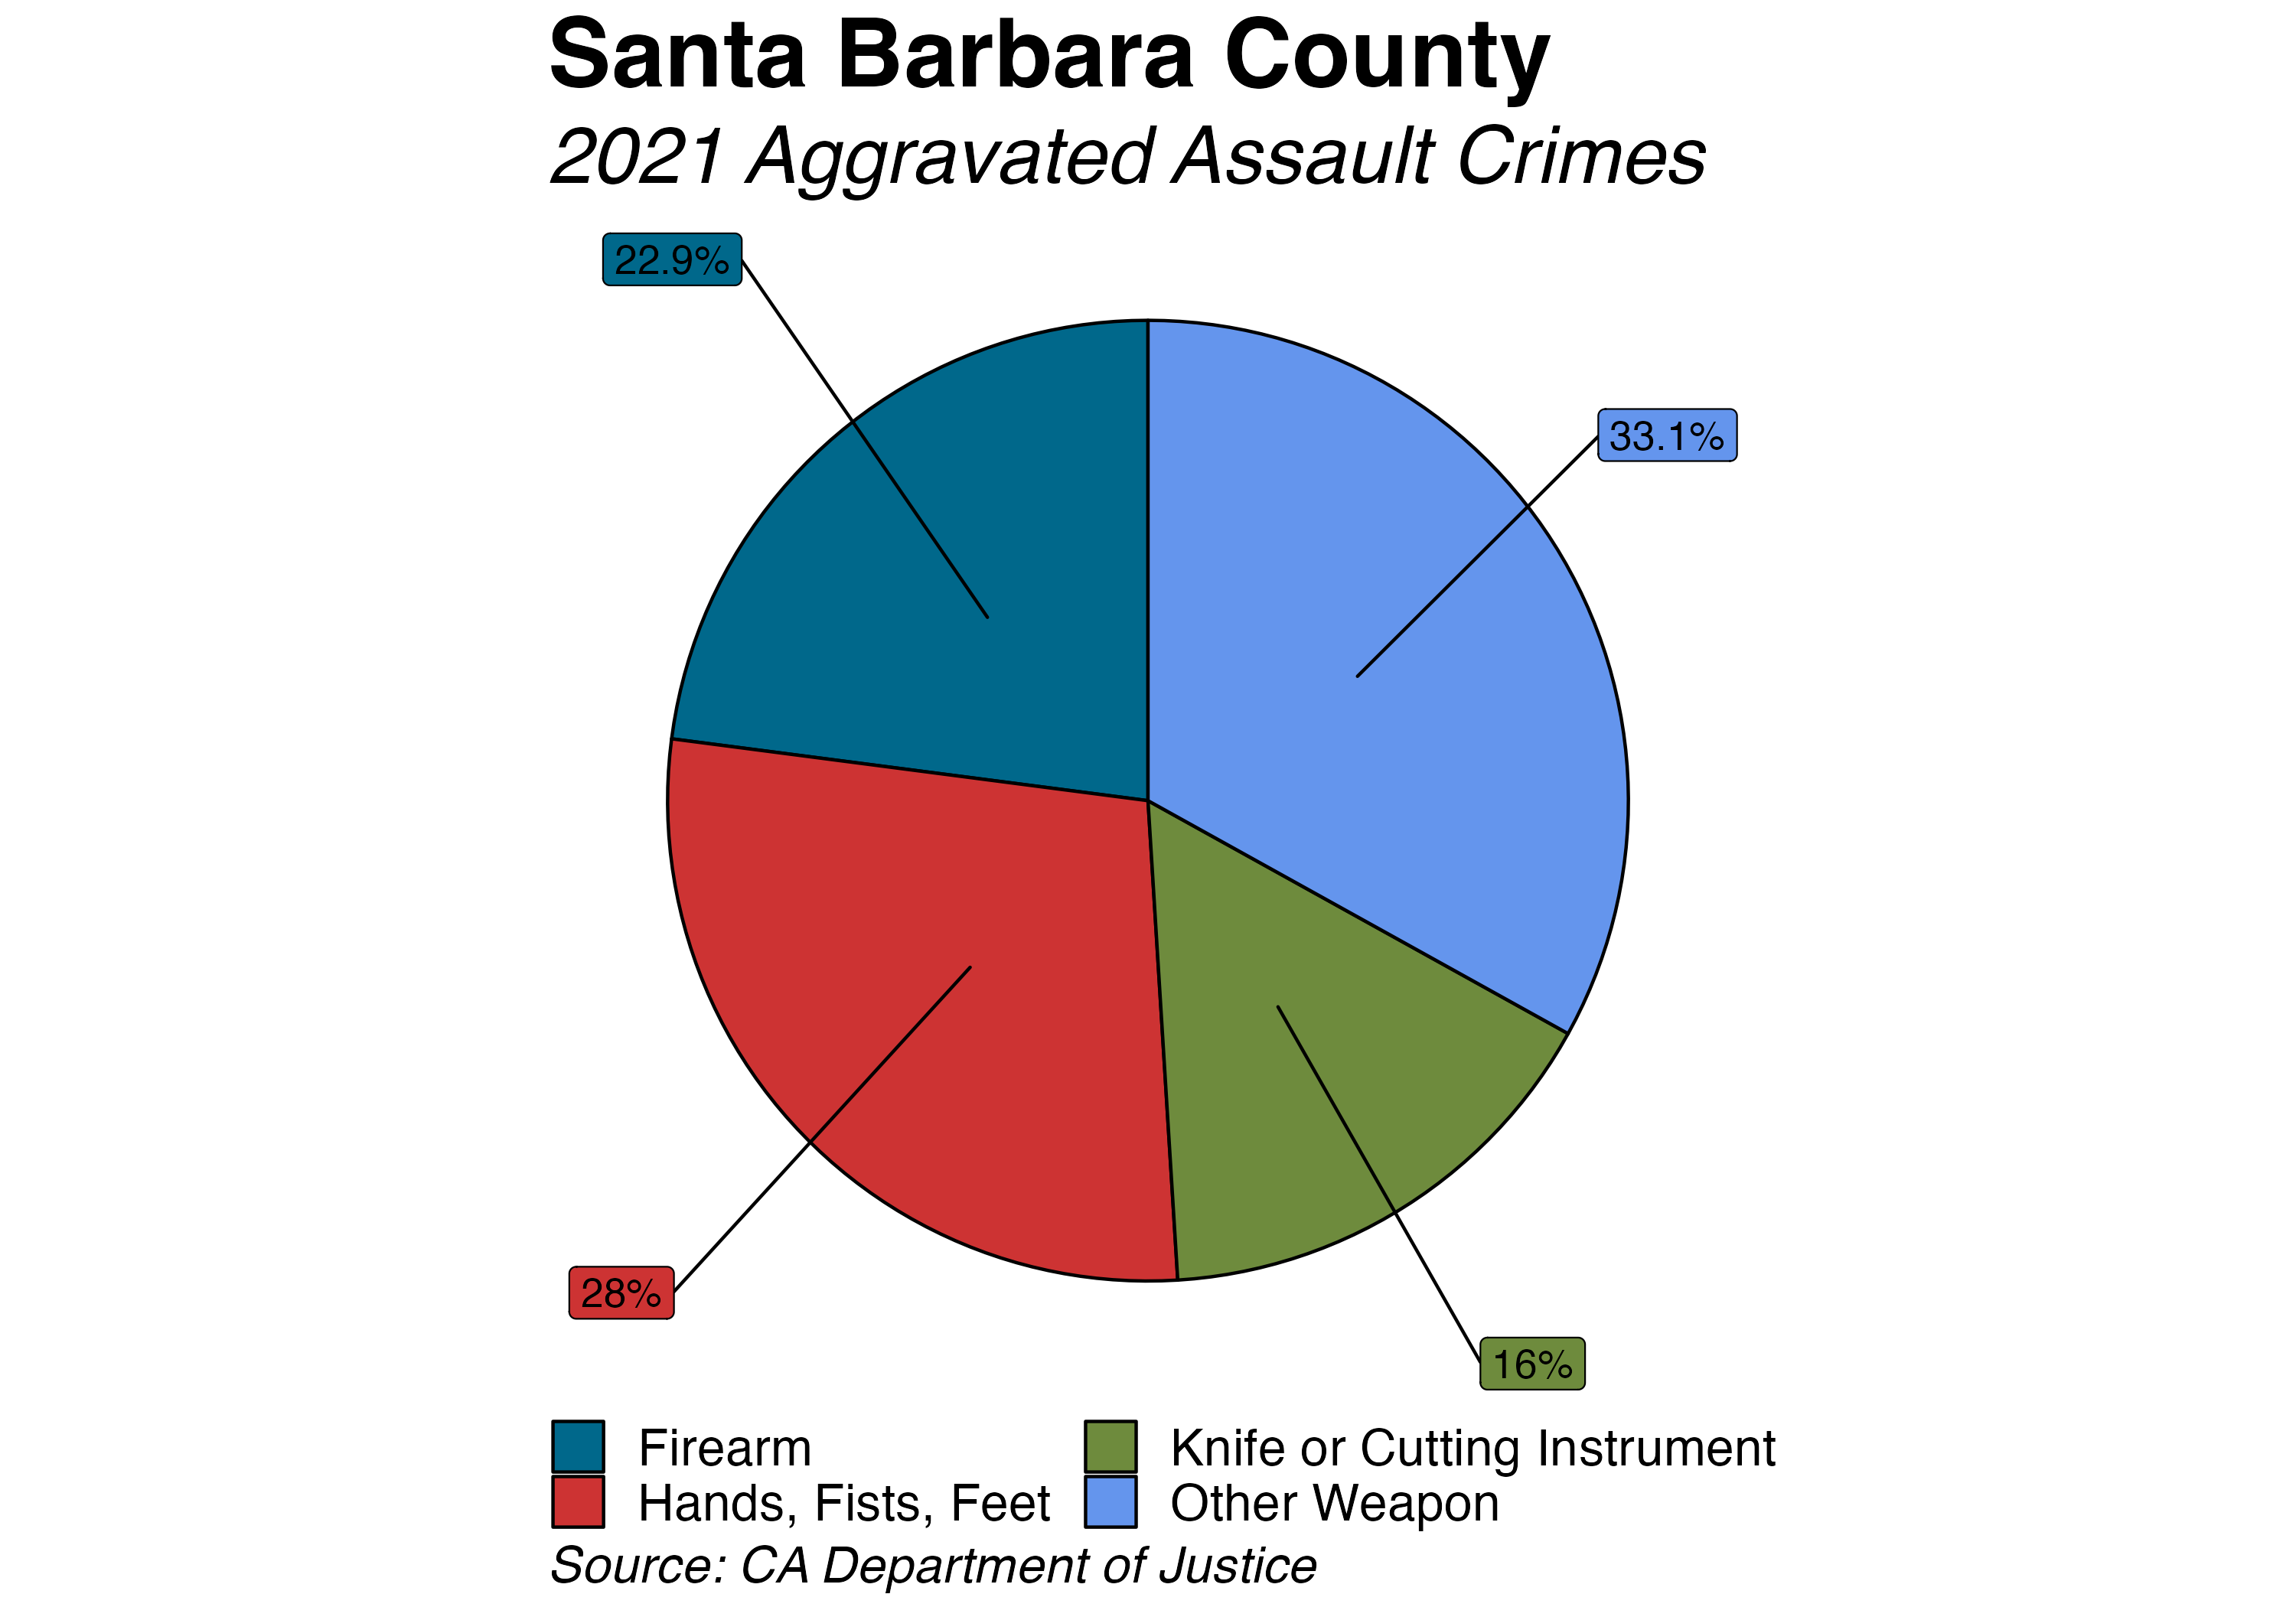
Violent crime is separated into four sections: aggravated assault, homicide, rape, and robbery. Aggravated assault made up 70.45% of violent crimes in Santa Barbara County in 2021, totaling 1,216 and thereby making it the largest category of violent crimes within the county. Robbery made up the smallest fraction of violent crimes at 15.7%, with just 271 counts. Homicide and rape made up the second and third largest categories of violent crimes, respectively. In total, the number of violent crimes per 1,000 persons in Santa Barbara County decreased from 4.1 in 2020 to 3.86 in 2021.
Goleta had the largest increase, with violent crimes rising by 40.99%. Solvang maintained the lowest violent crime rate at 1.49 and Lompoc maintained the highest violent crime rate in the county at 7.21 in 2021.
6.3 Education
Key Points:
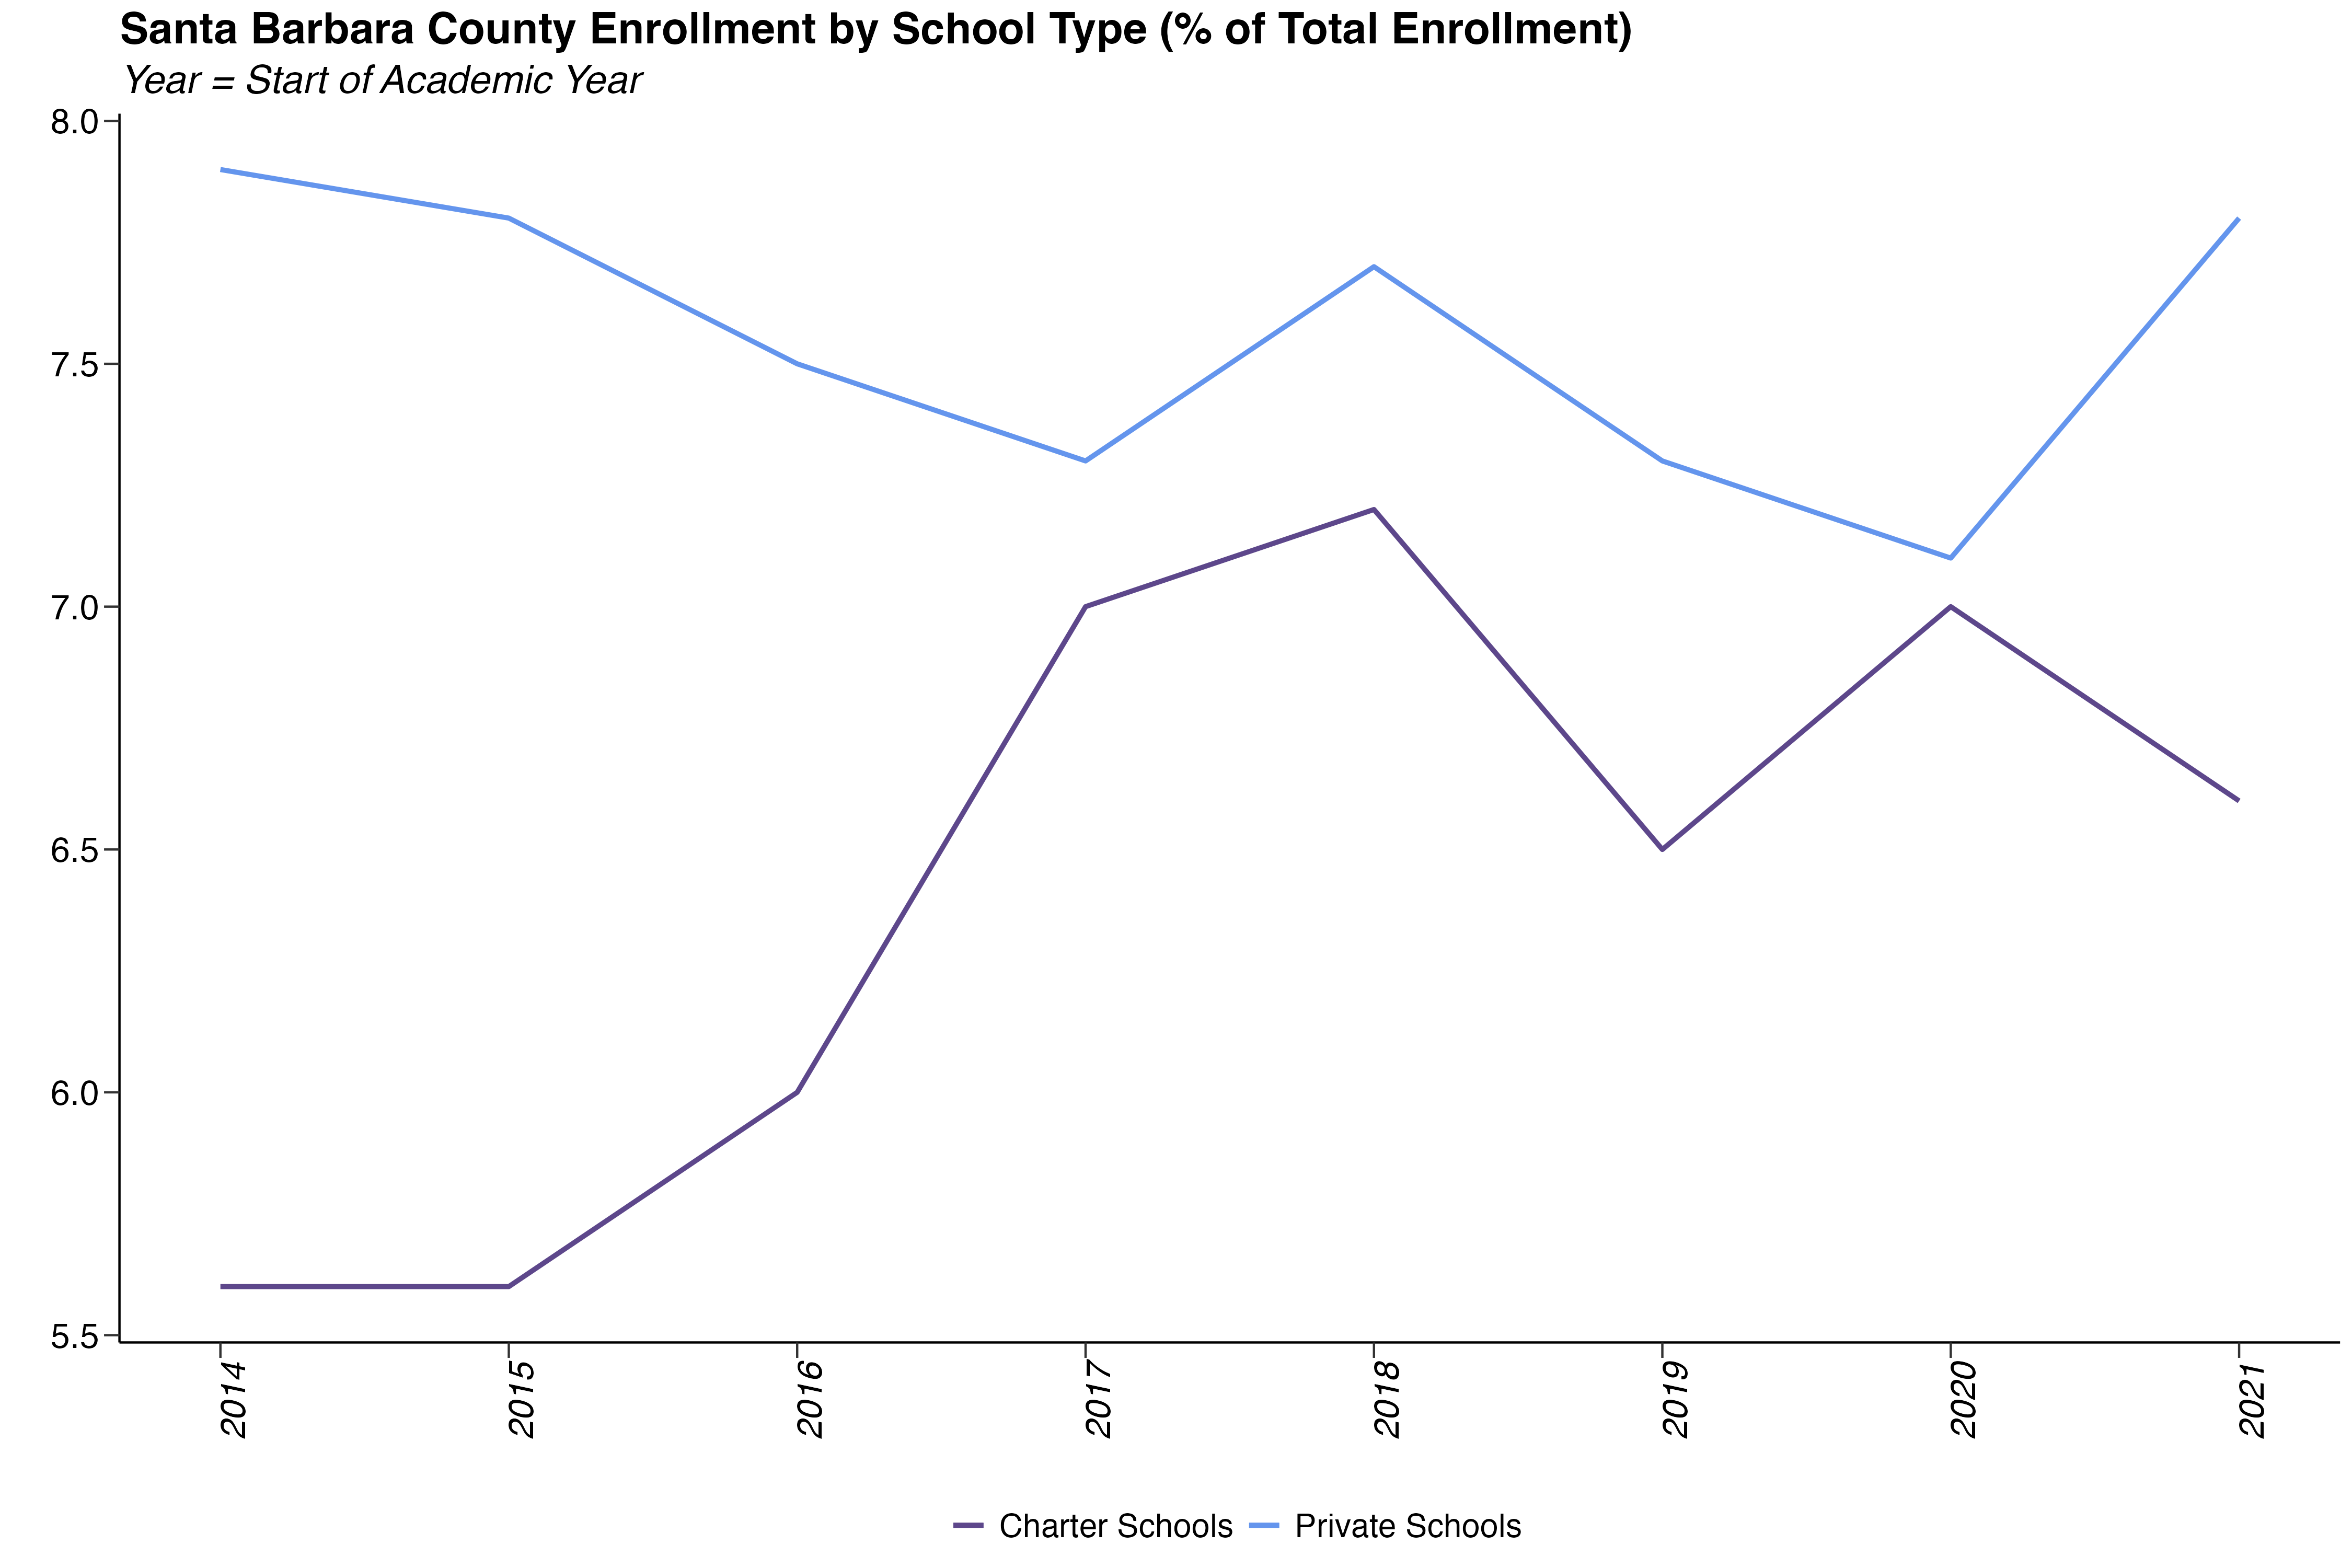
- Charter school enrollment in Santa Barbara County, which had been growing for several years, is higher now than in 2018-2019.
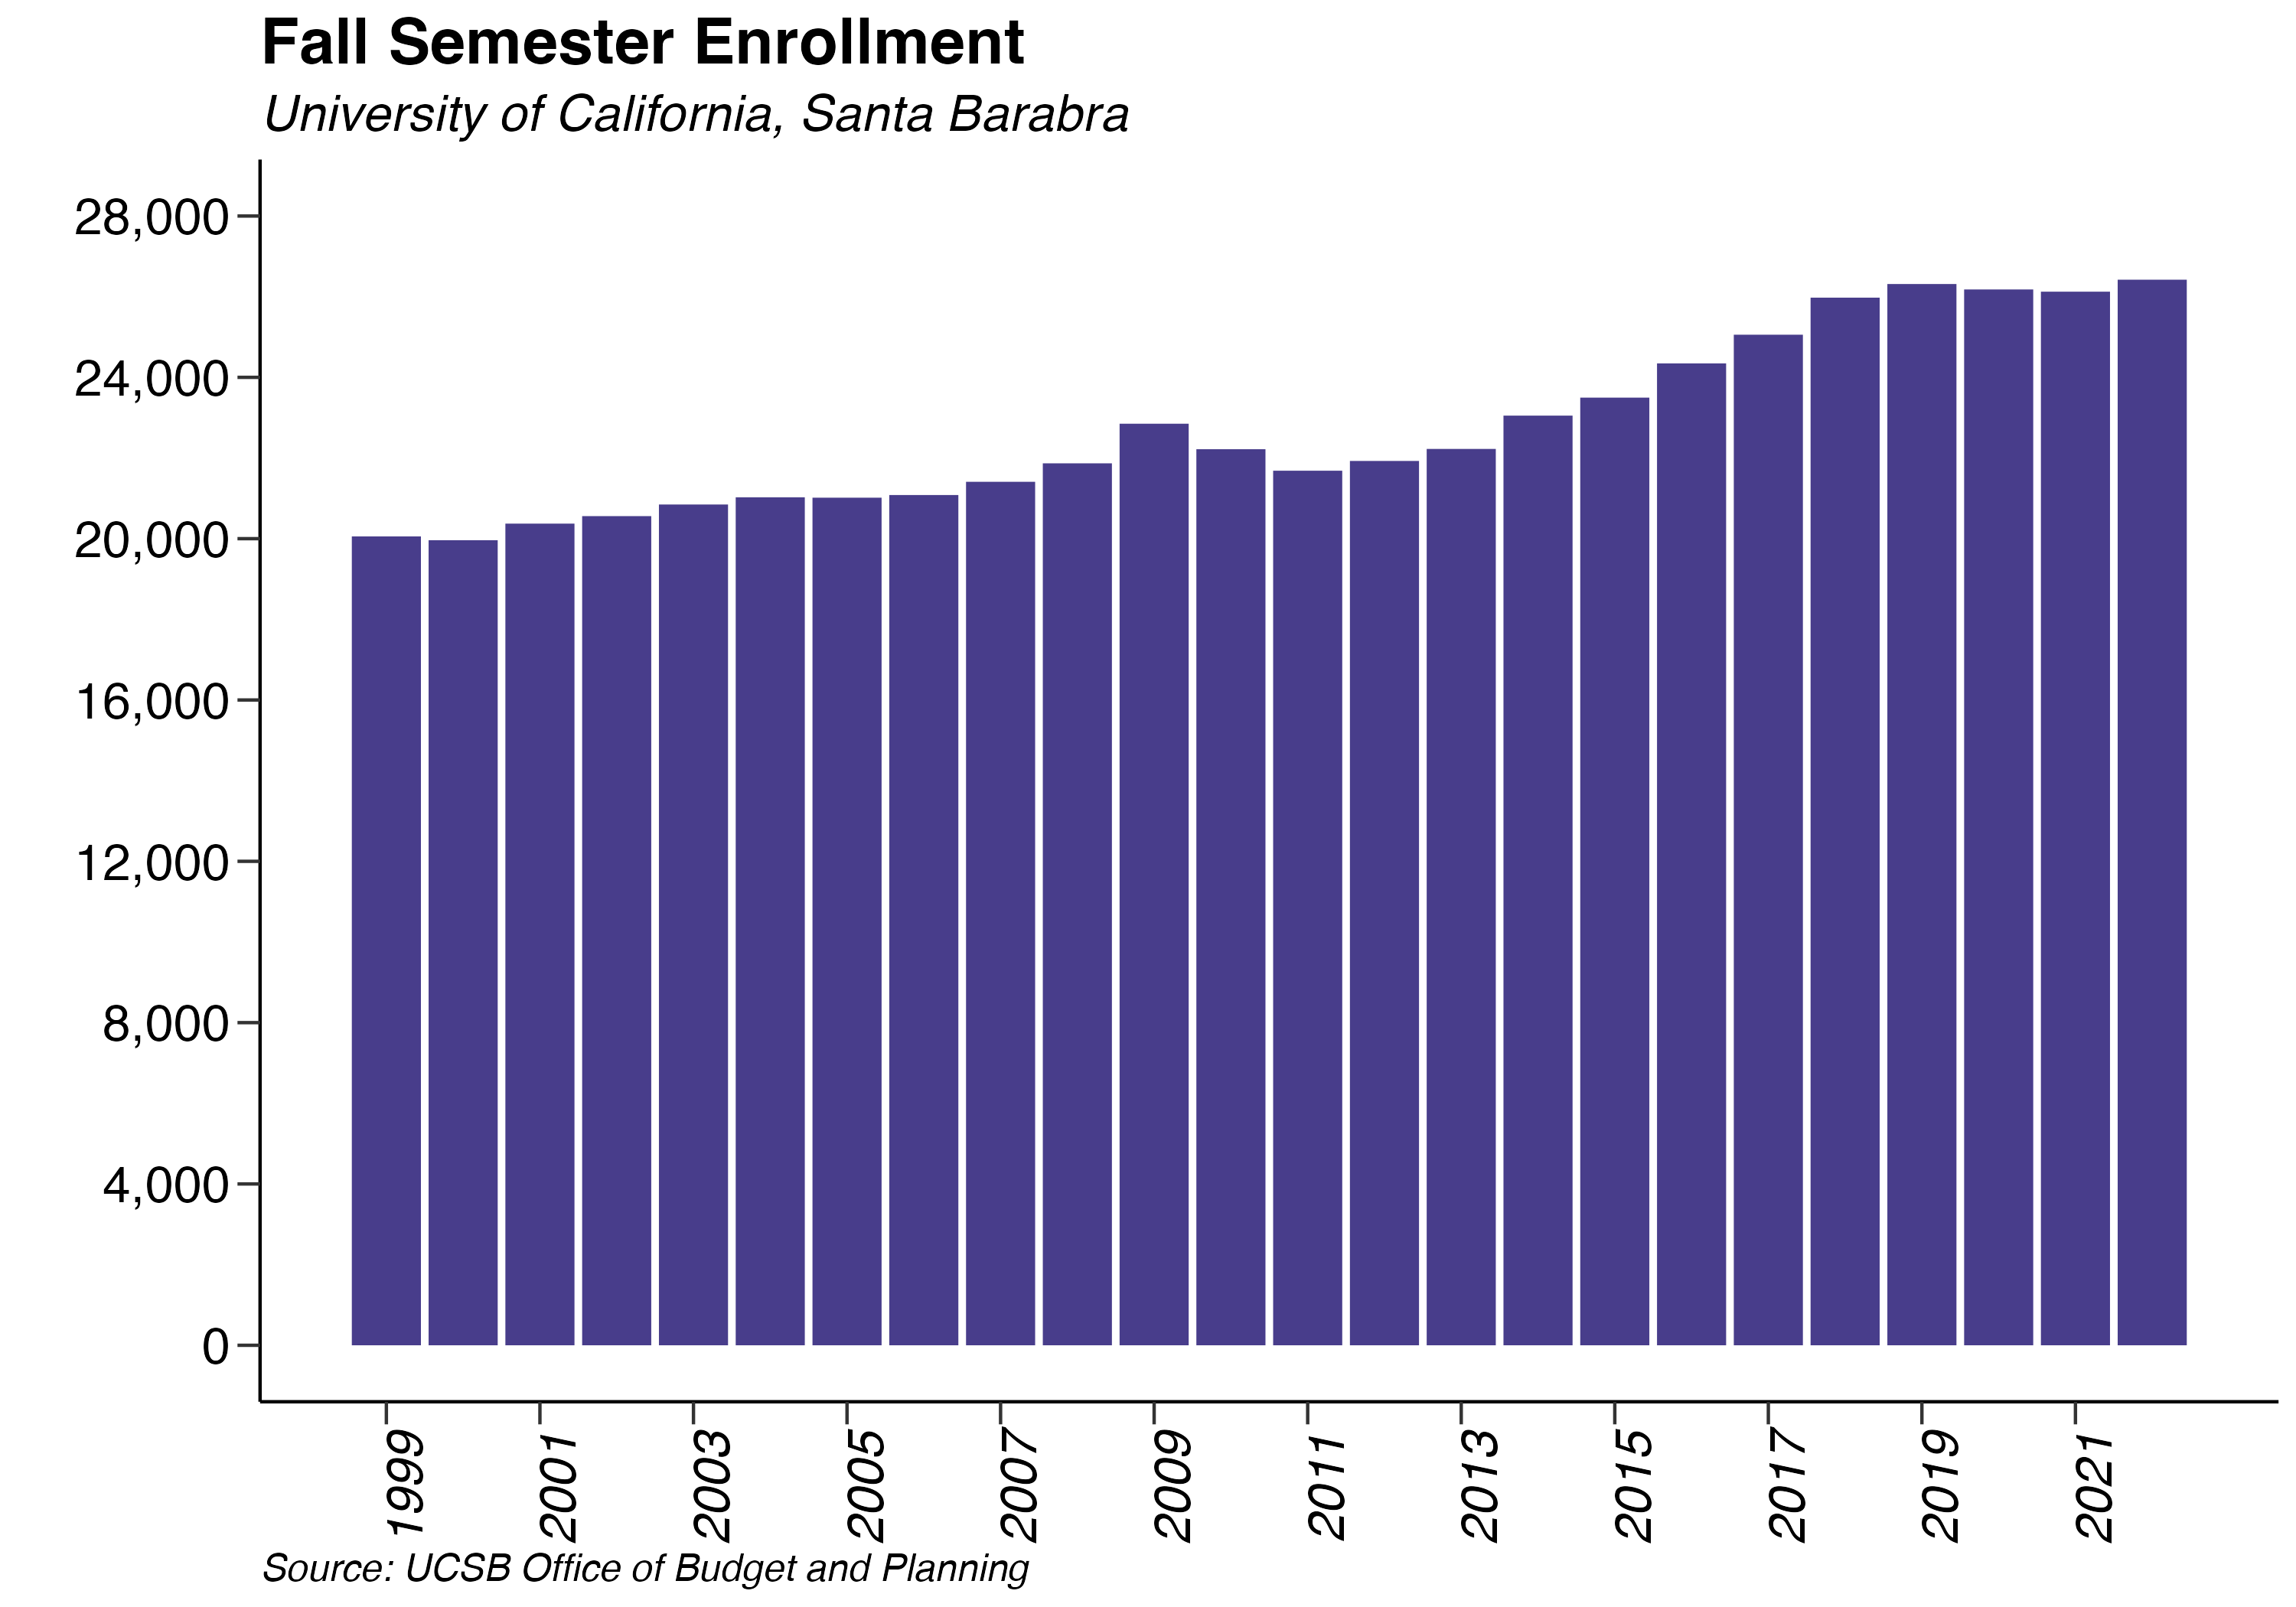
- Enrollment at the University of California, Santa Barbara has increased slightly from its record high in Fall 2019.
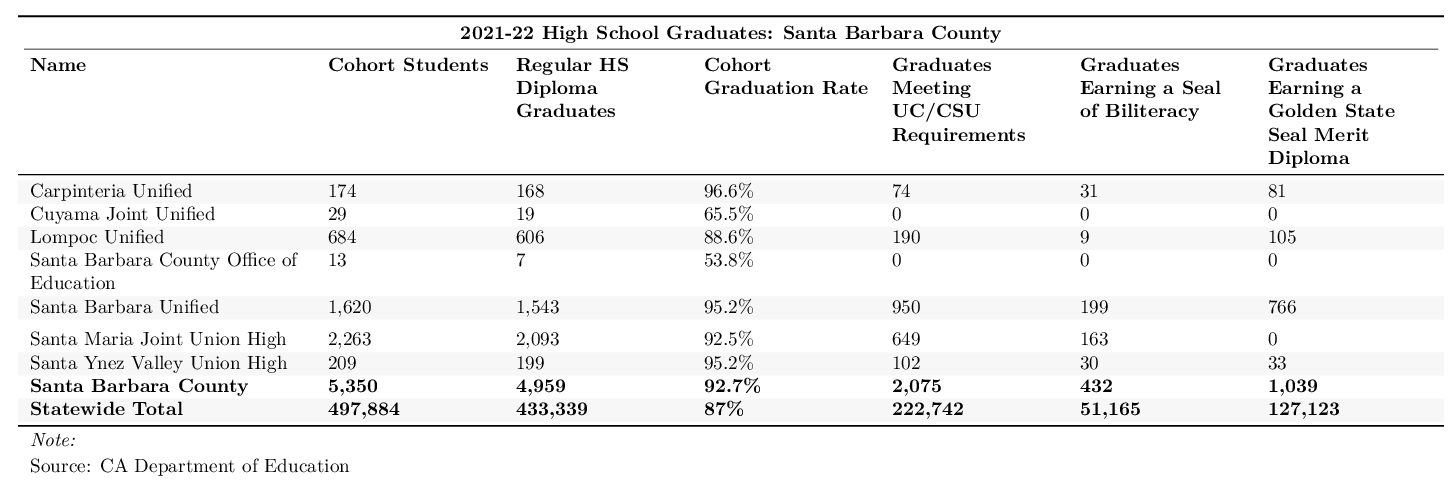
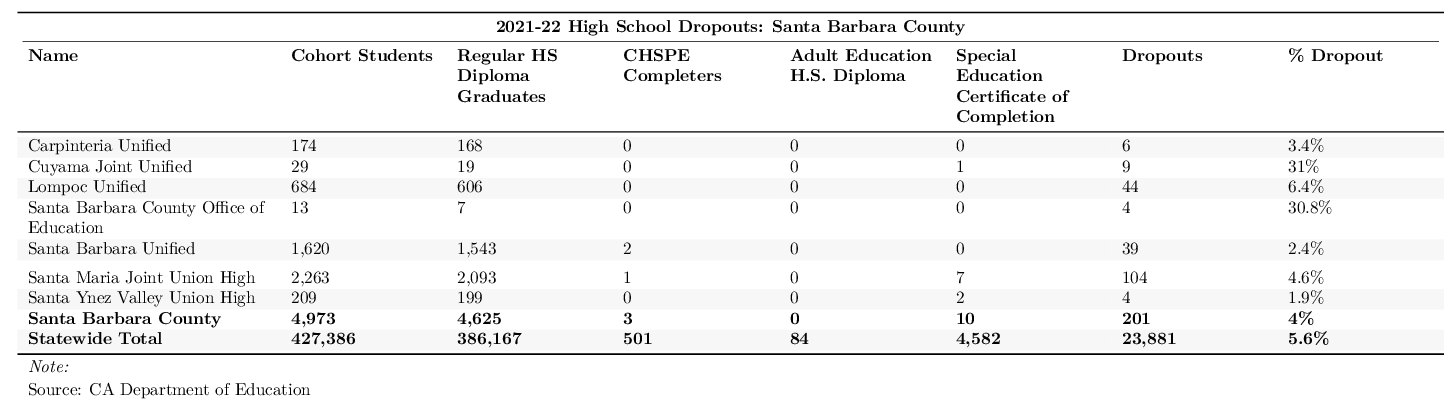
- The high school dropout rate of 4% in Santa Barbara County in the 2021-22 school year was substantially lower than the California average of 5.6%.
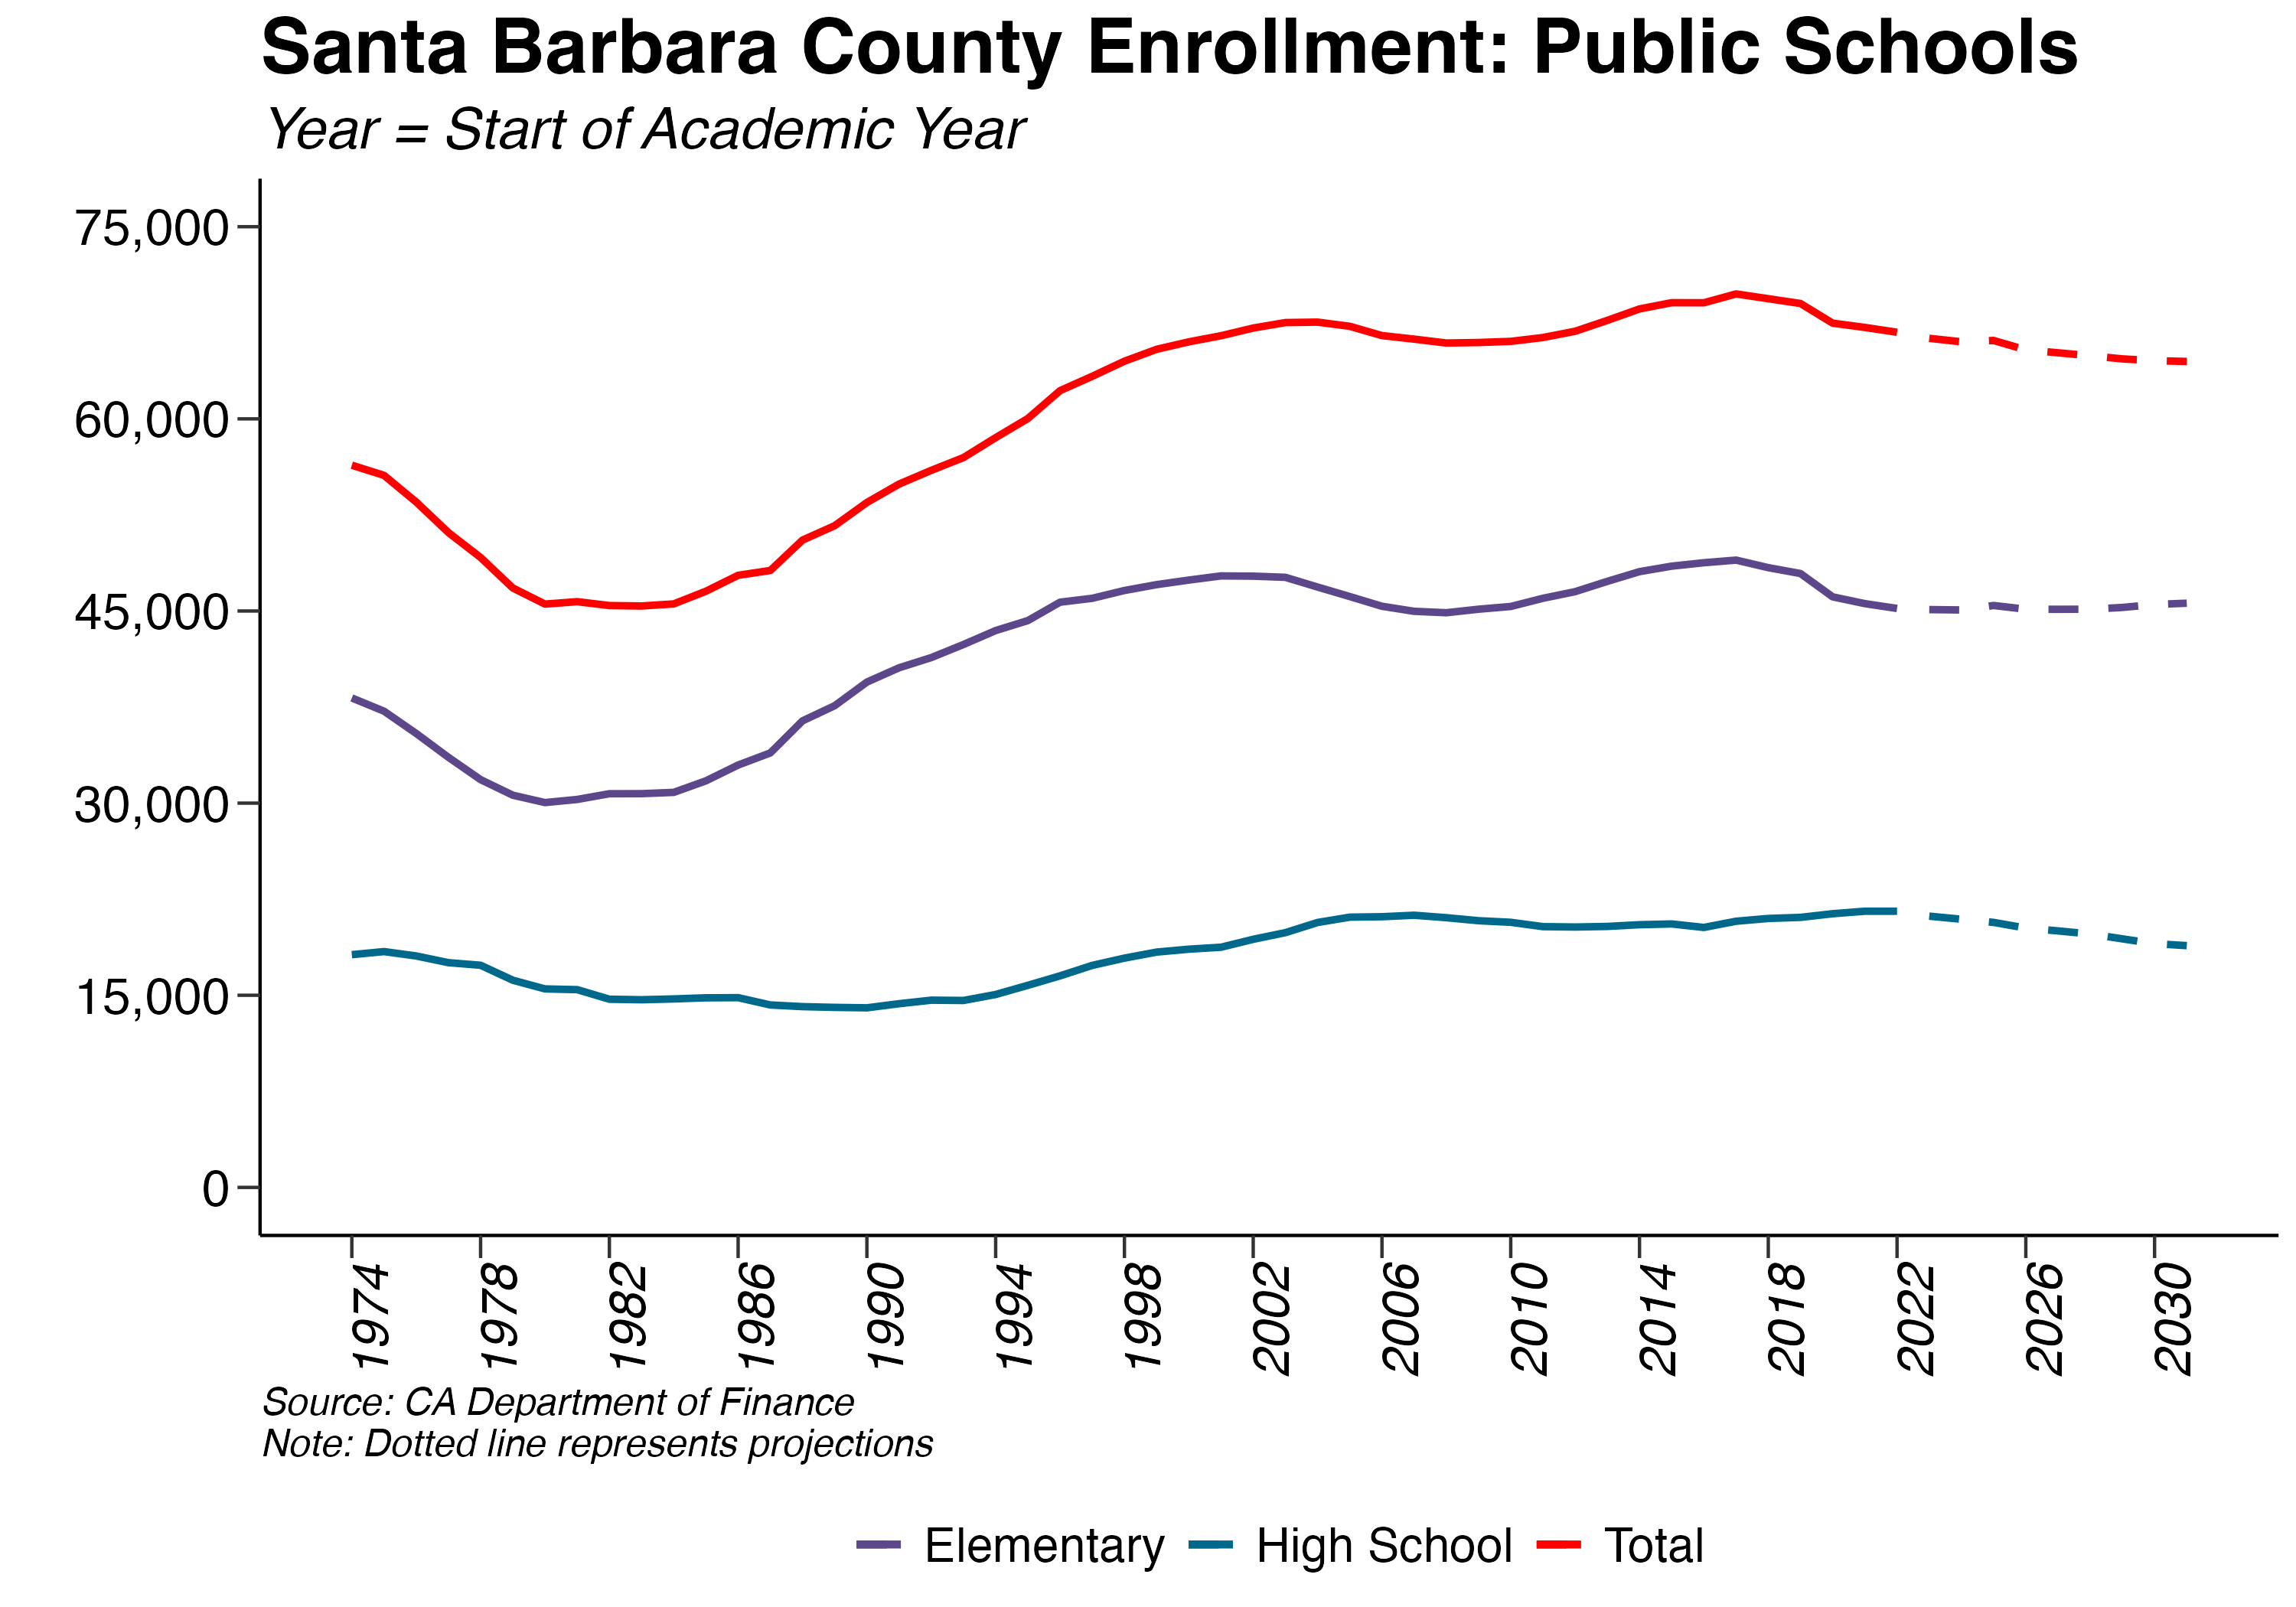
Public school enrollment in Santa Barbara County dropped by 0.5% between the 2021-22 and 2022-23 school years, a decrease of 333 students. The California Department of Education predicts that public school enrollment will shrink by 2.2 between 2023 and 2030. Is the decline driven by a decrease in the number of school-age children or by a shift to private schools? Private school enrollment has increased in Santa Barbara County since 2018, and in 2021 it reached 5210, its lowest point since the data began in 2014. Therefore, the decline in public school enrollment appears to be driven by a decrease in the number of school-age children in Santa Barbara County. Charter schools, which are considered public schools, have recently gained popularity: charter school enrollment has increased from its 2018-2019 peak of 7.2% of total enrollment to 6.7% of total enrollment.
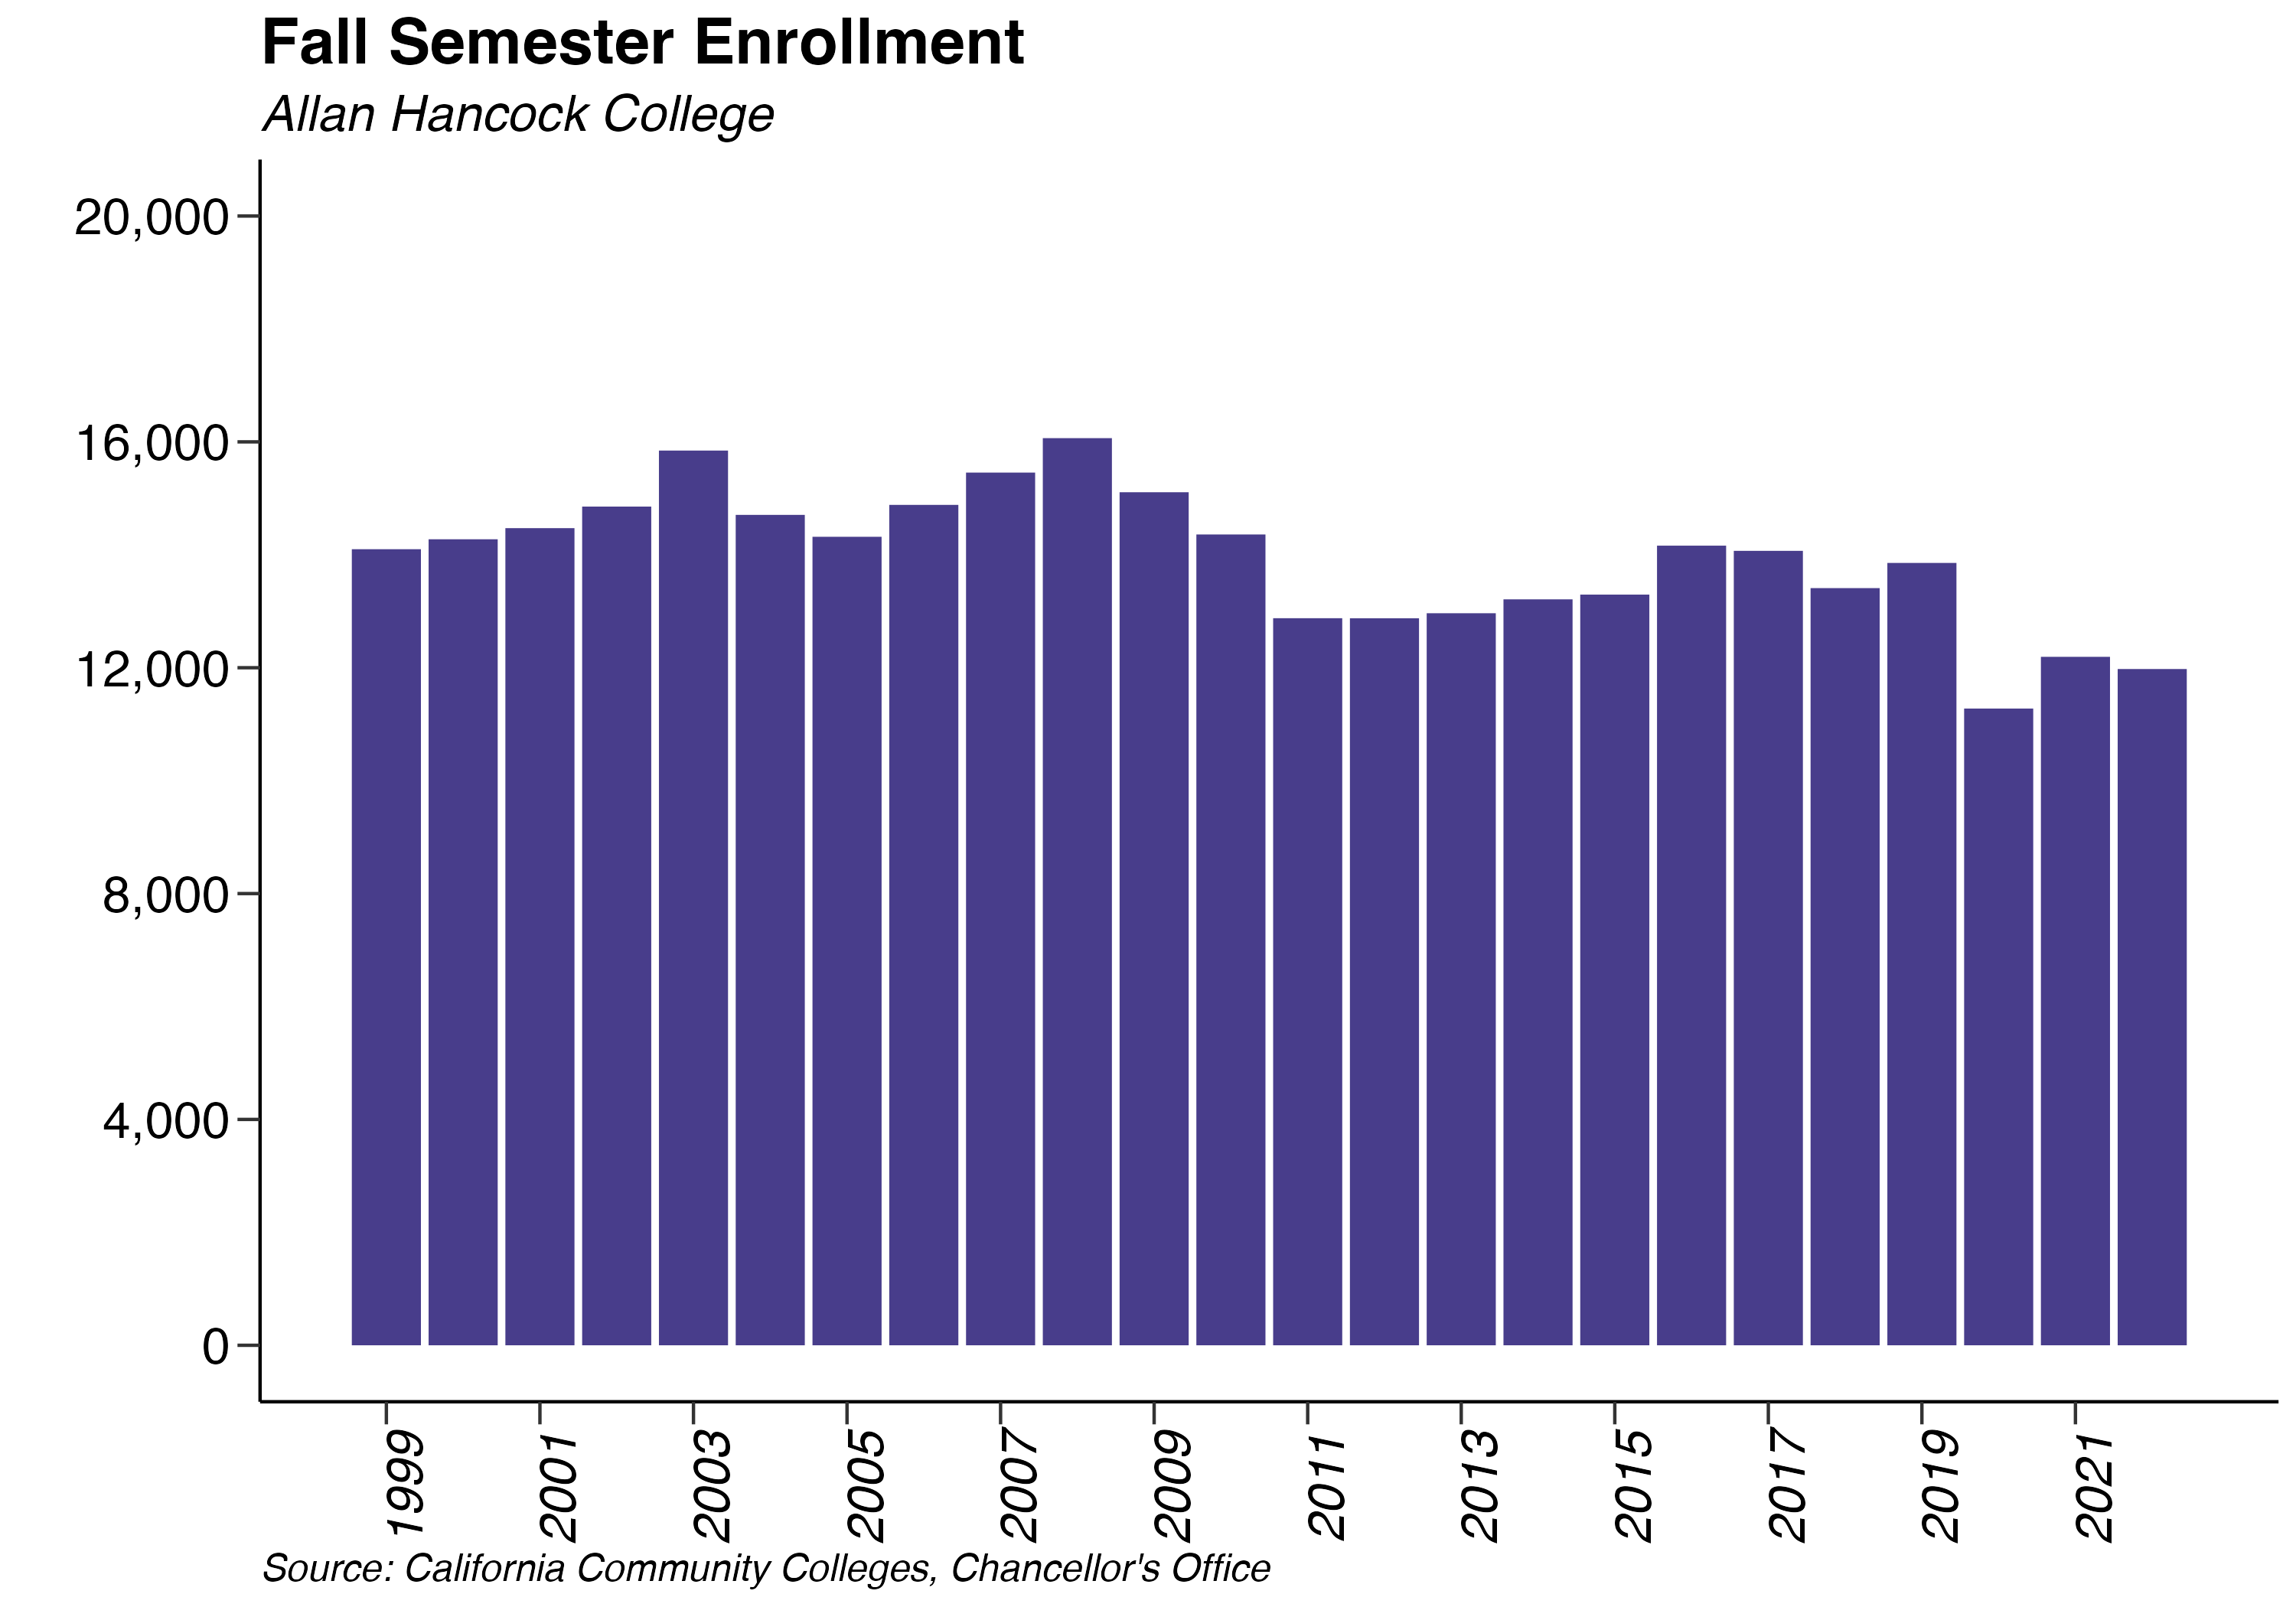
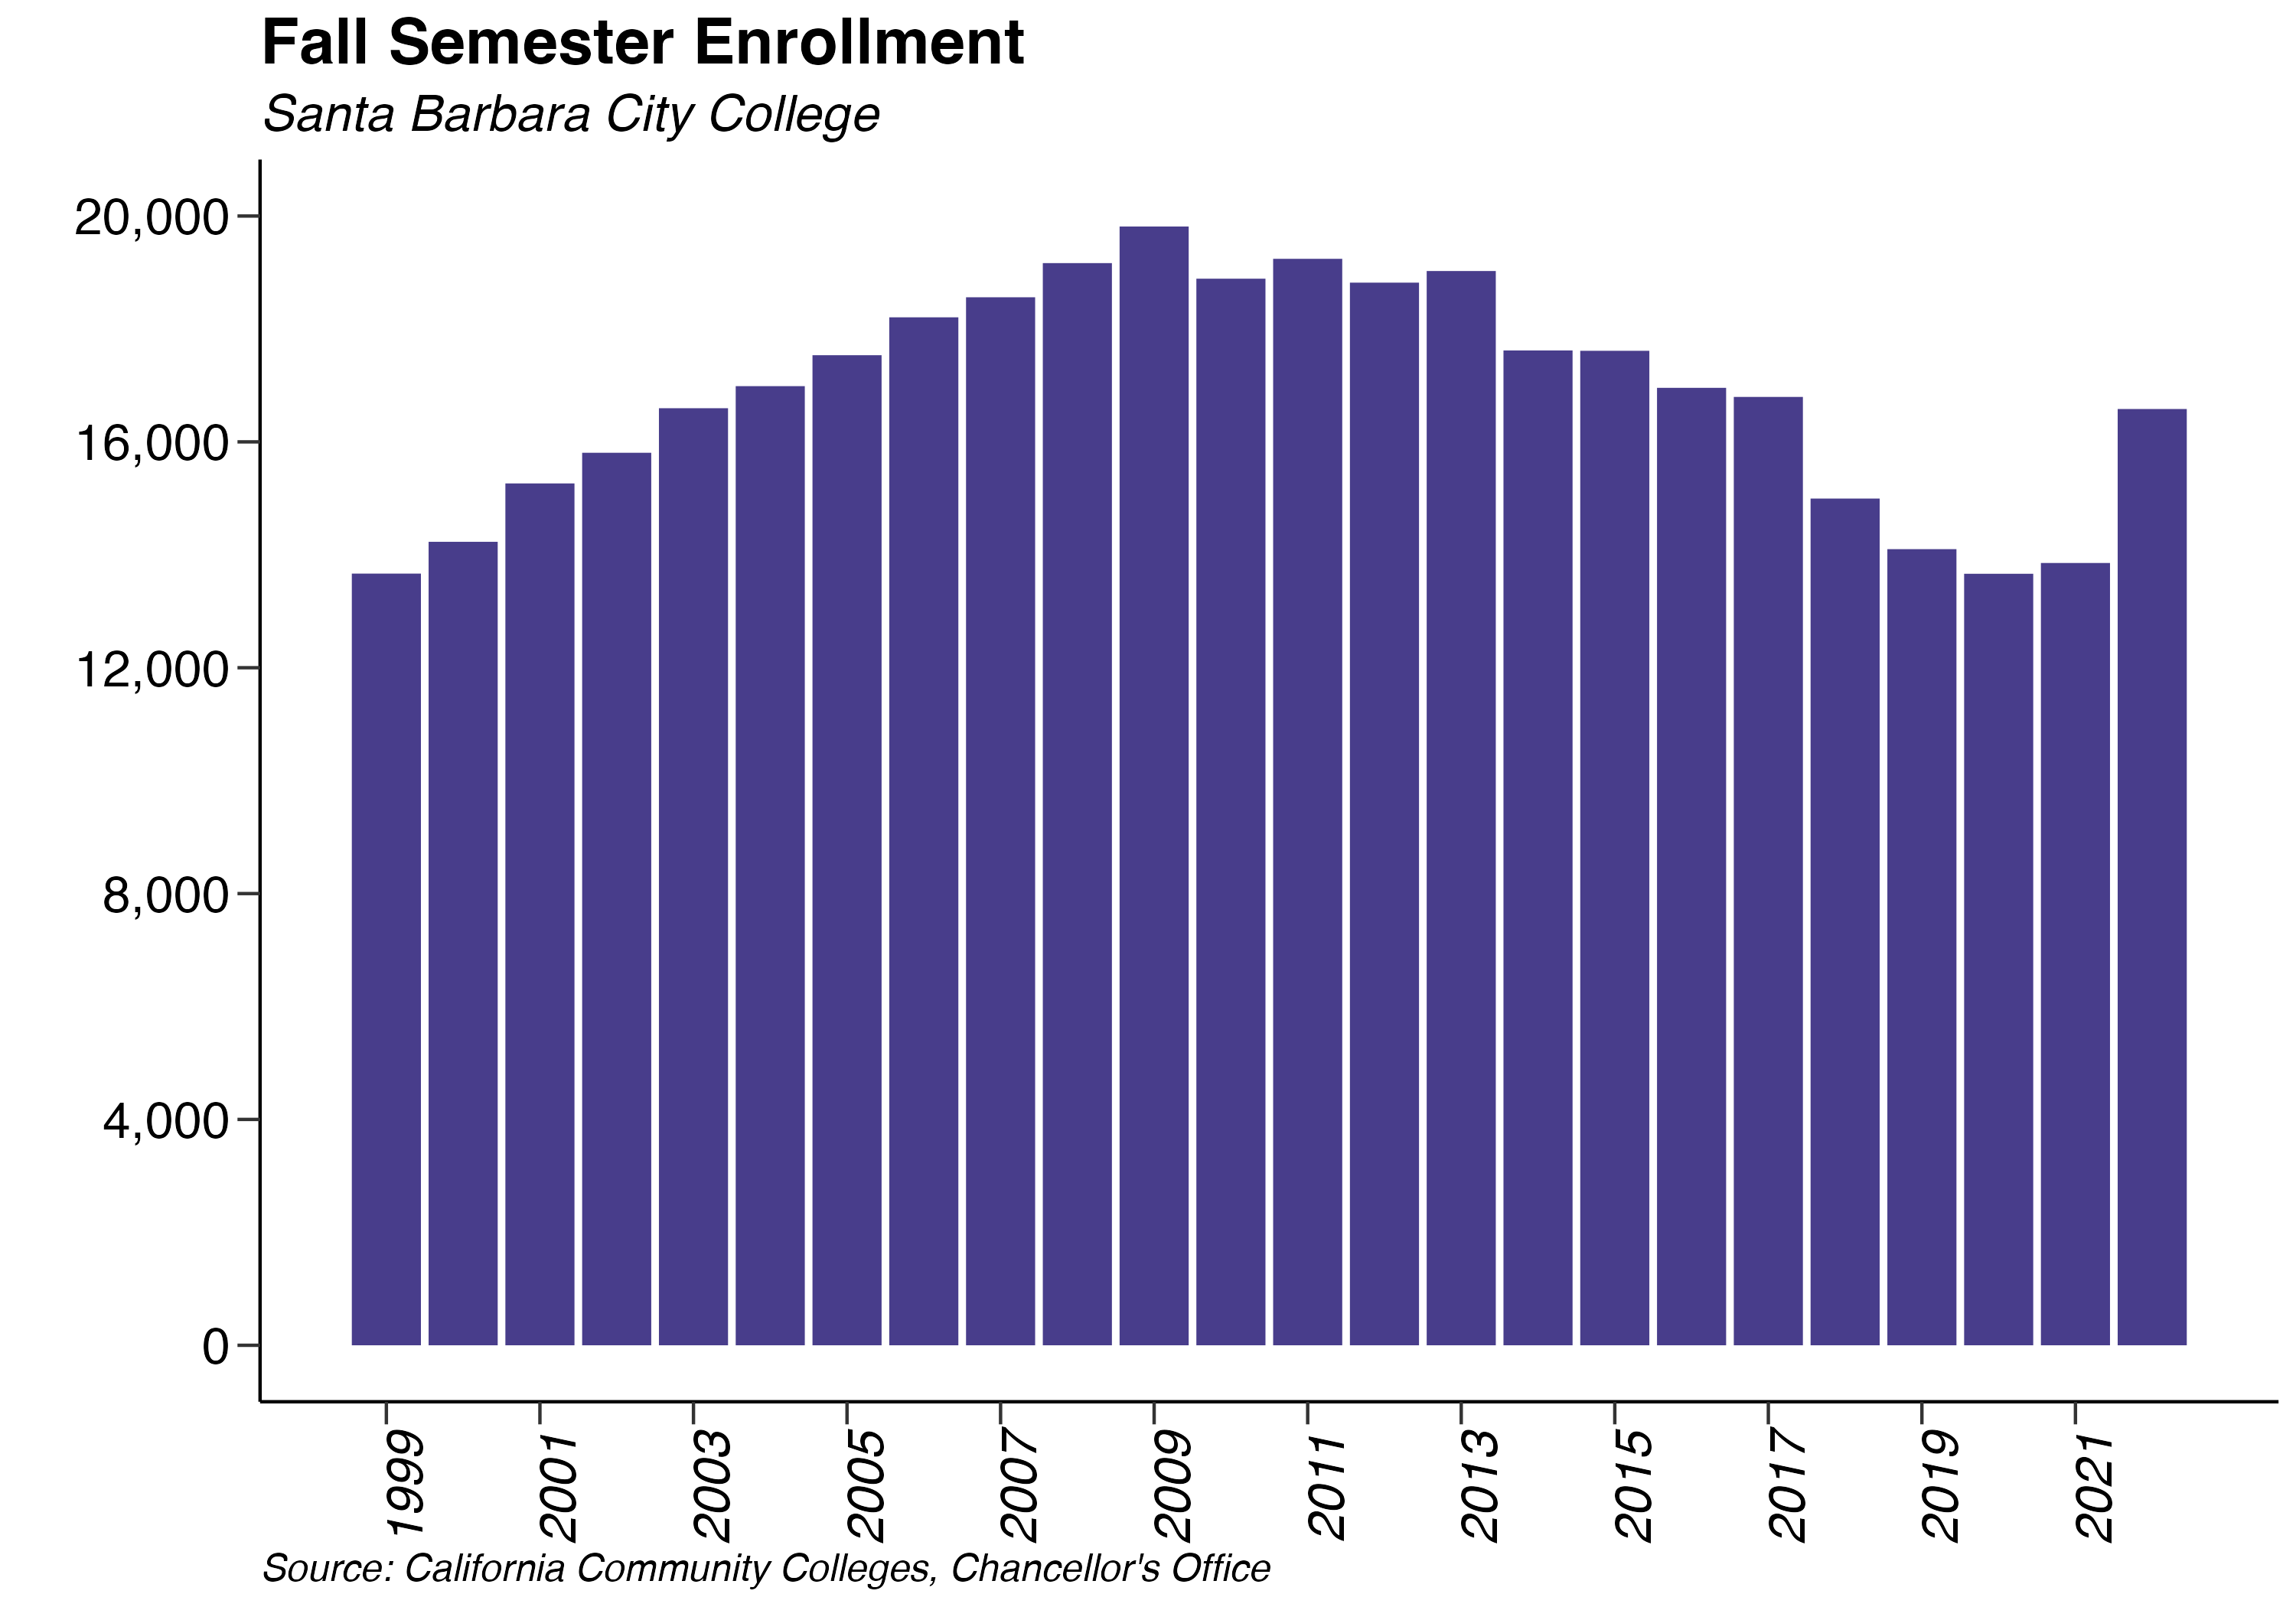
The University of California, Santa Barbara enrolled 26,314 students in Fall 2022, a 0% increase from the record high of 26,314 in Fall 2019. Allan Hancock College registration increased from 11,277 in 2021 to 12,193 in 2022, remaining well below its peak of 16,066 in Fall 2008. Santa Barbara City College enrolled 13,664 students in the fall, a -3.1% decrease from Fall 2021 but still 31% below its peak enrollment in Fall 2009.
6.3.1 Expenditures on Education
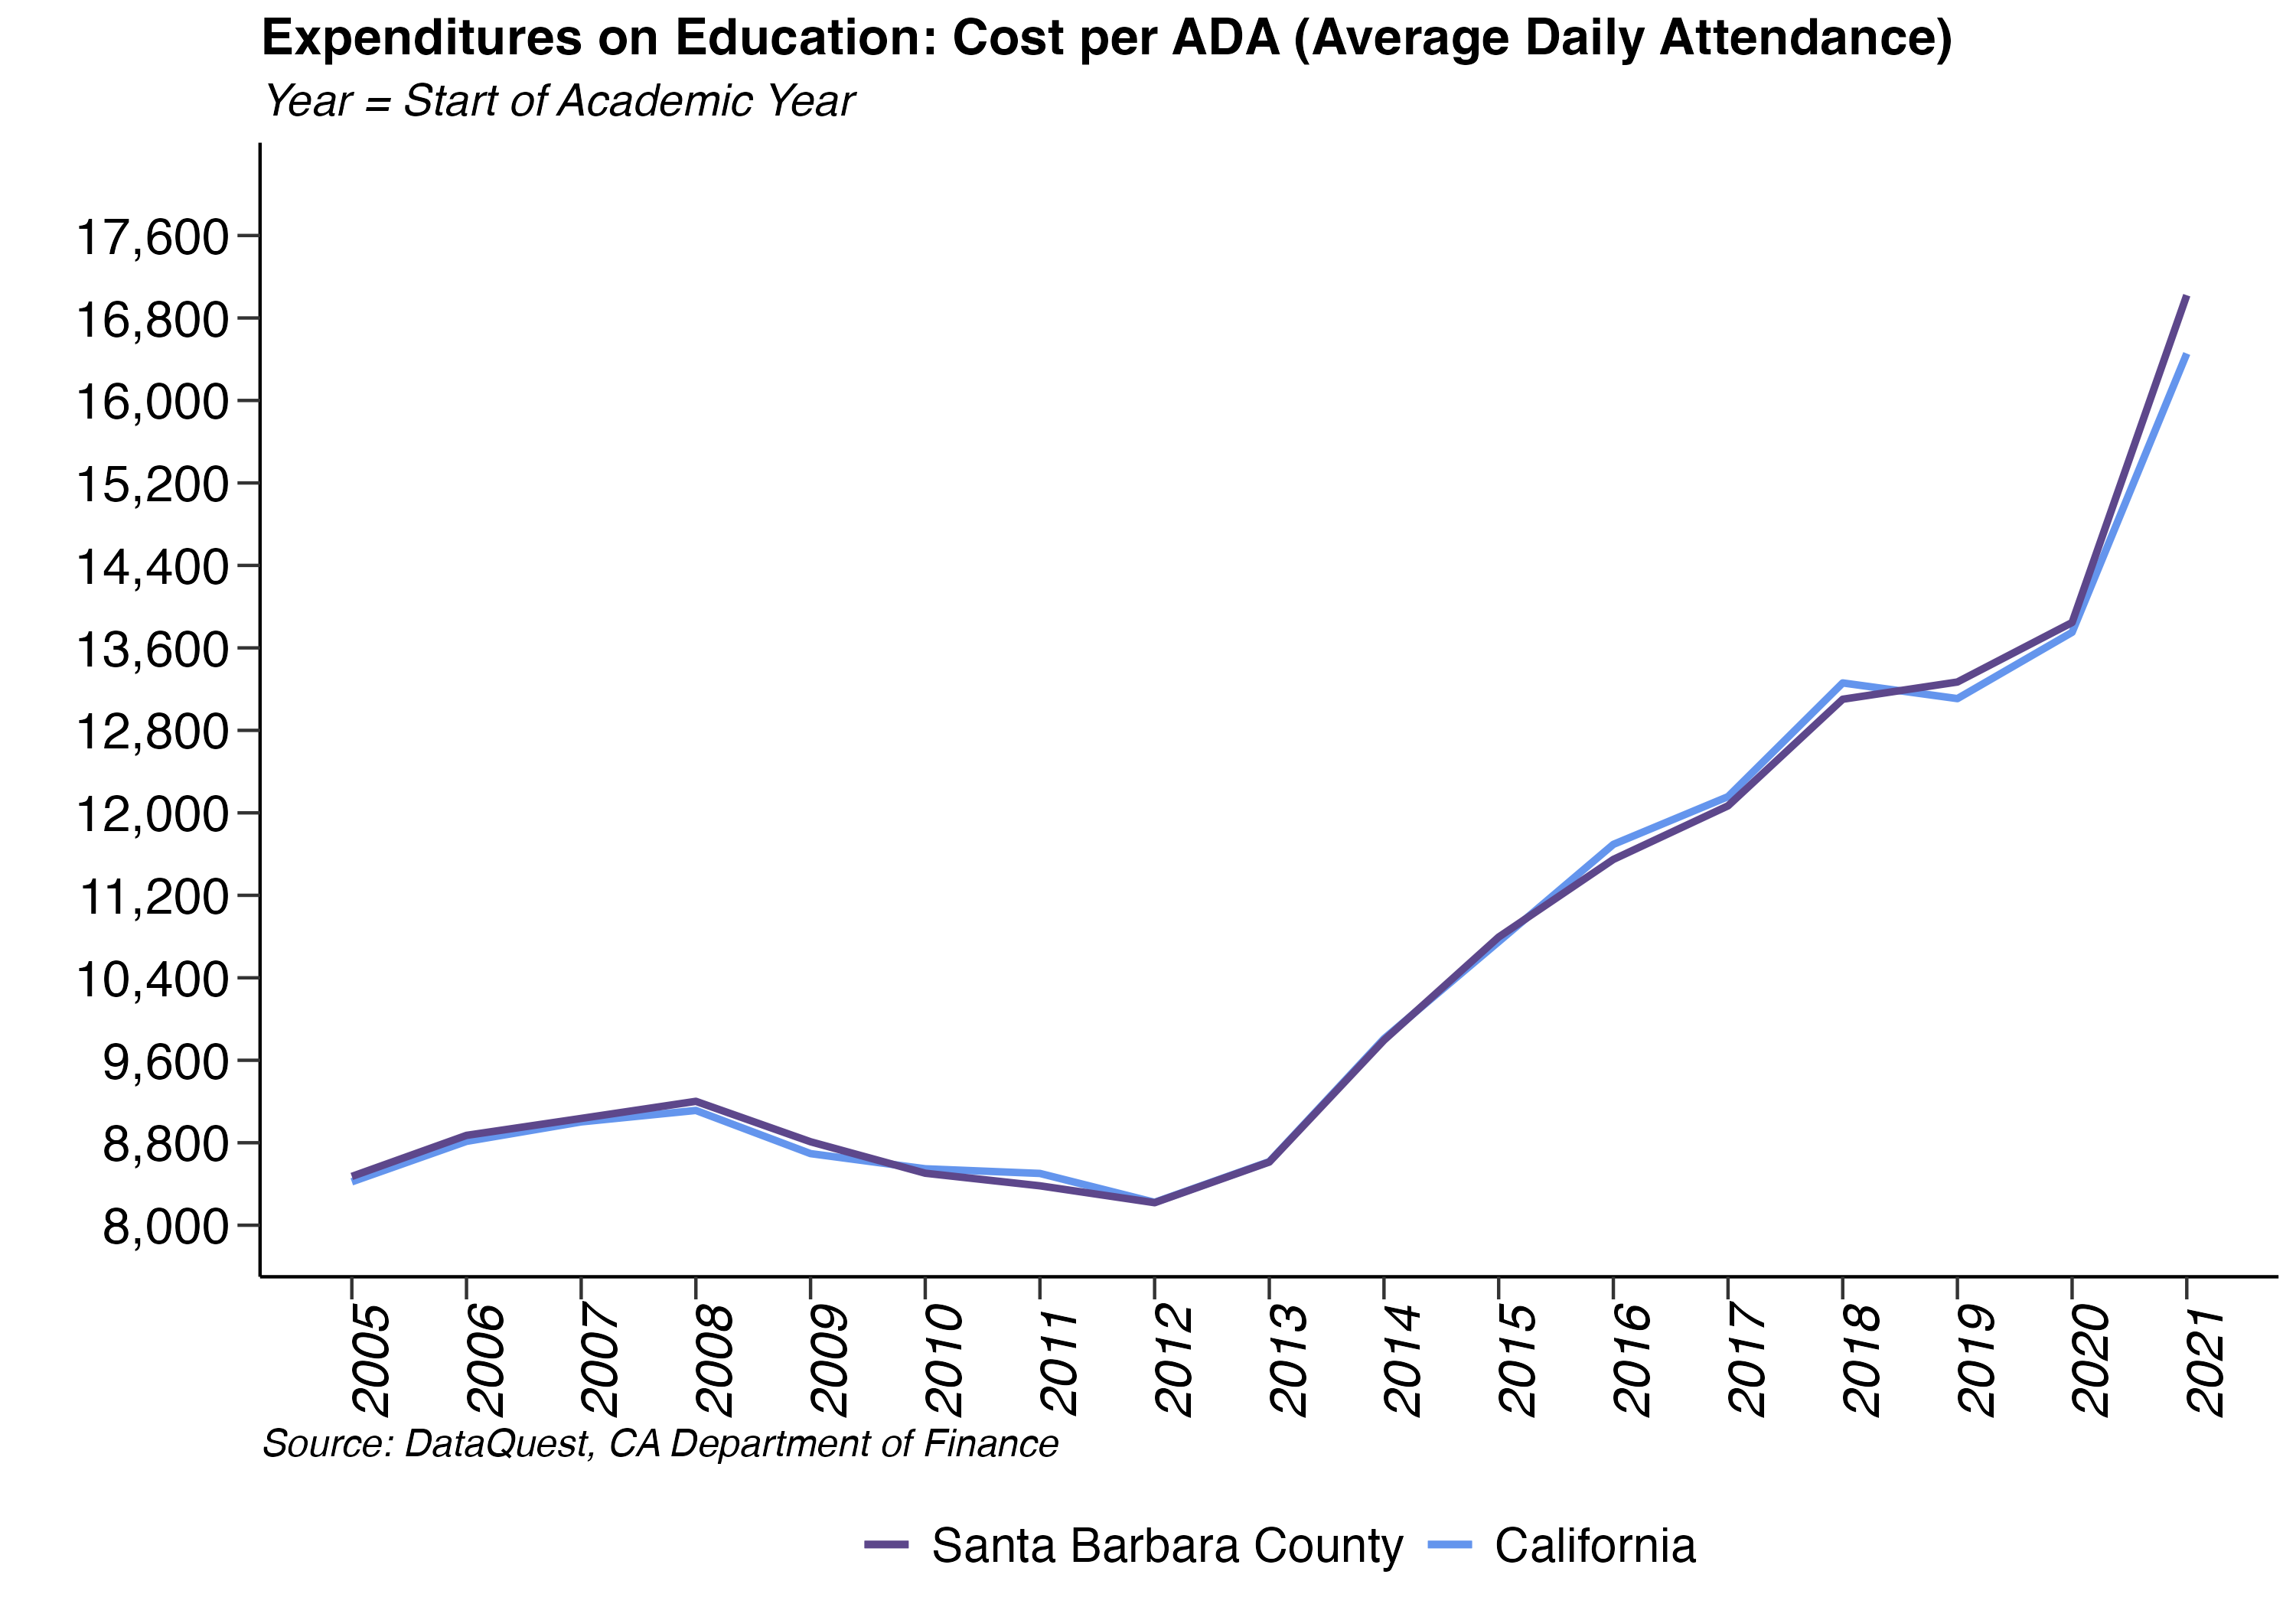
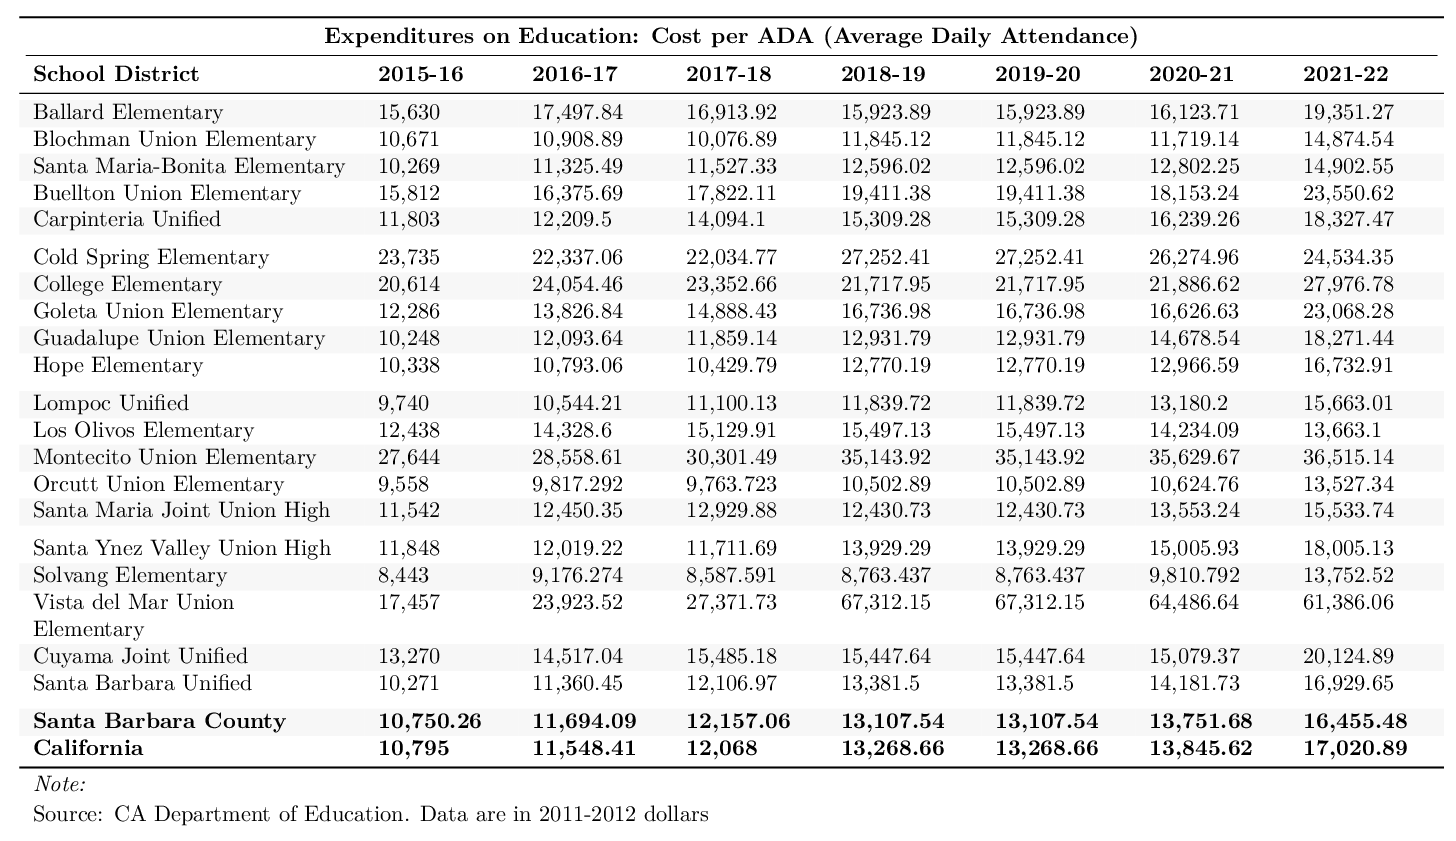
Using the following figures, we display the year-to-year changes in education expenditures at the state, county, and district level. These expenditures include the following costs: salaries, benefits, acquisitions, and construction. To measure these changes, we use the cost per average daily attendance (ADA), which measures the number of days of student attendance divided by the total number of days of instruction.
At the state and county levels, expenditures per ADA continued the upward trend that began in 2013. For the 2021-22 school year, expenditures per ADA for the state and county rose by 22.9% and 19.7%, respectively. Within Santa Barbara county, spending per student varies substantially across school districts. Six of the 20 districts experienced declines in spending per ADA: Blochman Union Elementary, Buellton Union Elementary, Cold Spring Elementary, Goleta Union Elementary, Los Olivos Elementary, and Solvang Elementary. Vista Del Mar Union Elementary has the highest cost per ADA.
When looking at the growth trend of school spending, it is helpful to also consider indicators such as average class size, student teacher ratios, and other performance measures to better understand the trend. For example, the increase in the cost per ADA could be attributed to either an increase in expenditures or a fall in enrollment. The rise for this year may be due in part to the decline in enrollment if education spending has not sufficiently adjusted to the decrease. Alternatively, general increases in spending could account for increased costs, although these changes cannot be directly observed. Thus, we cannot determine which of these factors is the driving force.
6.3.2 Performance Indicators
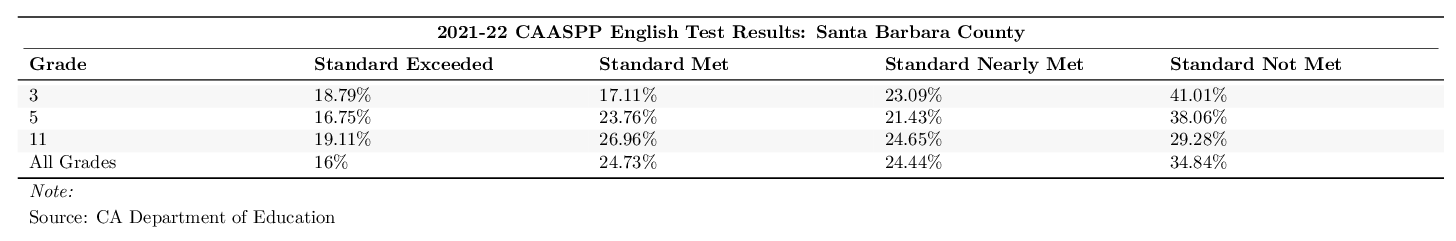
Created by the Smarter Balanced Assessment Consortium (SBAC), the California Assessment of Student Performance Progress (CASSPP) replaced the STAR exam in the Spring of 2014 due to state efforts to change testing from multiple choice and memorization to more interactive questions that require critical analysis skills. Since the trial run in 2013-14, the 2021-22 academic year is the seventh year of publicly released results.
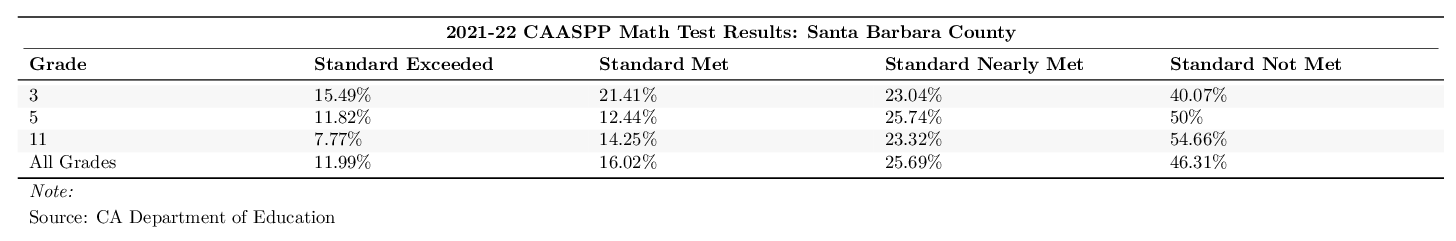
Santa Barbara County students performed far better in English than in either math or science: 40.7% of students met or exceeded the standard in English, compared with 28% in math and 23% in science. Although English had the lowest percentage of students who met or exceeded the standard, the percentage of students in the lowest-scoring category of “Standard Not Met” was highest for math at 46.3%. A higher percentage of 11th grade students met or exceeded standards in English than 3rd or 5th grade students.
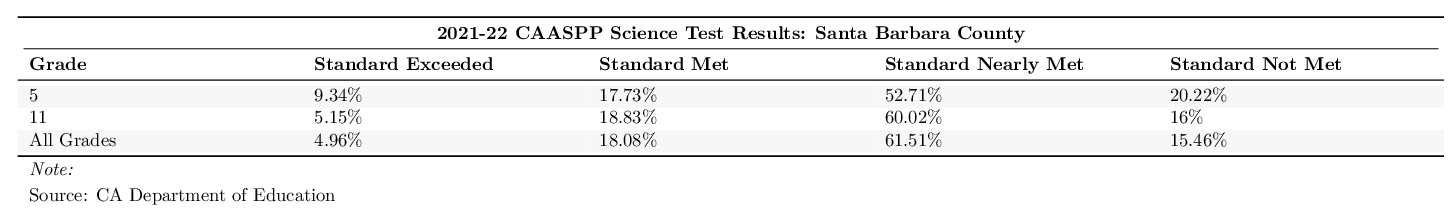
In 2013, the California State Board of Education adopted the Next Generation Science Standards which focuses on creating a shift in science education to have students express more conceptual and applied understanding of the material. California Science Test (CAST) results were made available for the first cohort of students in 2019. The 2021-22 results show that the majority of students (61.5%) nearly meet the standard for science, while 18.1% meet the standard and only 5% exceed it. Students younger than grade 5 are not required to take the CAST exam.
The California High School Exit Examination (CAHSEE) was made to demonstrate a competency of English-language arts and mathematics and was required in order to earn a high school diploma. The CAHSEE was suspended in October 15 and has not been reinstated. Furthermore, our usual data for SAT scores by section is no longer available due to revisions in the test. Therefore, we are unable to present SAT testing data for the 2020-21 academic year.
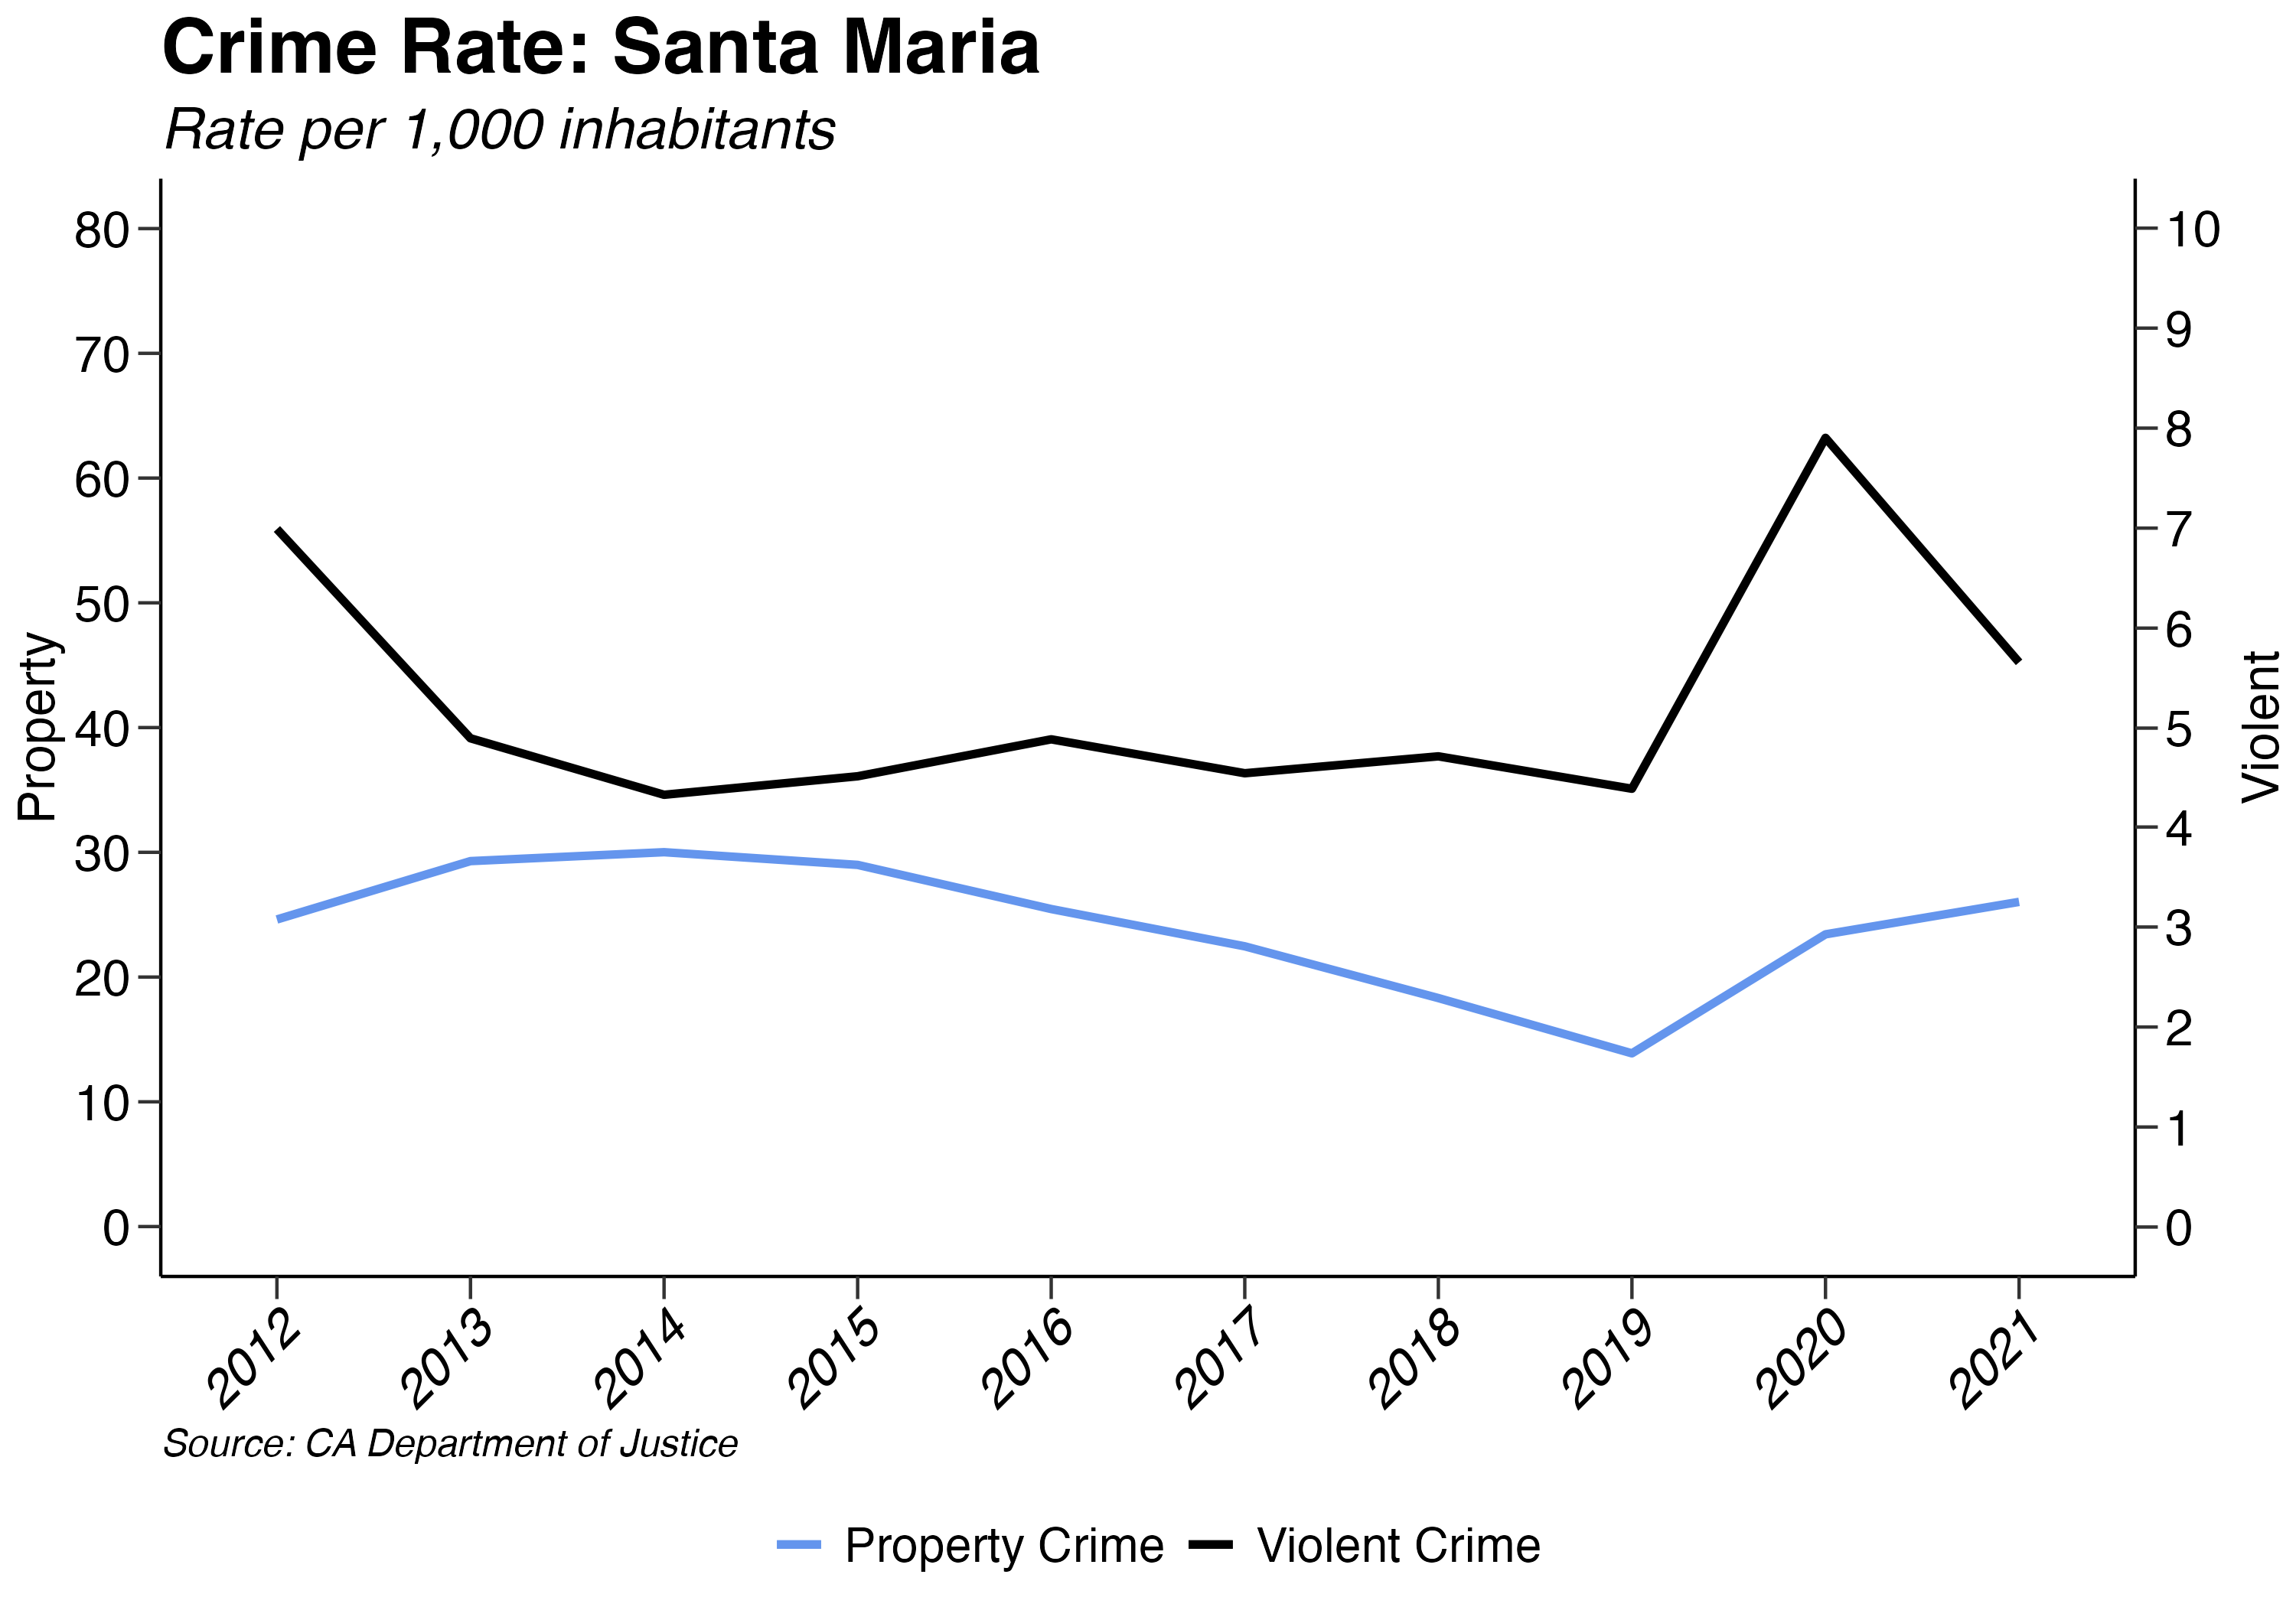
The four-year high school graduation rate in Santa Barbara County was 92.7% in 2022, exceeding the statewide rate of 87%. Out of 4959 students who graduated in 2022, 42% met the standards required to attend a University of California or California State University school. Santa Barbara County has a high school dropout rate of 4%, compared with the statewide rate of 5.6%. Among Santa Barbara County school districts, Santa Maria Joint Union High has the highest graduation rate of 96.6%. Lompoc Unified has the most students who received a Special Education Certificate of Completion.
6.4 Environment
Key Points:
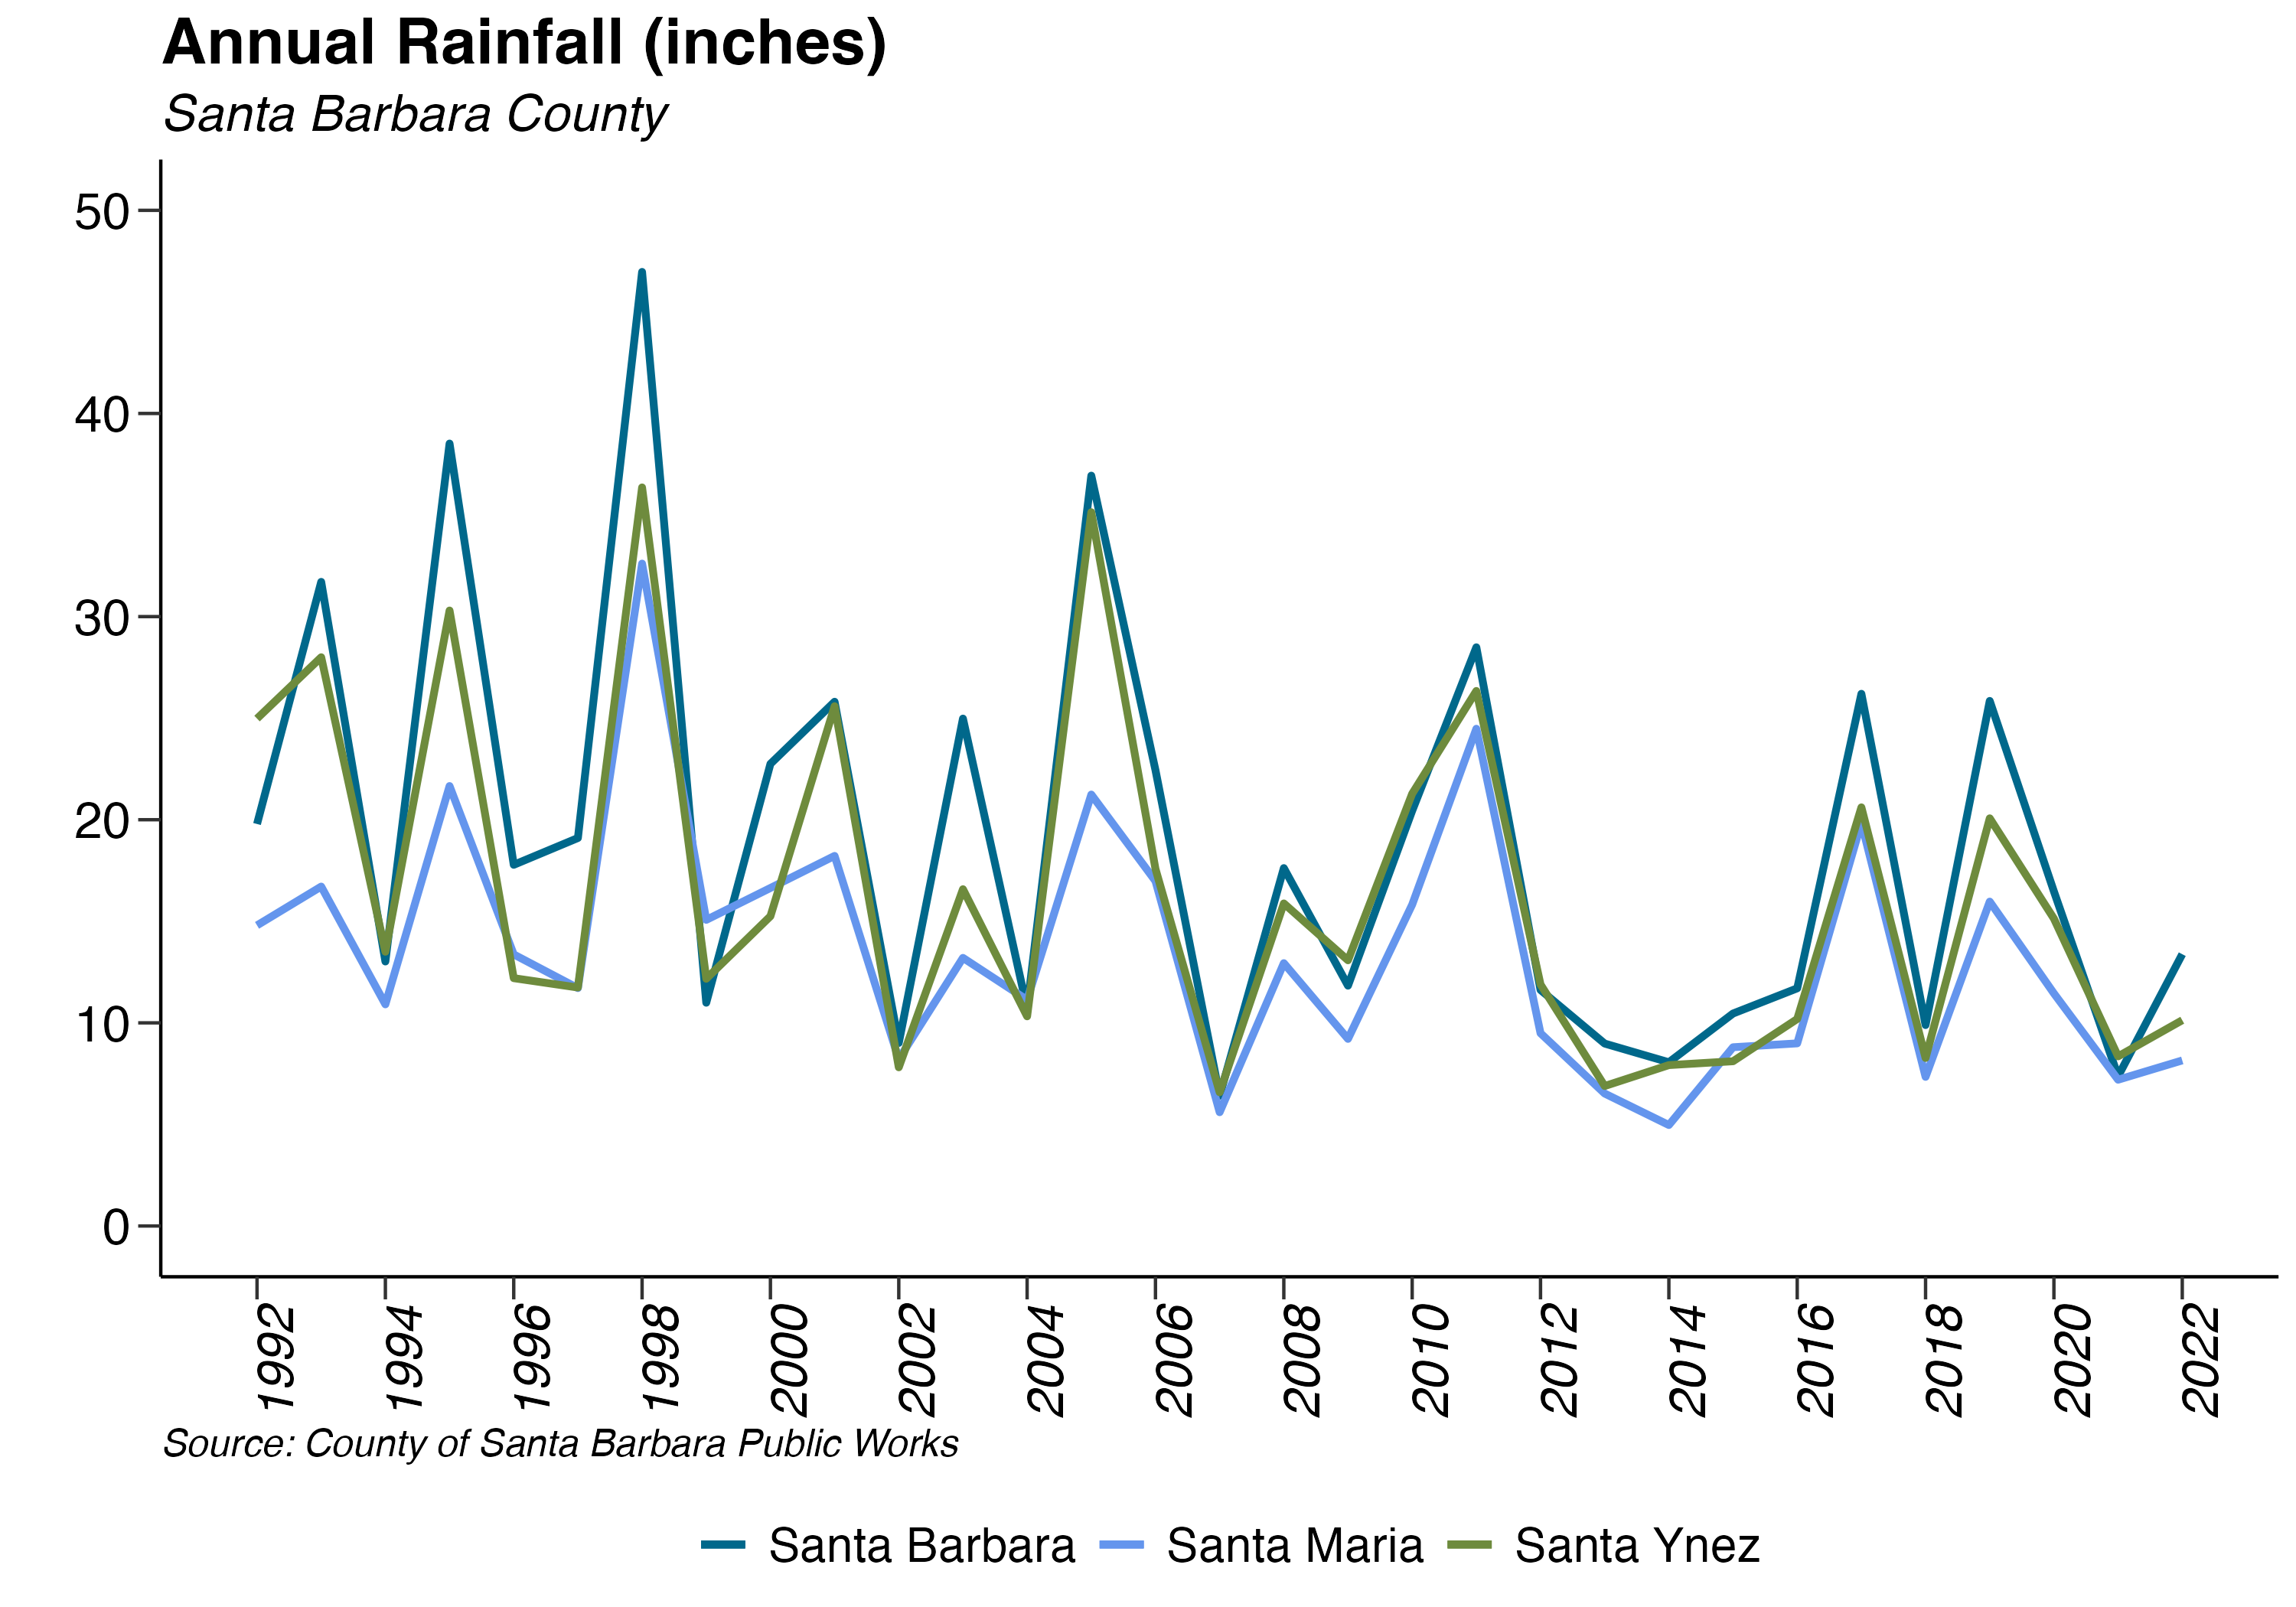
- Santa Barbara Country experienced a “Dry Year” with 64% of typical rainfall.
- Total energy use in Santa Barbara County down in 2021
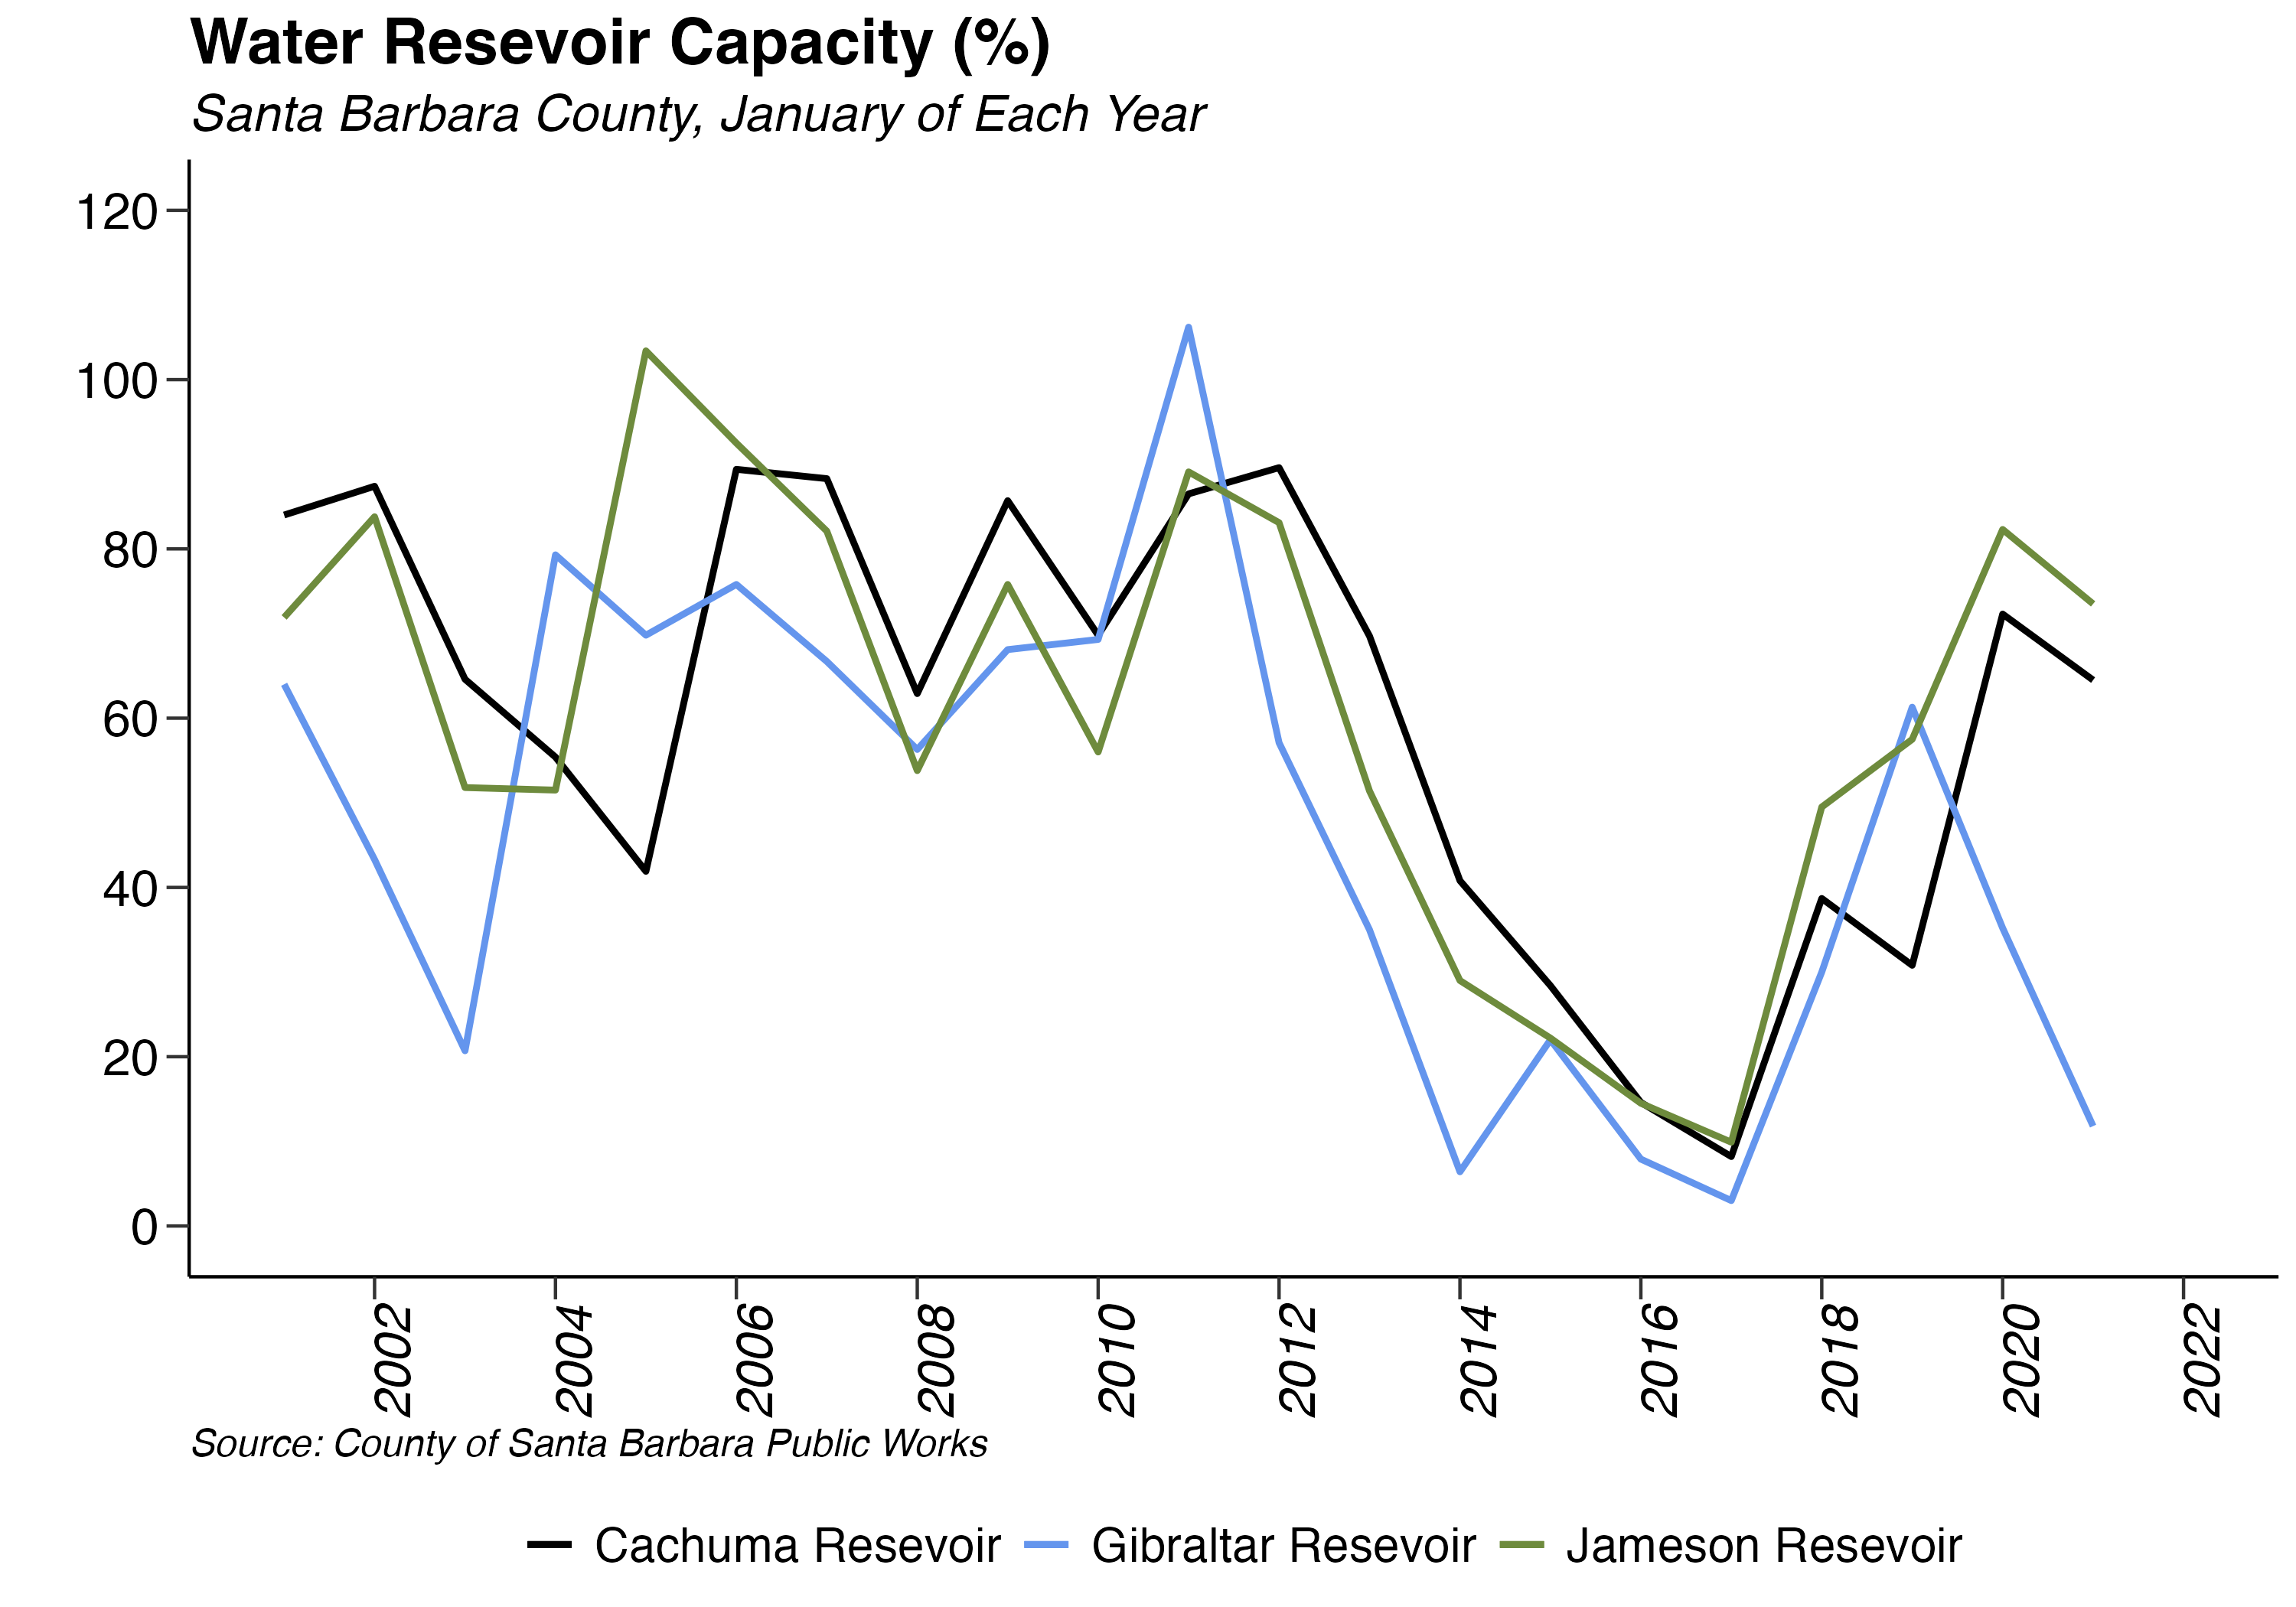
- Water levels in Santa Barbara County remained stable in 2019.
- In 2023, Santa Barbara County had 0 days exceeding the 8-hour state ozone standard.
6.4.1 Annual Rainfall
2022 experienced 64% of normal water-year rainfall, measured from September 1, 2021, to August 31, 2022. 2022 is therefore classified as a “Dry Year,” which Santa Barbara County defines as a year that has received less than 80% of normal rainfall. Santa Barbara County has returned to a drought after decreasing rainfall since 2018. Santa Barbara, Santa Ynez, and Santa Maria each saw an increase in rainfall. compared to 2021. Santa Barbara received 13.38 inches of rainfall, 74% of its mean annual rainfall of 17.99 inches. Santa Maria saw 8.15 inches of rain, 103% of its mean annual rainfall of 12.94 inches. Lastly, Santa Ynez received 10.13 inches of rain, 85% of its mean annual rainfall of 15.73 inches. The 2022 water-year sees continued below average rainfall for all three cities after 2021 saw slightly below average rainfall in all three cities.
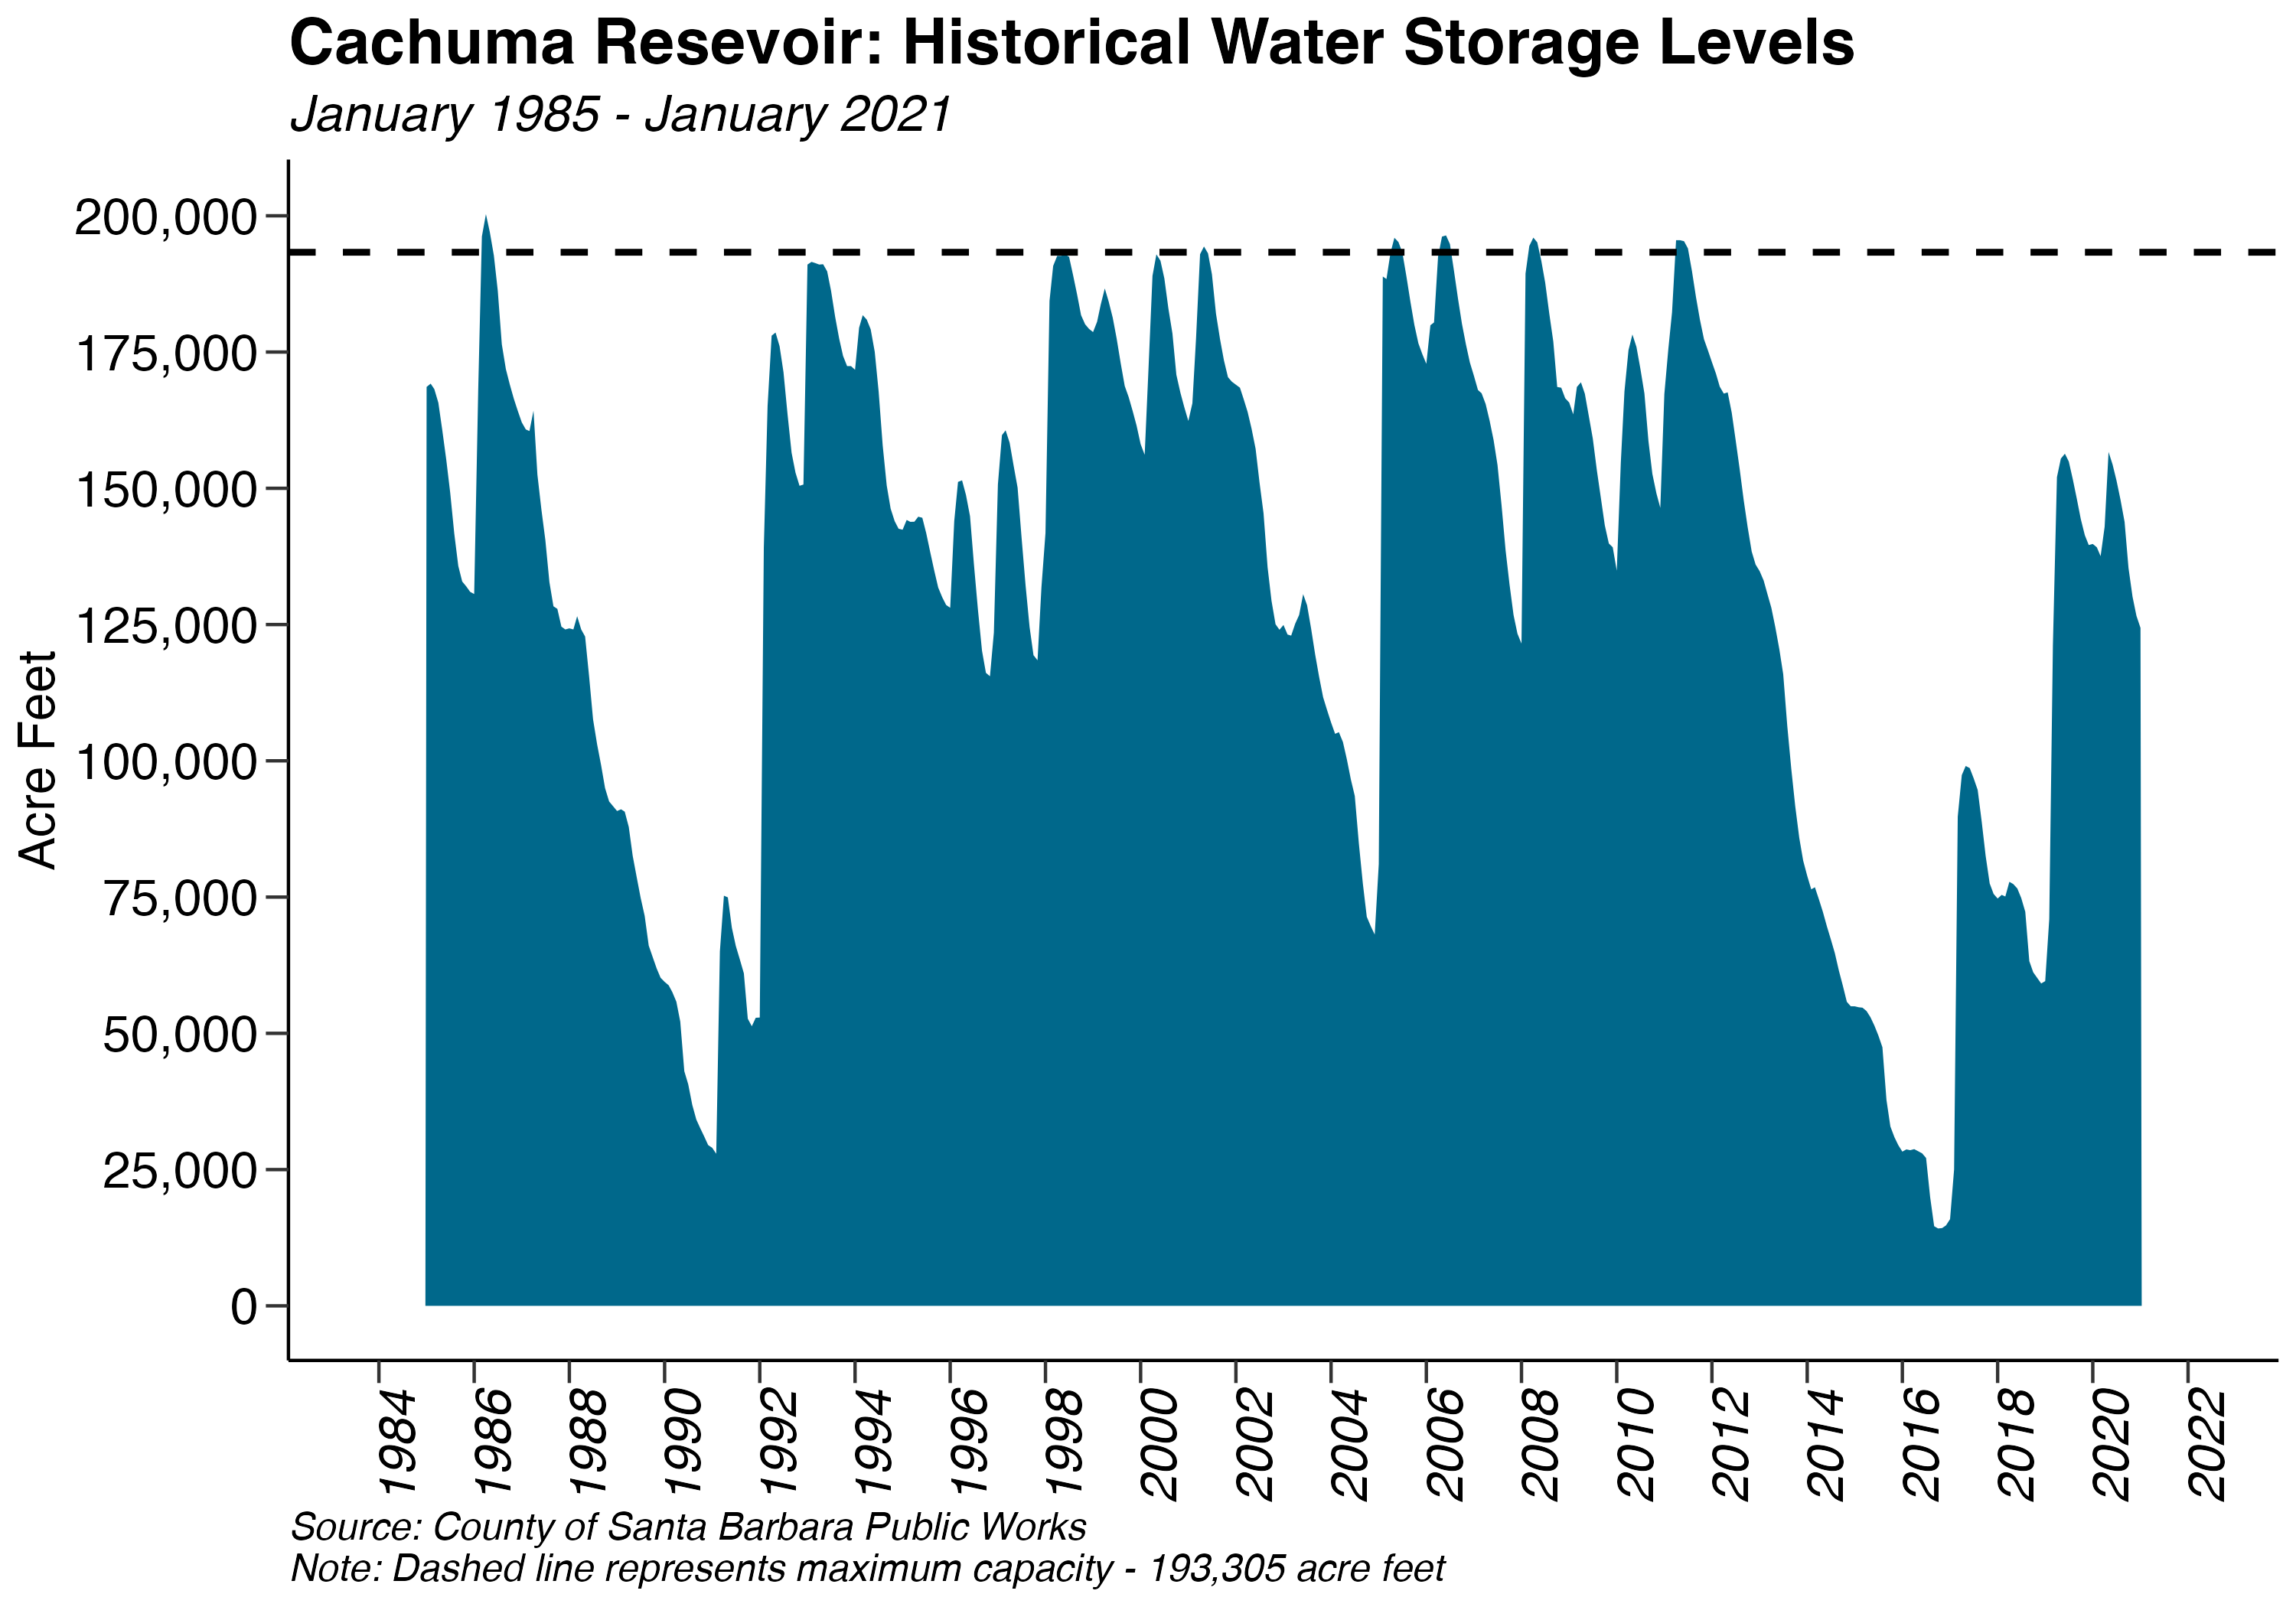
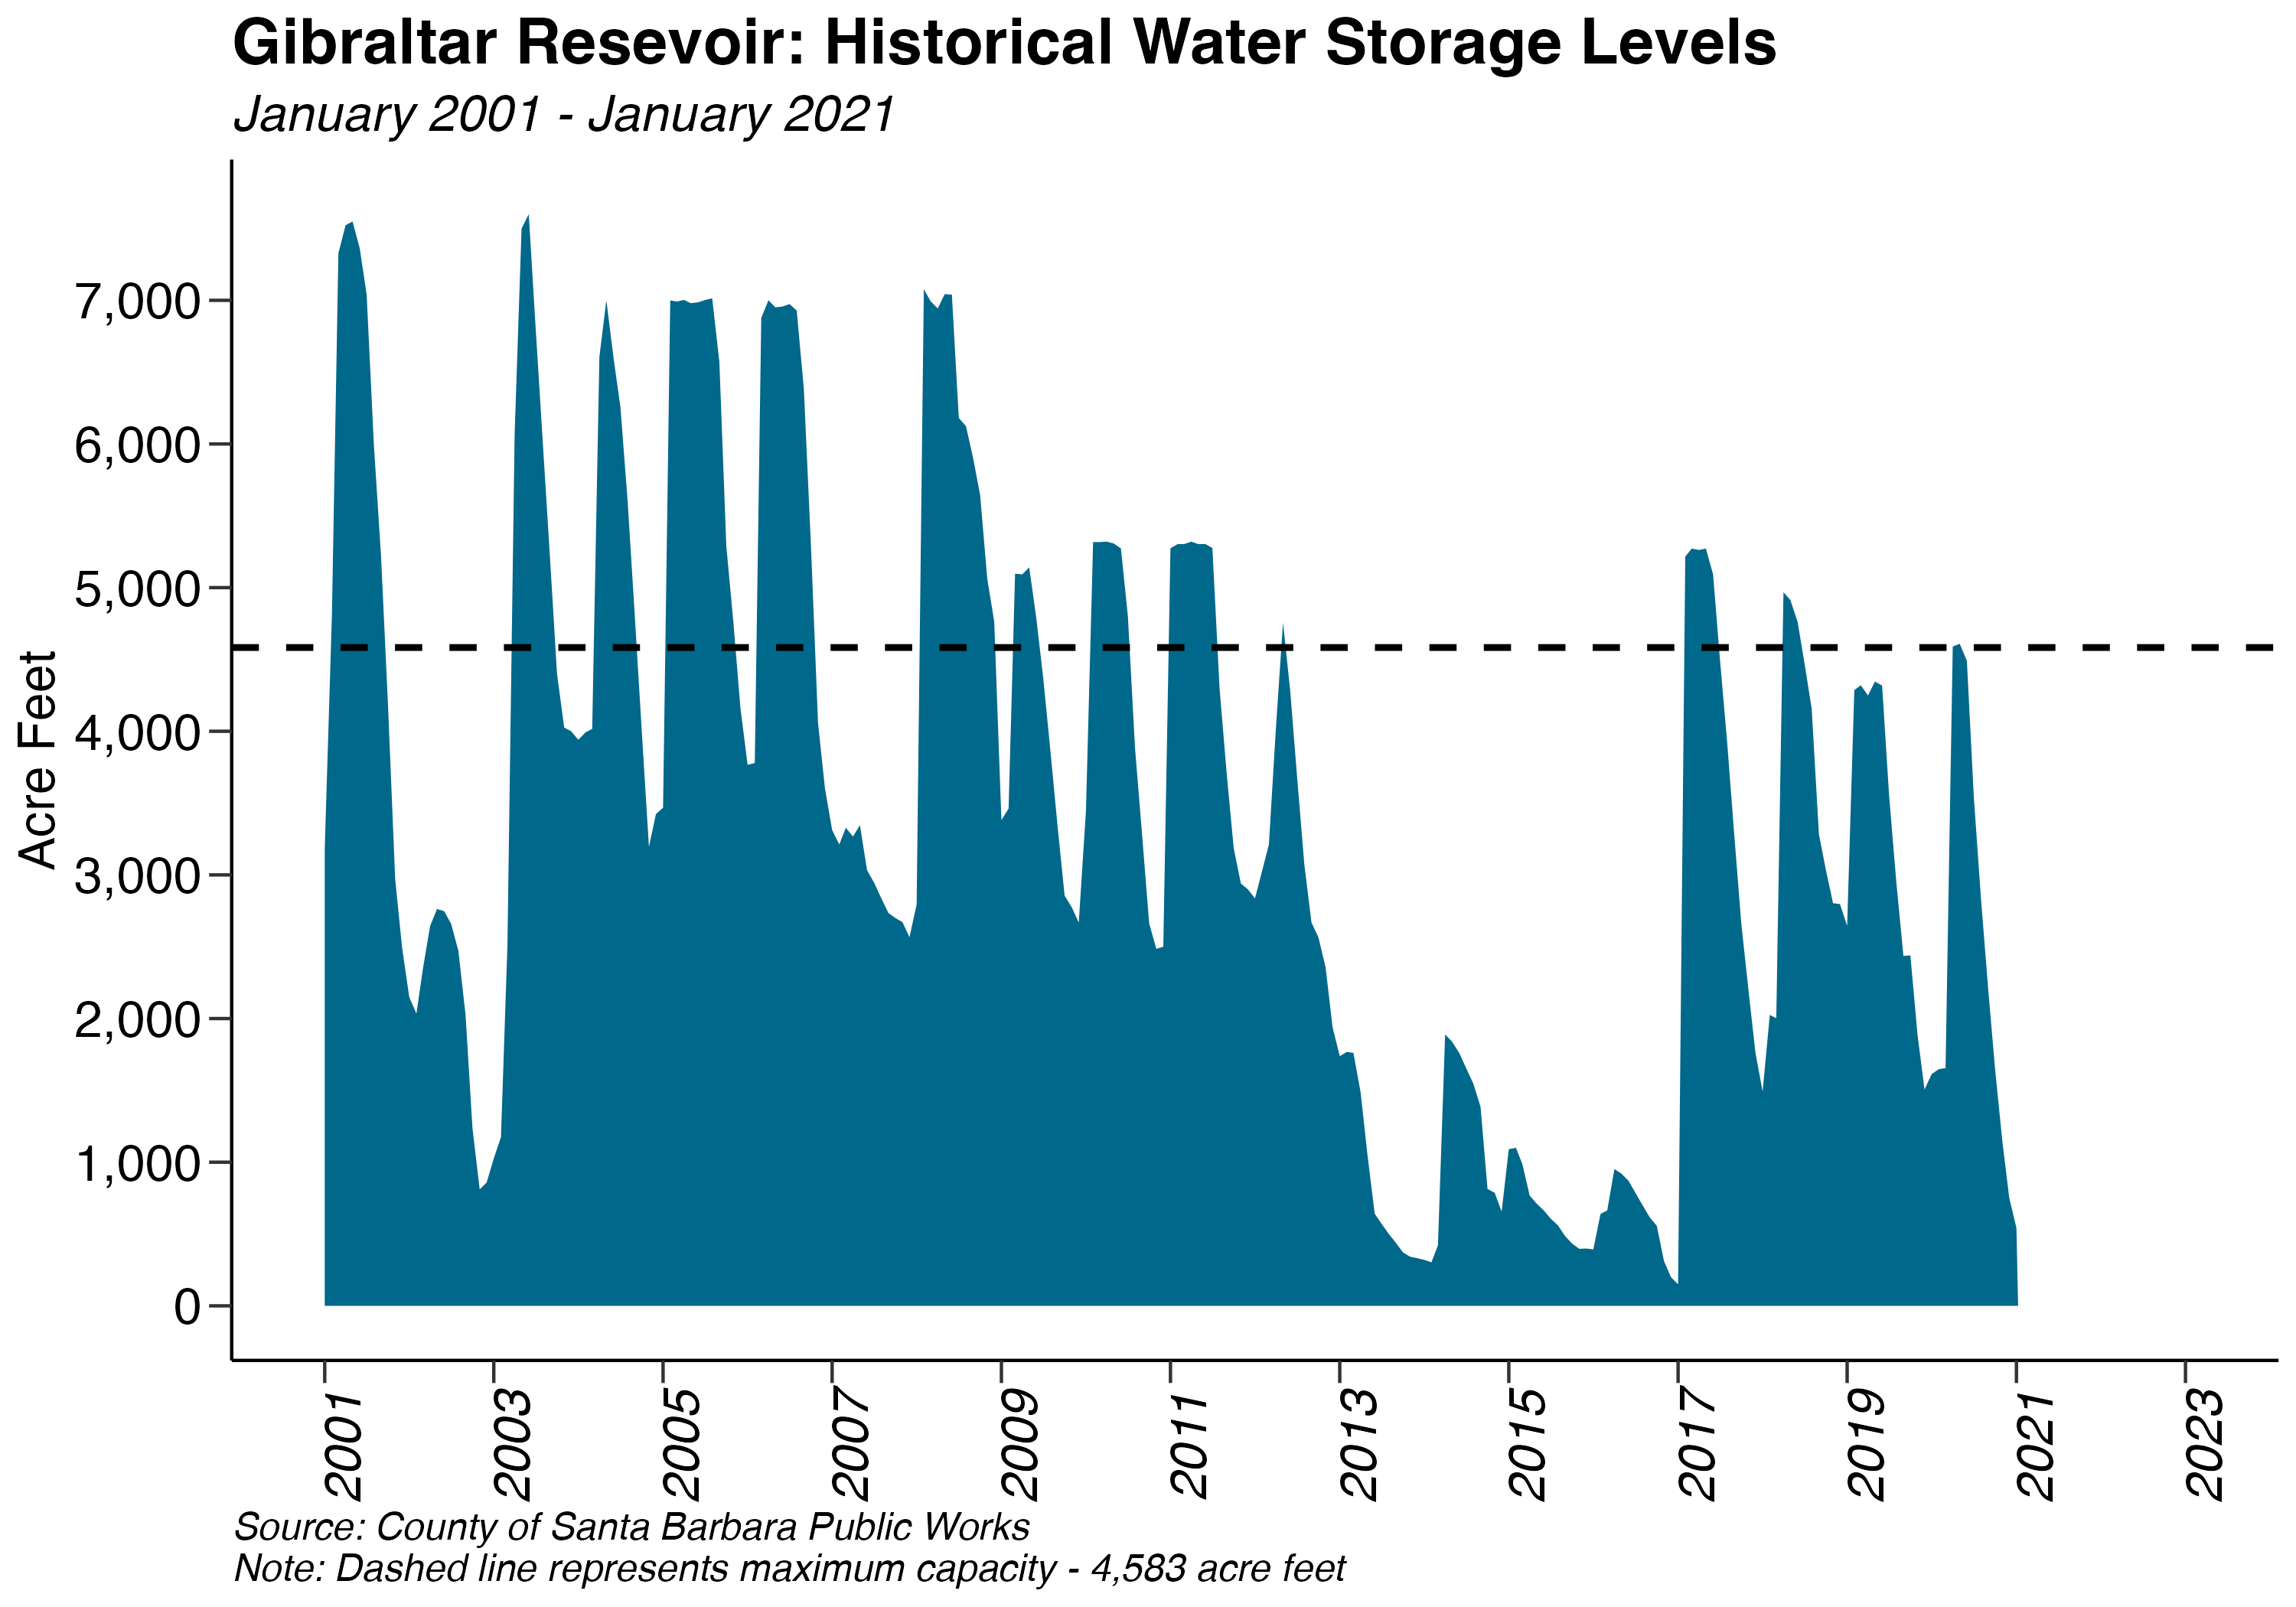
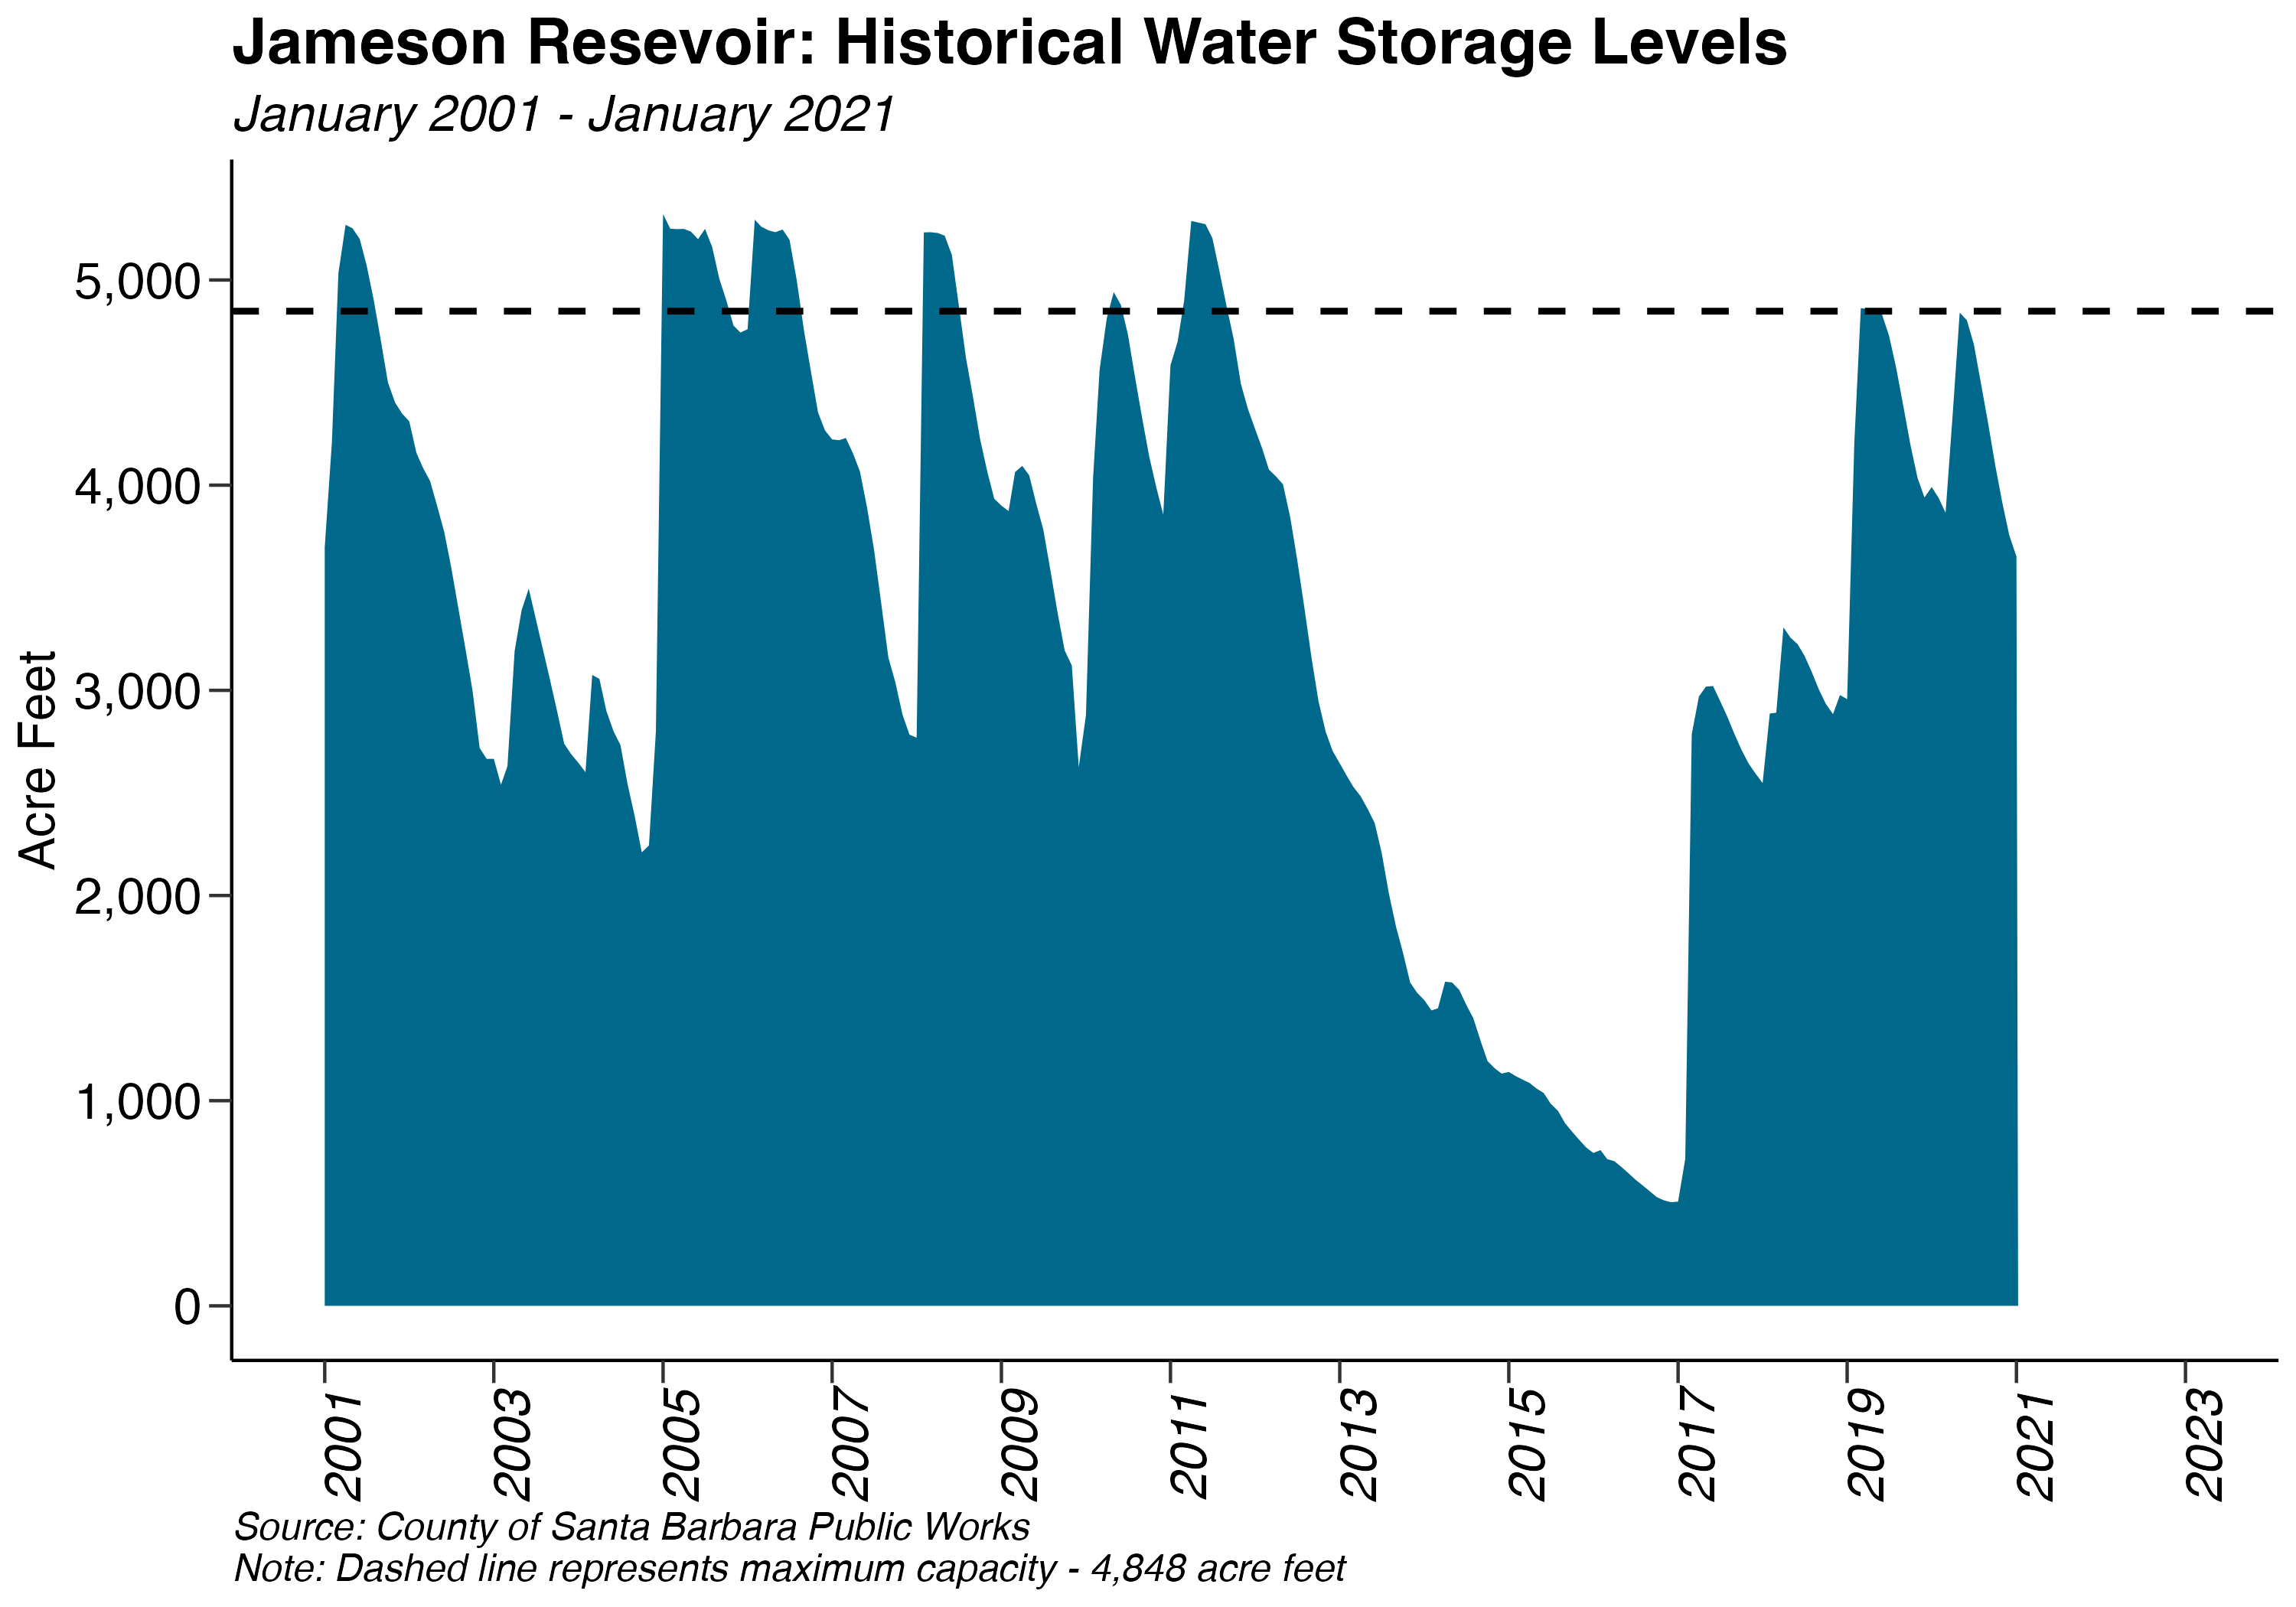
6.4.2 Water Reservoirs
Cachuma, Gibraltar, and Jameson are Santa Barbara County’s major water reservoirs. Reservoir levels are measured in acre-feet (one acre-foot equals 325,851 gallons). Between January 01, 2020, and January 01, 2021, reservoir levels Cachuma decreased by -15,398, decreased by -339 in Jameson, and decreased by -1,071 in Gibraltar. These changes can simply be put into perspective by examining the overall capacity levels of each reservoir. Cachuma experienced an decrease in water capacity from 72.3% to 64.5%. Jameson’s capacity decreased from 82.3% to 73.5% of its maximum water levels. Lastly, the smallest reservoir, Gibraltar, fell from 35.2% to 11.8% of total capacity.
| 2019 Avg (acre-feet) | 2020 Avg (acre-feet) | 1-Year Change | 2-Year Change | 5-Year Change | |
|---|---|---|---|---|---|
| Cachuma | 132,951 | 142,137 | 6.9% | 101.2% | 209.5% |
| Gibraltar | 3,245 | 2,561 | -21.1% | -24.5% | 274.6% |
| Jameson | 4,368 | 4,253 | -2.6% | 41.1% | 332.5% |
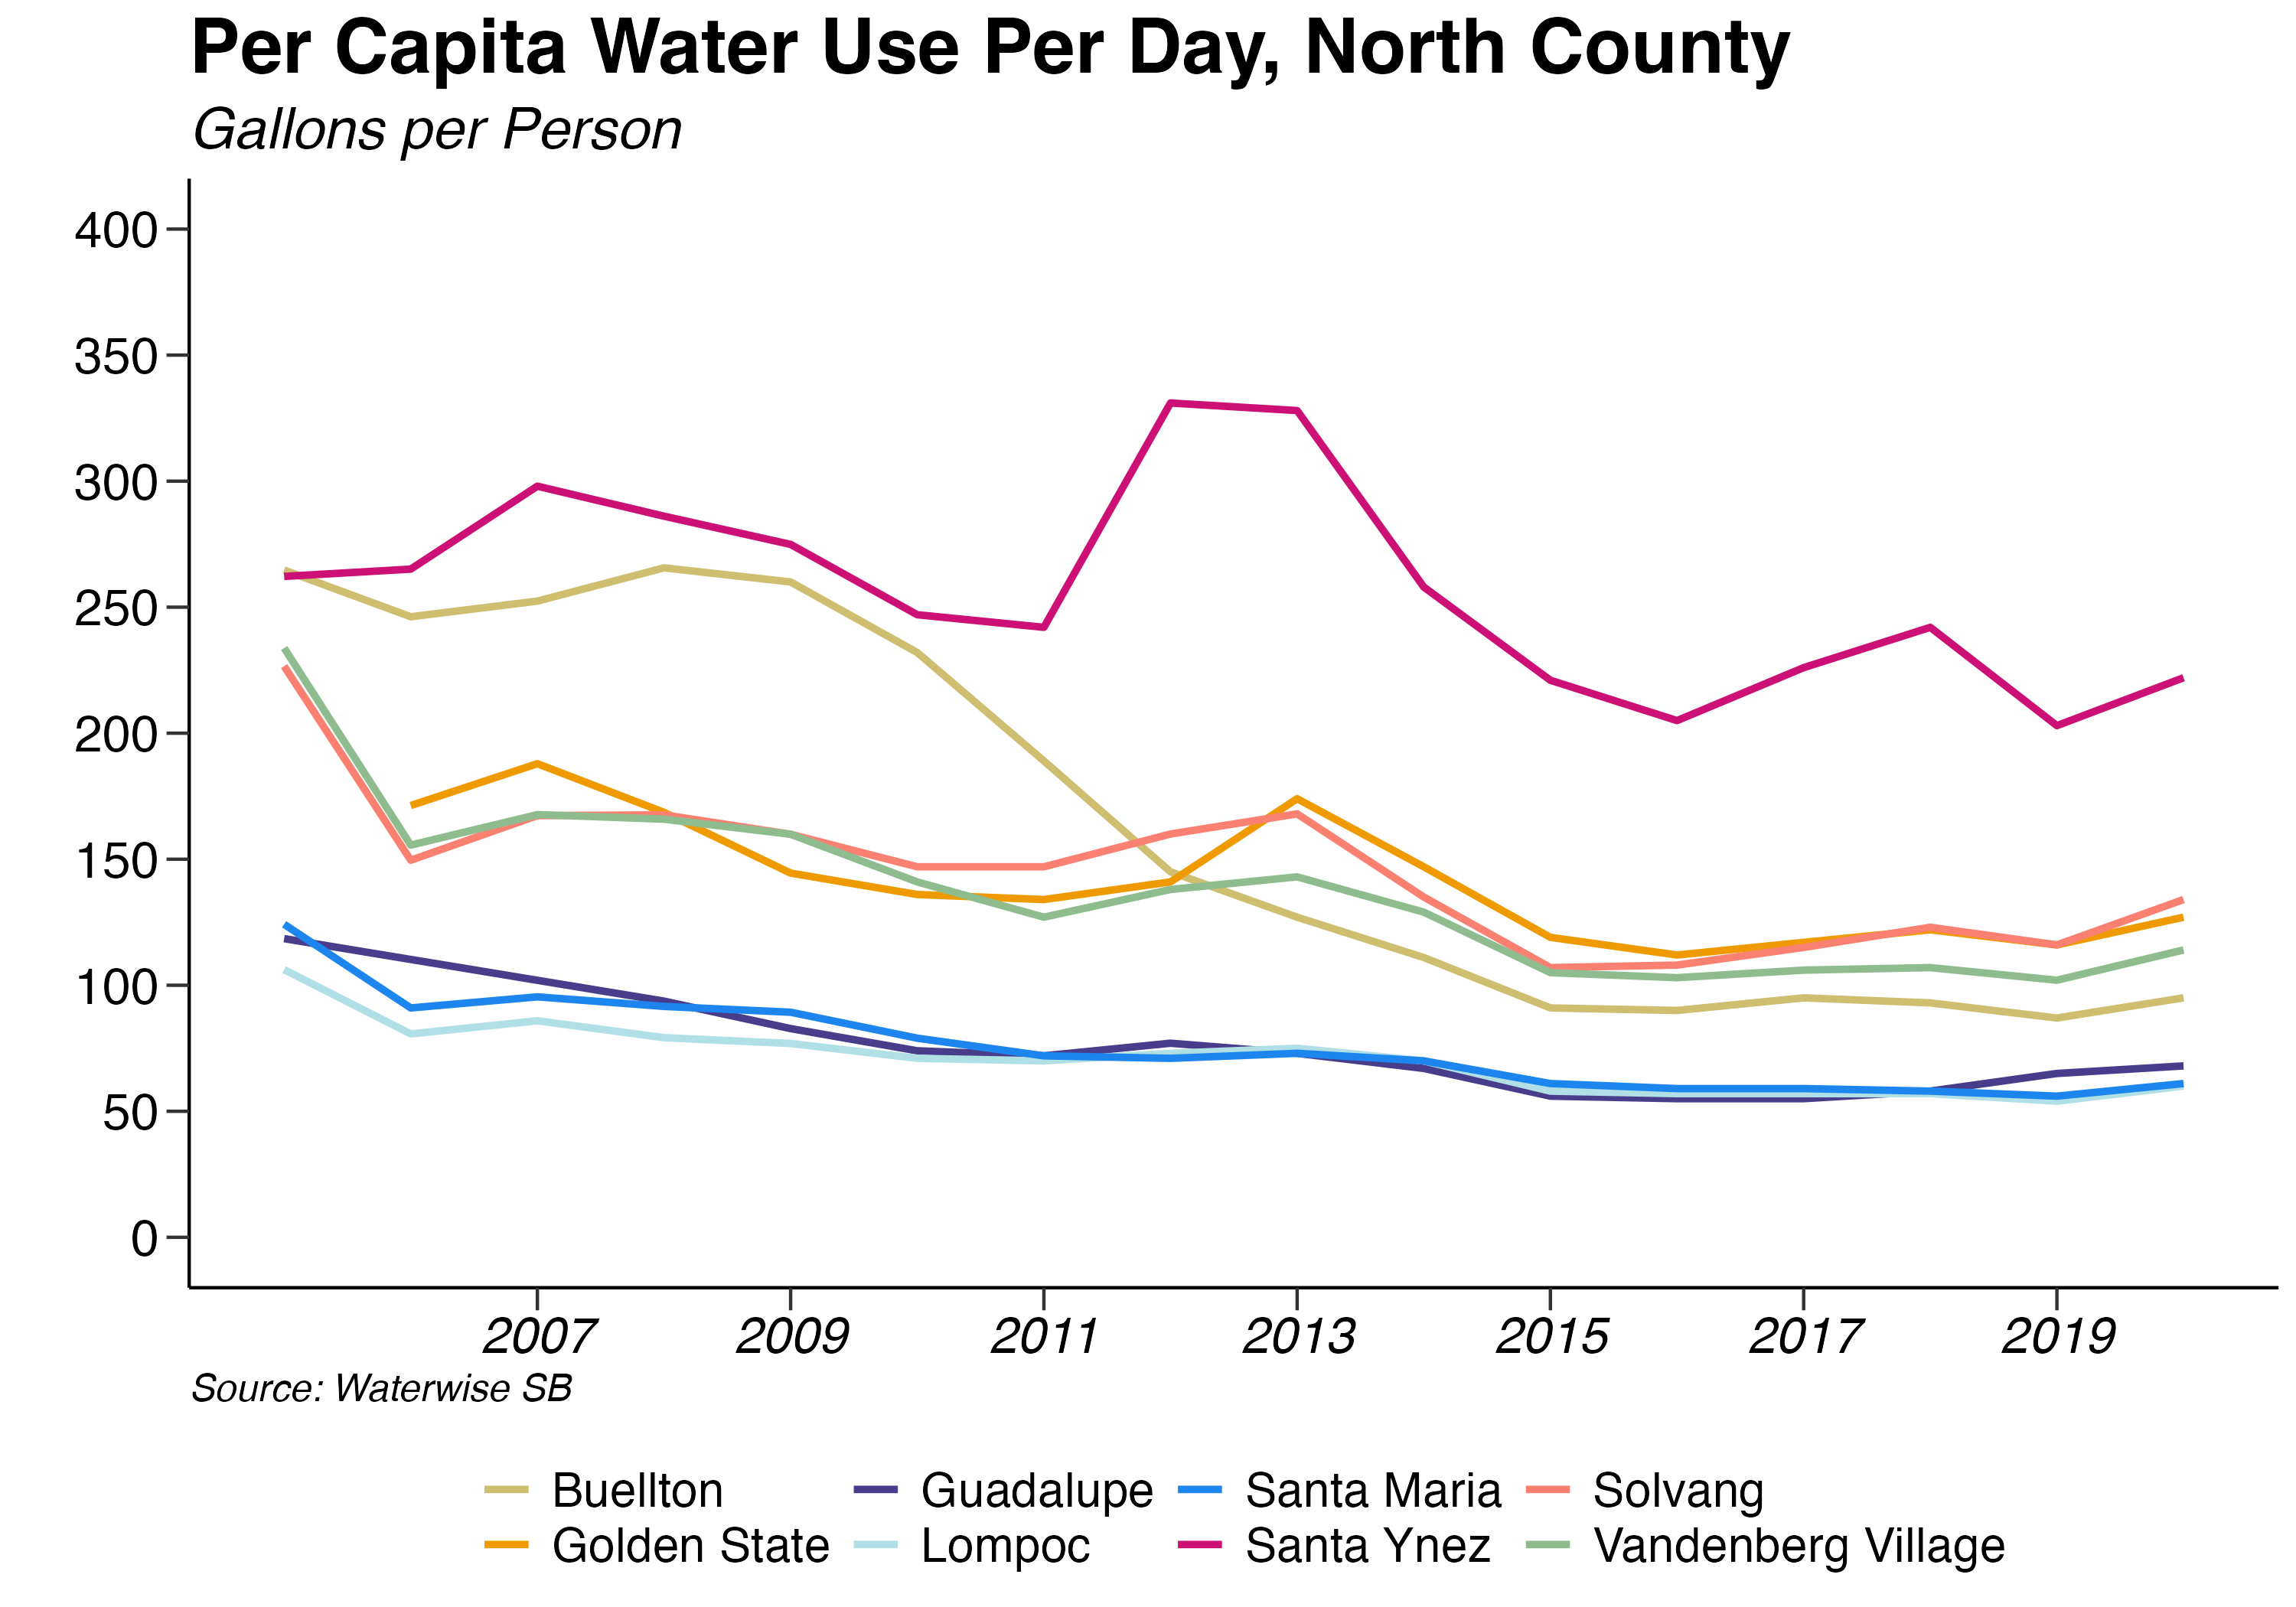
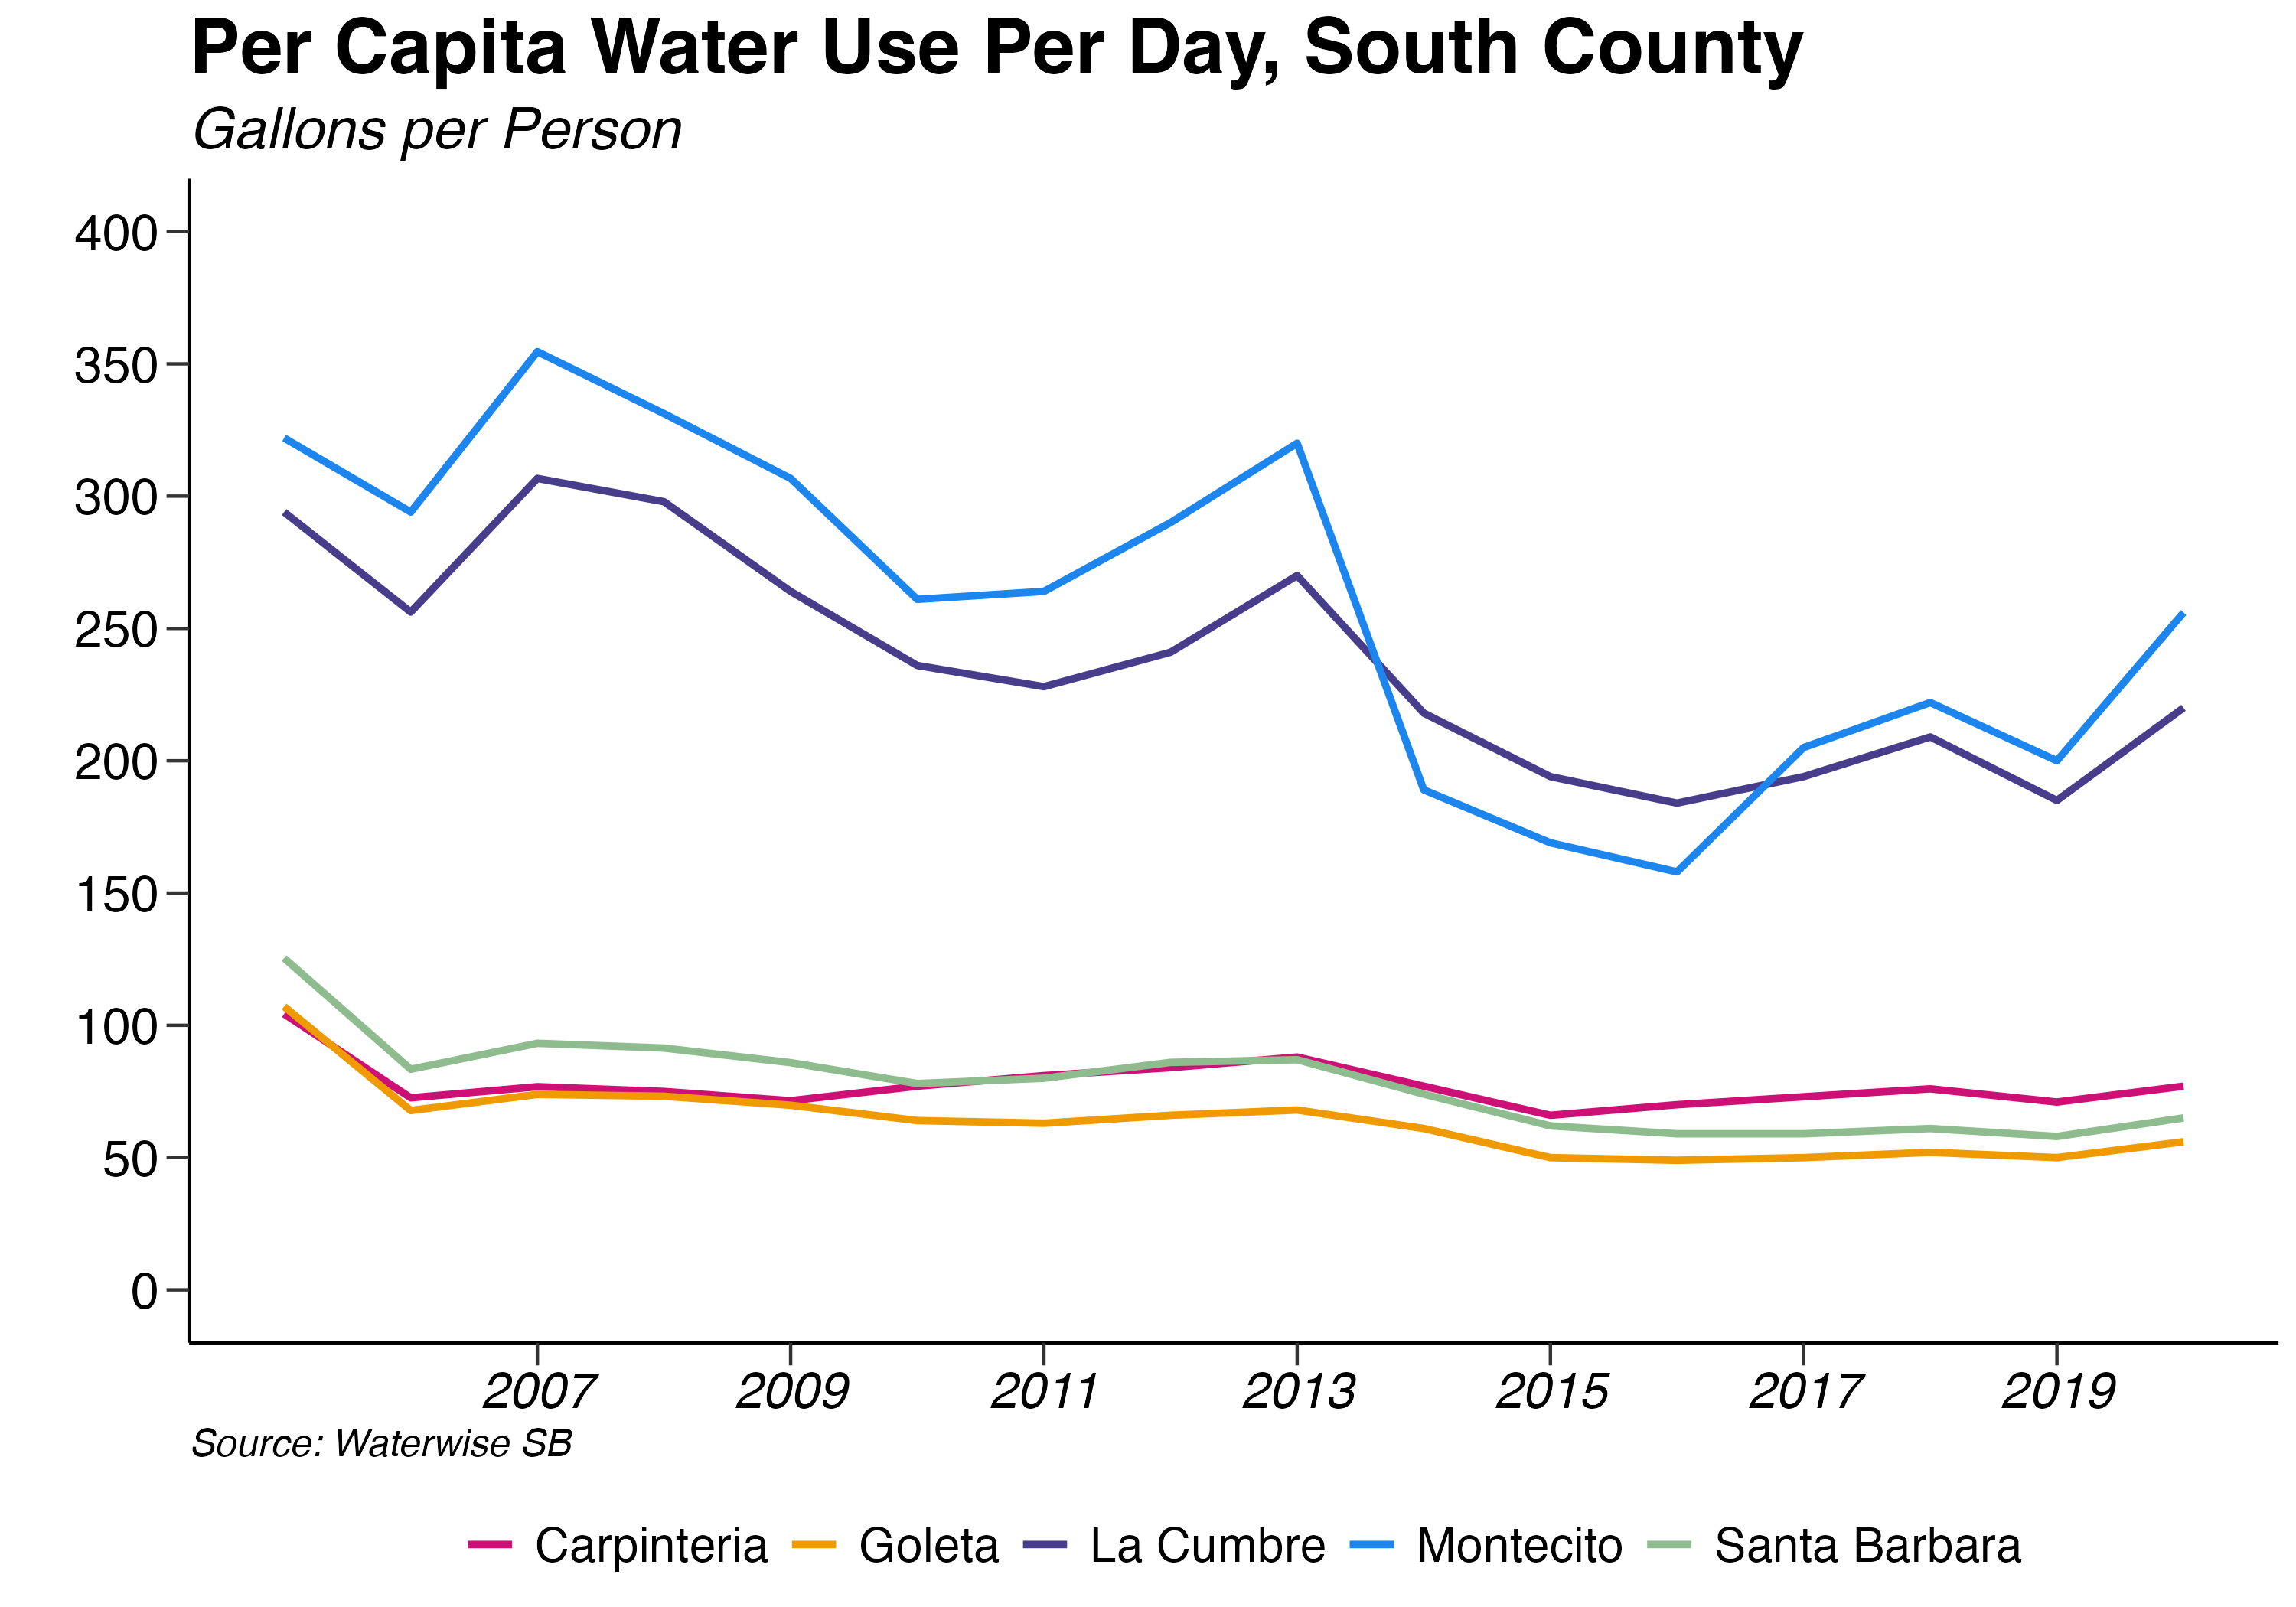
6.4.3 Water Consumption
In 2020, the amount of gallons of water consumed per day for residential purposes within Santa Barbara County increased by an average of 9.69% across all reporting agencies. Water consumption had been declining in the County since 2013, largely driven by regulation due to the mostly continual drought. Between 2020 and 2019, Montecito experienced the largest increase in per-capita residential water consumption– 28%. On the other hand, Mission Hills experienced the largest decline in per-capita residential water consumption– -10.61%. In terms of magnitude, personal daily water consumption varies widely between cities. Montecito and Santa Ynez stand at the upper end of water consumption at 256 and 222 gallons per day, respectively. Casmalia reported 43 gallons per day, the lowest consumption figure in the county.
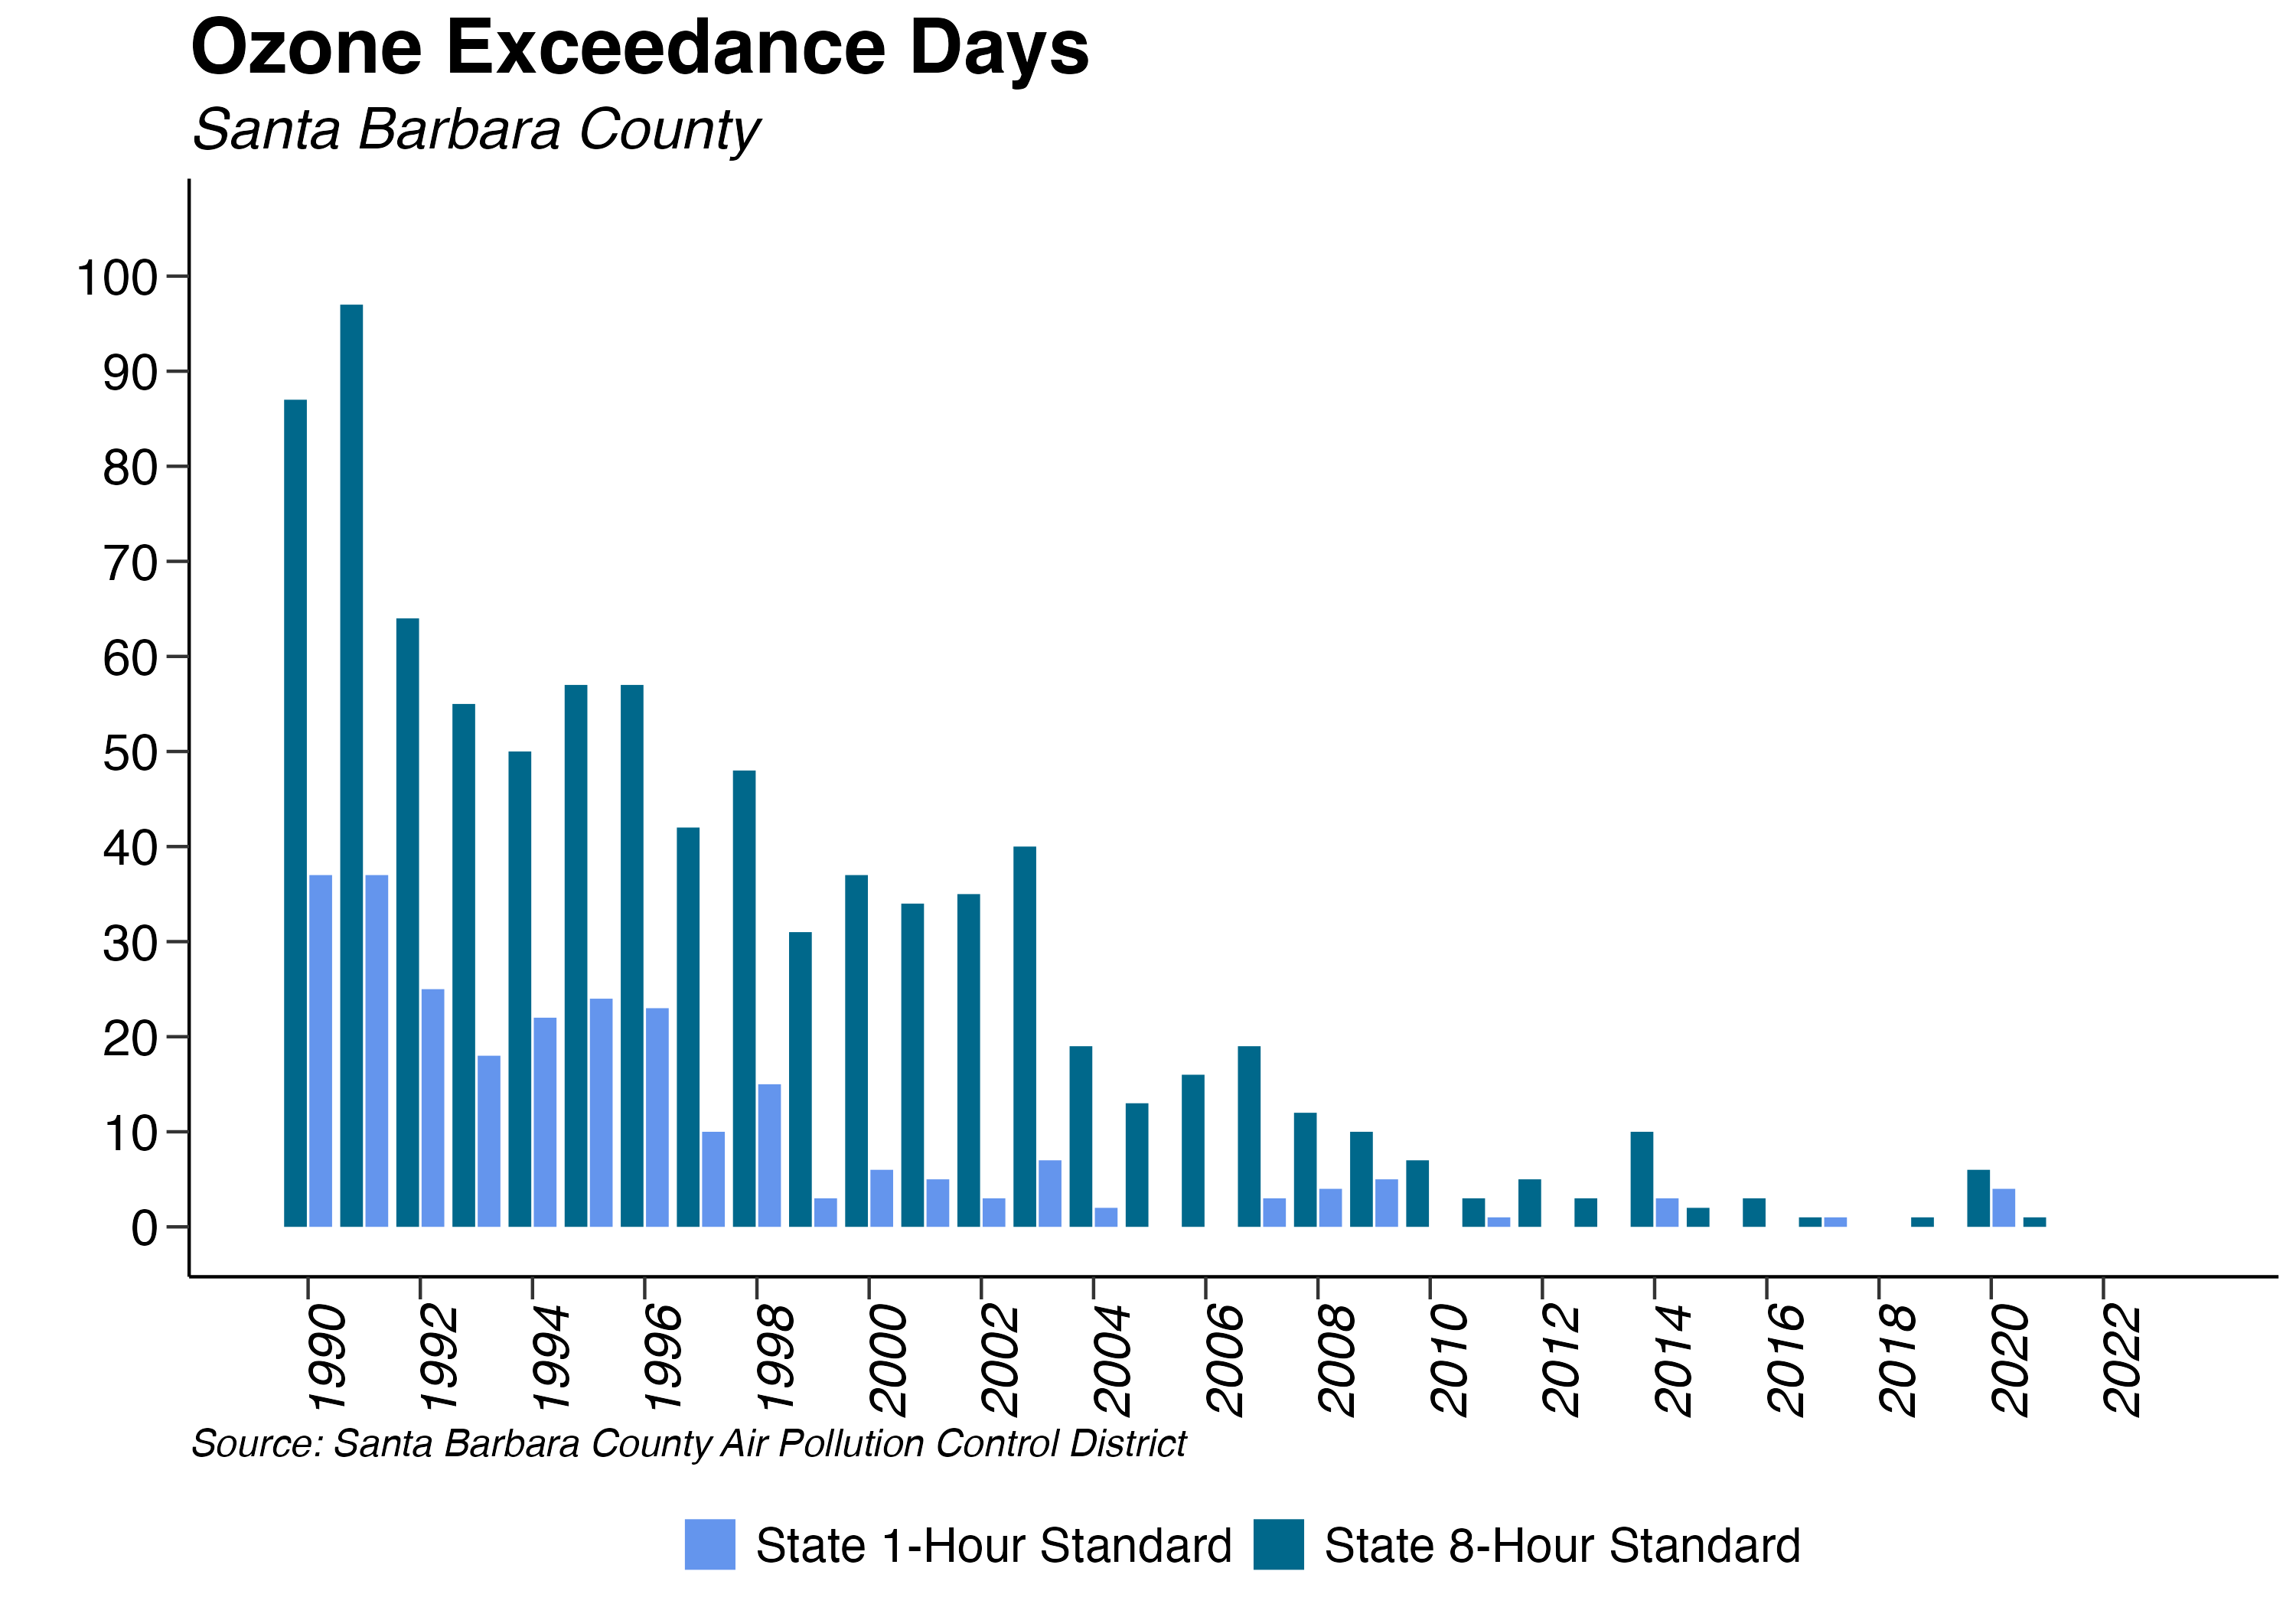
6.4.4 Air Quality
The Santa Barbara Air Pollution Control District has a network of monitoring stations to record the concentration of various air pollutants. Air quality is presented in terms of the number of days the ozone level exceeded the state 8-hour standard of .070 parts per million. In the long view, Santa Barbara County has experienced air quality improvements, which can be seen in the declining number of state 1-hours and 8-hour ozone exceedance days that occurred between 1990 and 2019. Neither 2022 nor 2023 experienced any days where ozone levels exceeded the state 1-hour standard. Moreover, 2023 experienced no days where the ozone level exceeded the state 8-hour standard. 2021’s 1 exceedance day marks one of the lowest levels since 1990, when the number of state 8-hour ozone exceedance days was 87.
National Ambient Air Quality Standards (NAAQS) monitor whether regions in the United States meet certain health standards. These standards tell us how much of a substance can be in the air without causing harm based on proven medical research. In order to receive the attainment designation for regional ozone standards, local data must show that the 8-hour standard was not violated by more than one day per year on average during the previous three calendar years. In other words, regions must not have more than three total 8-hour exceedance days for three consecutive years. Santa Barbara County has experienced 0, 0, 1 exceedance days in 2023, 2022, 2021, respectively. As a result, Santa Barbara County currently boasts the attainment status according to NAAQS.
|
Ozone: Number of Days Above State 8-Hour Standard
|
||||||
|---|---|---|---|---|---|---|
|
Monitoring Station
|
2016
|
2017
|
2018
|
2019
|
2020
|
2021
|
| Carpinteria-Gobernador Road | 0 | 0 | 0 | 0 | 2 | 0 |
| El Capitan Beach | 2 | 0 | 0 | 1 | 0 | 0 |
| Goleta-Fairview | 1 | 0 | 0 | 0 | 0 | 0 |
| Las Flores Canyon #1 | 1 | 1 | 0 | 1 | 2 | 0 |
| Lompoc-HSandP | 0 | 1 | 0 | 0 | 0 | 0 |
| Lompoc-S H Street | 0 | 0 | 0 | 0 | 0 | 0 |
| Nojoqui Pass | 0 | 0 | 0 | 0 | 0 | 0 |
| Paradise Road-Los Padres National Forest | 1 | 0 | 0 | 1 | 4 | 1 |
| Santa Barbara-700 East Canon Perdido | 1 | 0 | 0 | 0 | 2 | 0 |
| Santa Maria-906 S Broadway | 0 | 0 | 0 | 0 | 0 | 0 |
| Santa Ynez-Airport Road | 0 | 0 | 0 | 0 | 0 | 0 |
| Vandenberg Air Force Base-STS Power | 0 | 0 | 0 | 0 | 0 | 0 |
| Countywide | 3 | 0 | 0 | 1 | 6 | 1 |
| Source: Santa Barbara County Air Pollution Control District | ||||||
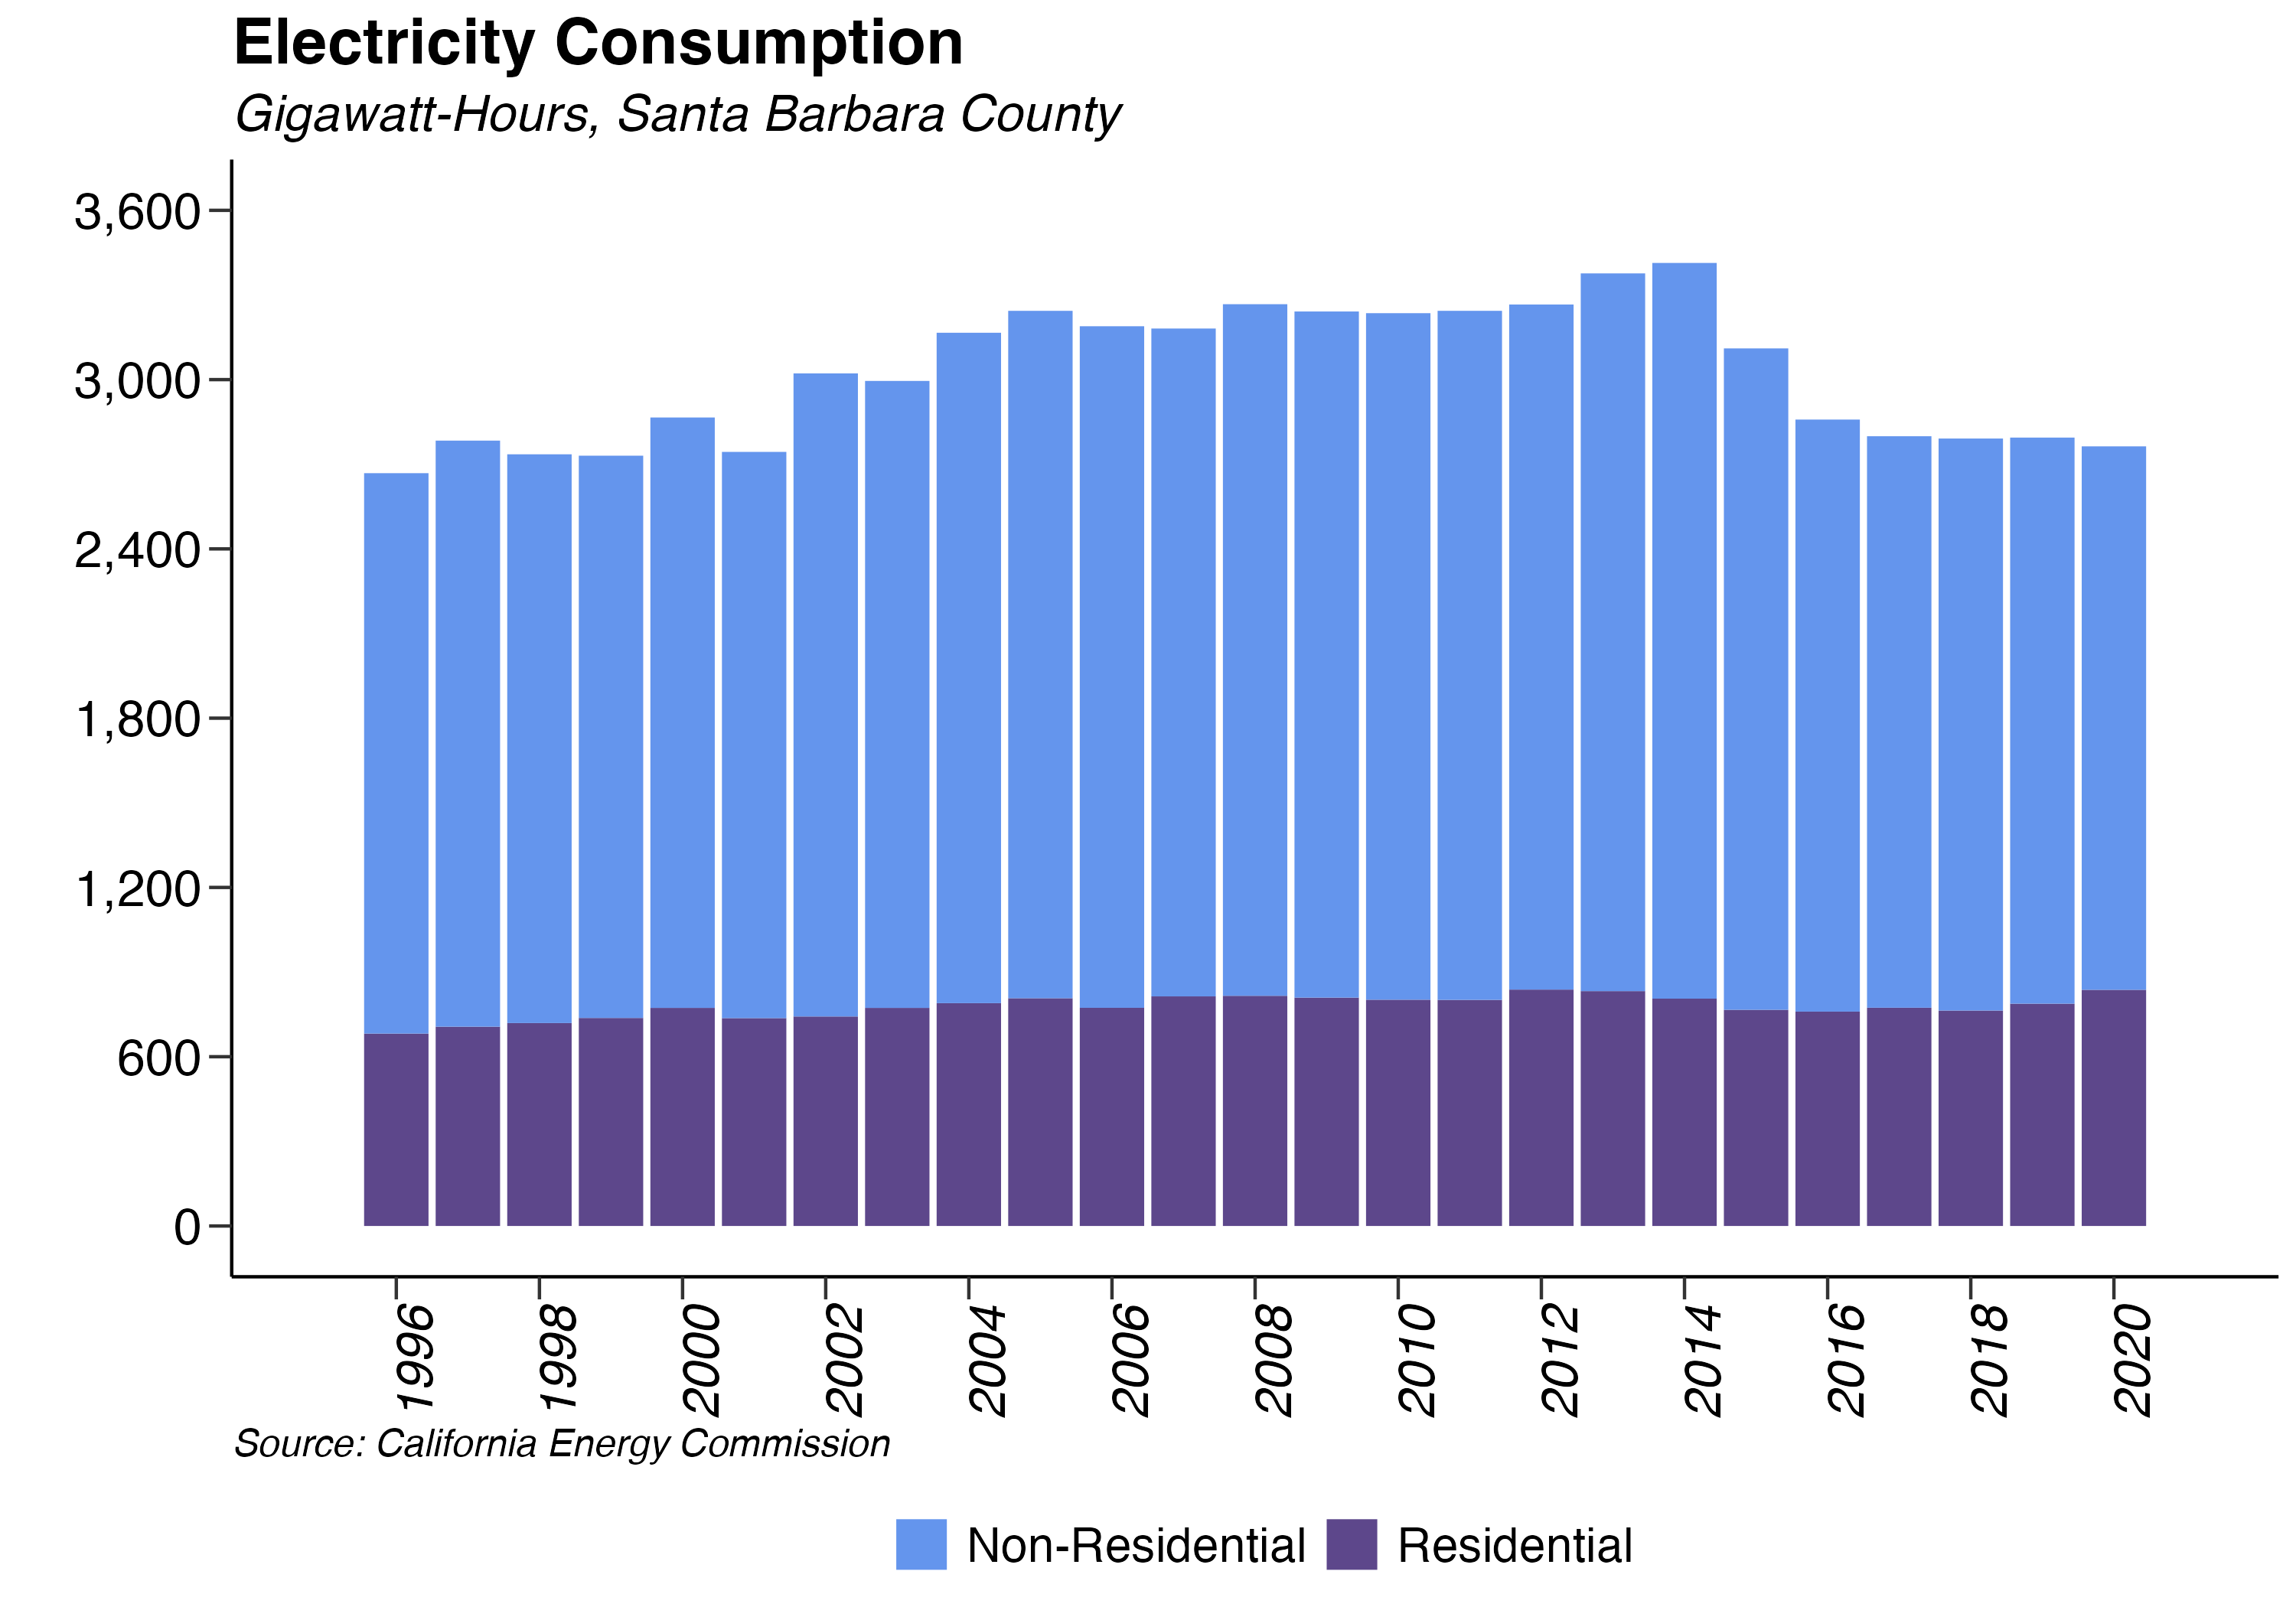
6.4.5 Electricity Consumption
Santa Barbara County’s total energy use fell by -1.1% in 2021, declining from 2,763.41 gigawatt hours to 2,733.044 gigawatt hours. Residential electricity, which made up 0.3% of total electricity consumption in 2021, also fell by -3.09%. The remaining category of electricity consumption, non-residential energy use, decreased by -0.23%. We should expect to continue seeing a decrease in energy consumption as Santa Barbara County establishes its own renewable sources to achieve 100% sustainable energy goals by 2030 – as voted on by the City Council in June 2017.